

Three Strategies for the Critical Use of Statistical Methods in Psychological Research
- PMID: 29795937
- PMCID: PMC5965637
- DOI: 10.1177/0013164416668234
Three Strategies for the Critical Use of Statistical Methods in Psychological Research
Abstract
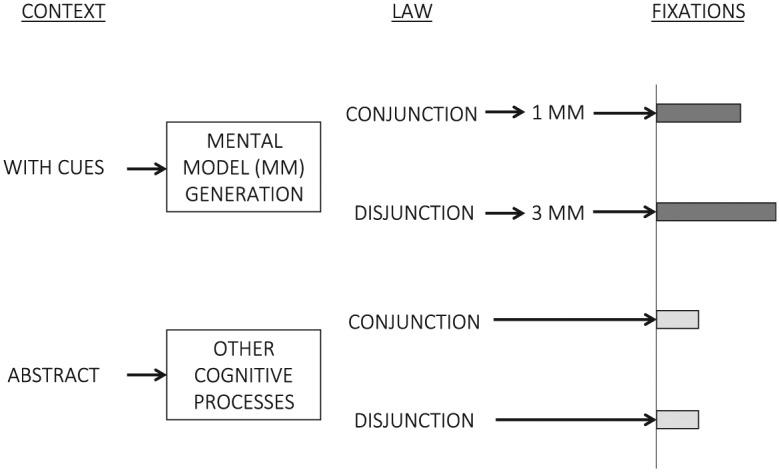
We present three strategies to replace the null hypothesis statistical significance testing approach in psychological research: (1) visual representation of cognitive processes and predictions, (2) visual representation of data distributions and choice of the appropriate distribution for analysis, and (3) model comparison. The three strategies have been proposed earlier, so we do not claim originality. Here we propose to combine the three strategies and use them not only as analytical and reporting tools but also to guide the design of research. The first strategy involves a visual representation of the cognitive processes involved in solving the task at hand in the form of a theory or model together with a representation of a pattern of predictions for each condition. The second approach is the GAMLSS approach, which consists of providing a visual representation of distributions to fit the data, and choosing the best distribution that fits the raw data for further analyses. The third strategy is the model comparison approach, which compares the model of the researcher with alternative models. We present a worked example in the field of reasoning, in which we follow the three strategies.
Keywords: GAMLSS; data visualization; model comparison approach; multilevel analysis; null hypothesis.
Conflict of interest statement
Declaration of Conflicting Interests: The author(s) declared no potential conflicts of interest with respect to the research, authorship, and/or publication of this article.
Figures


References
-
- Anderson J. R., Bothell D., Byrne M. D., Douglass S., Lebiere C., Qin Y. (2004). An integrated theory of the mind. Psychological Review, 111, 1036-1060. - PubMed
-
- Bates D. M. (2010). lme4: Mixed-effects modelling with R. Madison, WI: Springer.
-
- Berger J. O., Pericchi L. R. (1996). The intrinsic Bayes factor for model selection and prediction. Journal of the American Statistical Association, 91, 109-122.
Associated data
LinkOut - more resources
Full Text Sources
Other Literature Sources