. 2018 Aug 1;159(8):2891-2904.
doi: 10.1210/en.2018-00107.

Premature Expression of FOXO1 in Developing Mouse Pituitary Results in Anterior Lobe Hypoplasia

Affiliations

Premature Expression of FOXO1 in Developing Mouse Pituitary Results in Anterior Lobe Hypoplasia

Caitlin E Stallings et al. Endocrinology. .

Abstract

The process by which the somatotrope lineage emerges in the developing pituitary is regulated by the activity of specific signaling and transcription factors expressed during development. We set out to understand the contribution of FOXO1 to that process by using a mouse model in which FOXO1 is prematurely expressed in the pituitary primordium. Expression of FOXO1 in the oral ectoderm as early as embryonic day (e)9.5 resulted in pituitary gland hypoplasia and reduced expression of anterior lobe hormone transcripts at e18.5. Of note, the relative numbers of somatotropes and thyrotropes were also decreased at e18.5. LHX3 and PITX2, markers of pituitary identity, were present in a reduced number of cells during the formation of the Rathke pouch. Thus, premature expression of FOXO1 may affect adoption of pituitary identity during differentiation. Our results demonstrate that the timing of FOXO1 activation affects its role in pituitary gland organogenesis and somatotrope differentiation.


Figures
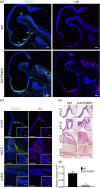
Figure 1.
Figure 1.
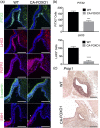
Ectopic expression of FOXO1 was detected by both anti-HA and anti-FOXO1 antibodies. (a) Midsagittal sections from e10.5 embryos comparing FOXO1 (green) and HA (red) with nuclei in blue via IHC. Endogenous FOXO1 was detected throughout the ventral telencephalon and rostral of the ventral diencephalon in the anterior hypothalamus in both WT and CA-FOXO1 animals. CA-FOXO1 animals showed an expanded region of nuclear FOXO1-positive cells within the telencephalon and in the oral ectoderm, particularly notable when HA expression was compared with endogenous protein. Additional ectopic expression was also observed in the spinal cord and tegmentum. (b) CA-FOXO1 mice were collected at e10.5, e12.5, and e18.5, and IHC using TSA amplification was performed against HA (red) and FOXO1 (green). A minimum of three sections per animal were analyzed, and CA-FOXO1 mice are shown with WT controls (insets). Midsagittal sections were used for e10.5 and e12.5 and coronal sections for e18.5. HA protein was evident in all CA-FOXO1 sections but not in control tissue. Nuclear FOXO1 was detected in CA-FOXO1 pituitary gland tissue but not in WT glands except at e18.5. (c) H&E staining of CA-FOXO1 and WT embryos to determine pituitary gland morphology during embryonic development. CA-FOXO1 adenohypophyseal tissue appeared reduced compared with that of controls. (d) Comparison of pituitary volume (anterior lobe) between CA-FOXO1 and WT animals using the point-count stereological technique. CA-FOXO1 anterior lobe at e18.5 was approximately 12% the size of WT controls. Data are represented as mean ± SEM. Significance was determined using the Student t test. **P < 0.01. All scale bars indicate 100 µm. oe, oral ectoderm; poa, preoptic area; tg, tegmentum; vd, ventral diencephalon; vt, ventral telencephalon.
Figure 2.
Figure 2.
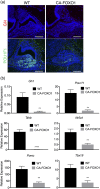
Apoptosis was evaluated using the TUNEL assay. Three sections per animal were analyzed. (a) CA-FOXO1 and control embryos were compared by evaluating the number and localization of apoptotic cells at e10.5 to e12.5. Cells undergoing apoptosis are shown in green. DAPI was used as a stain for nuclei (blue). (b) The number of apoptotic cells was counted and compared between WT and control animals according to localization. No apoptotic cells were present in the Rathke pouch in WT controls, and significantly more cells underwent apoptosis in the anterior hypothalamus at e10.5 in CA-FOXO1 embryos than in control embryos, but not at other time points. Data are represented as mean ± SEM and were compared using the Student t test. *P < 0.05. All scale bars indicate 100 µm. ah, anterior hypothalamus; mes, mesenchyme; ND, not detected; oe, oral ectoderm; poa, preoptic area; rp, Rathke pouch; vd, ventral diencephalon.
Figure 3.
Figure 3.
Cellular proliferation was evaluated using the BrdU incorporation assay and IHC against pHH3. Two to three sections per animal were analyzed for a minimum of three (pHH3) or five (BrdU) litters. (a) CA-FOXO1 and control embryos were compared by evaluating the number and localization of proliferating cells at e10.5 to e12.5. Proliferation was assessed by injecting pregnant dams with BrdU and collecting pups 2 hours later. Midsagittal sections were evaluated for BrdU incorporation using IHC, with BrdU shown in red and nuclei shown in blue. (c) Anti-pHH3 antibody was used to detect cells in G2 or M phases of the cell cycle (red). All scale bars indicate 100 µm. (b, d) The numbers of proliferating cells were counted and compared with the total number of DAPI-stained cells in the anterior lobe and measured for significance using the Student t test. Data are represented as mean ± SEM. A significant increase was seen in the BrdU assay at e12.5. ***P < 0.001.
Figure 4.
Figure 4.
(a) Immunofluorescent detection of important early signaling and transcription factors in pituitary development at e10.5. All signals were amplified using TSA signal amplification. Adjacent sections of control and CA-FOXO1 tissues were compared for protein localization of PITX2 and LHX3. Additional midsagittal sections were evaluated for FGFR1, β-catenin, and SHH. Three to five sections per animal were analyzed. White arrowheads delineate the region of ventral diencephalon positive for SHH. All scale bars indicate 100 µm. (b) The number of cells positive for either PITX2 or LHX3 were counted in WT and CA-FOXO1 oral ectoderm. There were significantly fewer cells presenting with the transcription factors in the CA-FOXO1 embryos, indicating fewer cells with pituitary identity. Data are represented as mean ± SEM. The Student t test was used to determine significance. ***P < 0.001; ****P < 0.0001. (c) Prop1 was detected using in situ hybridization. Both WT and CA-FOXO1 animals expressed Prop1 in the Rathke pouch at e12.5, although it appeared reduced in mutant animals. Scale bars indicate 100 µm.
Figure 5.
Figure 5.
(a) Immunofluorescent detection of GH and POU1F1 in midsagittal sections from e15.5 animals. Neither WT nor CA-FOXO1 mice displayed positive immunostaining for GH, whereas POU1F1 was detected in both. Representative sections are shown from three and four litters (POU1F1 and GH, respectively), and scale bars indicate 100 µm. (b) qRT-PCR analysis of various early signaling factors at e15.5. Litters were analyzed by combining both male and female samples. Expression is presented relative to Tfrc. Data are expressed as mean ± SEM of six animals of each genotype. Statistics were performed using the Student t test for significance. **P < 0.01; ****P < 0.0001.
Figure 6.
Figure 6.
qRT-PCR analysis of hormone transcripts in WT and CA-FOXO1 anterior lobe samples at e18.5. Litters were analyzed by combining both male and female samples. Expression is presented relative to Tfrc. Data are expressed as mean ± SEM of eight animals of each genotype. Statistics were performed using the Mann-Whitney test for significance. **P < 0.01; ***P < 0.001.
Figure 7.
Figure 7.
(a) Immunofluorescent detection of anterior lobe hormones in coronal sections of e18.5 animals. Three or four sections per animal were analyzed. Scale bars indicate 100 μm. Top panels are WT and bottom panels are CA-FOXO1 representative samples. (b) The total number of immune-positive cells were counted per section. Data are represented as mean ± SEM. (c) Immune-positive cells were counted and normalized according to total anterior lobe area by measuring DAPI staining with ImageJ. Data are expressed as mean ± SEM of three animals of each genotype. The number of GH-positive cells and TSH-positive cells were significantly reduced in CA-FOXO1 mice. The Student t test was used to determine significance. ***P < 0.001; ****P < 0.0001.

Similar articles

Cited by

References

    1. Davis SW, Ellsworth BS, Perez Millan MI, Gergics P, Schade V, Foyouzi N, Brinkmeier ML, Mortensen AH, Camper SA. Pituitary gland development and disease: from stem cell to hormone production. Curr Top Dev Biol. 2013;106:1–47. - PMC - PubMed
    1. Rizzoti K. Genetic regulation of murine pituitary development. J Mol Endocrinol. 2015;54(2):R55–R73. - PMC - PubMed
    1. Savage JJ, Yaden BC, Kiratipranon P, Rhodes SJ. Transcriptional control during mammalian anterior pituitary development. Gene. 2003;319:1–19. - PubMed
    1. Kapali J, Kabat BE, Schmidt KL, Stallings CE, Tippy M, Jung DO, Edwards BS, Nantie LB, Raeztman LT, Navratil AM, Ellsworth BS. Foxo1 is required for normal somatotrope differentiation. Endocrinology. 2016;157(11):4351–4363. - PMC - PubMed
    1. Brinkmeier ML, Davis SW, Carninci P, MacDonald JW, Kawai J, Ghosh D, Hayashizaki Y, Lyons RH, Camper SA. Discovery of transcriptional regulators and signaling pathways in the developing pituitary gland by bioinformatic and genomic approaches. Genomics. 2009;93(5):449–460. - PMC - PubMed

Publication types

MeSH terms