Comparative Study
. 2018 Aug 1;35(8):1916-1933.
doi: 10.1093/molbev/msy094.

Demographic History and Genetic Adaptation in the Himalayan Region Inferred from Genome-Wide SNP Genotypes of 49 Populations

Affiliations
Comparative Study

Demographic History and Genetic Adaptation in the Himalayan Region Inferred from Genome-Wide SNP Genotypes of 49 Populations

Elena Arciero et al. Mol Biol Evol. .

Abstract

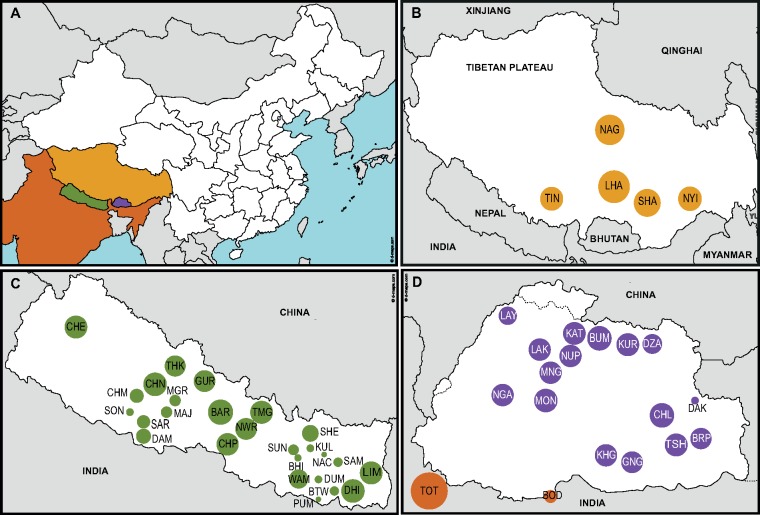
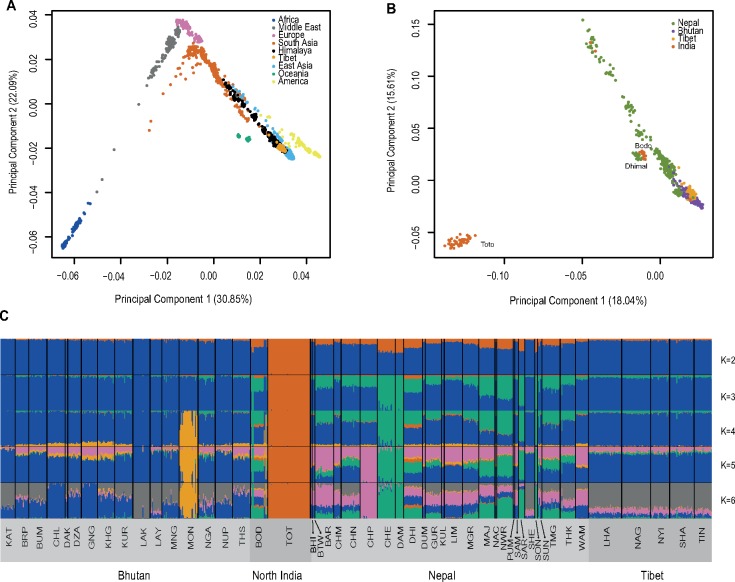
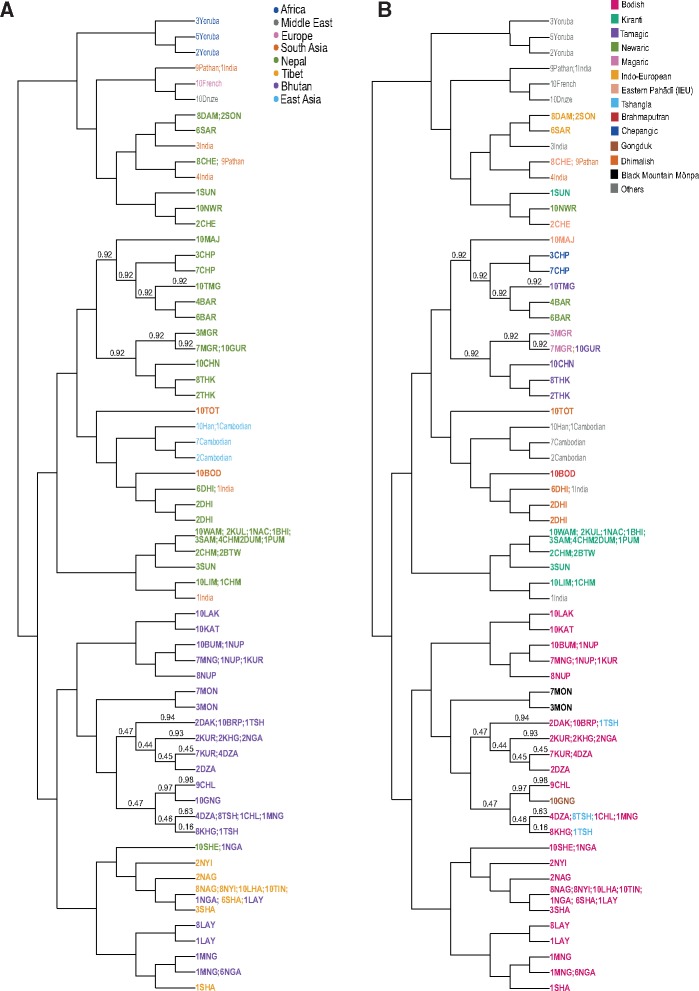
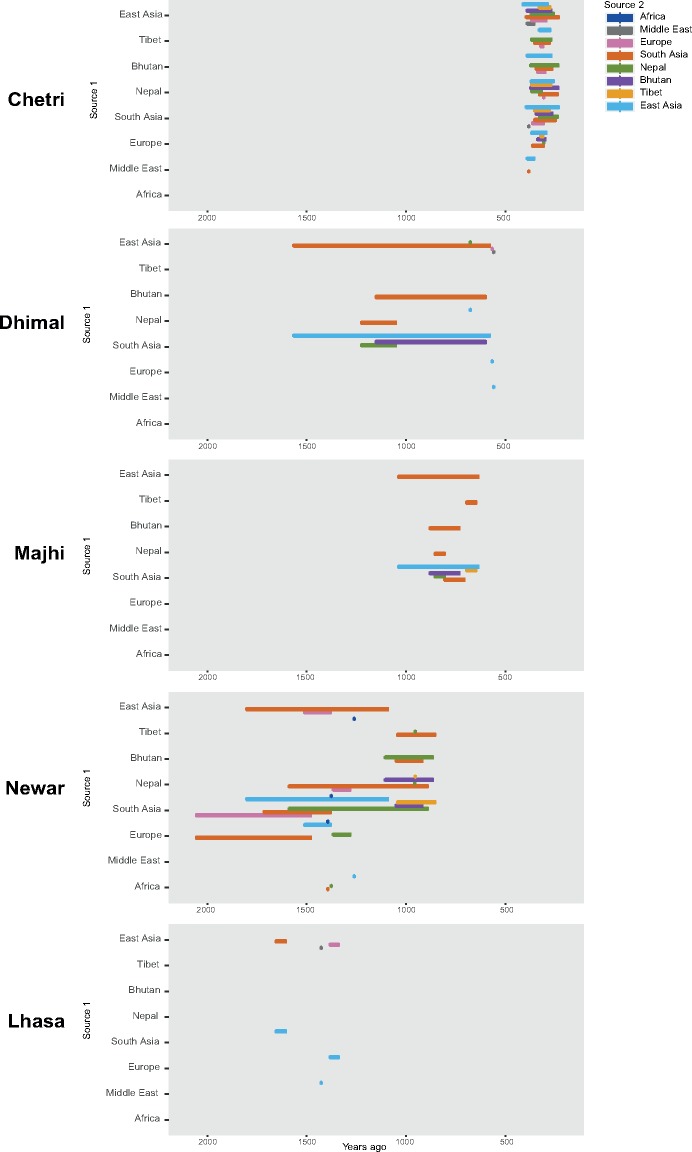
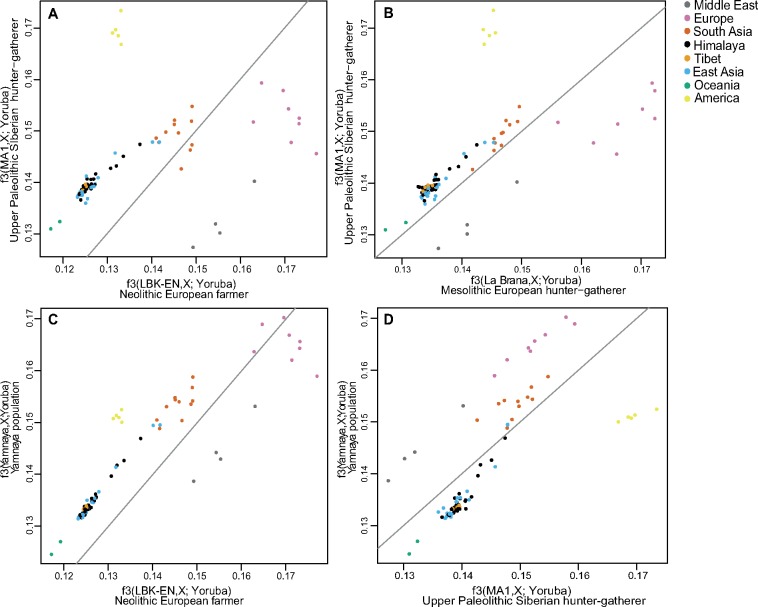
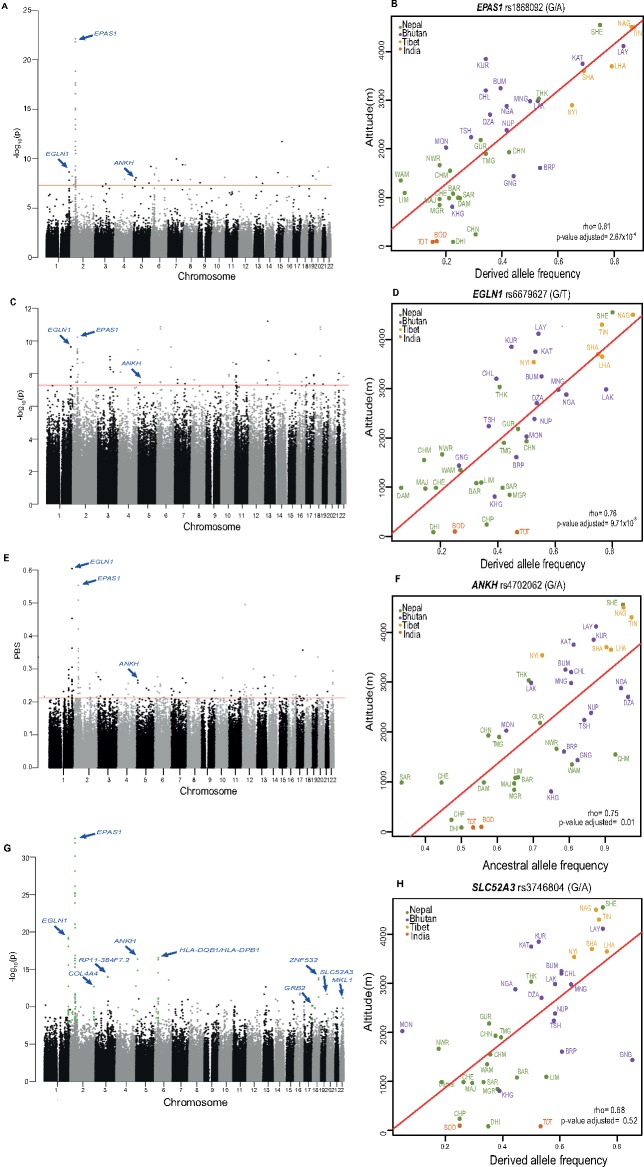
We genotyped 738 individuals belonging to 49 populations from Nepal, Bhutan, North India, or Tibet at over 500,000 SNPs, and analyzed the genotypes in the context of available worldwide population data in order to investigate the demographic history of the region and the genetic adaptations to the harsh environment. The Himalayan populations resembled other South and East Asians, but in addition displayed their own specific ancestral component and showed strong population structure and genetic drift. We also found evidence for multiple admixture events involving Himalayan populations and South/East Asians between 200 and 2,000 years ago. In comparisons with available ancient genomes, the Himalayans, like other East and South Asian populations, showed similar genetic affinity to Eurasian hunter-gatherers (a 24,000-year-old Upper Palaeolithic Siberian), and the related Bronze Age Yamnaya. The high-altitude Himalayan populations all shared a specific ancestral component, suggesting that genetic adaptation to life at high altitude originated only once in this region and subsequently spread. Combining four approaches to identifying specific positively selected loci, we confirmed that the strongest signals of high-altitude adaptation were located near the Endothelial PAS domain-containing protein 1 and Egl-9 Family Hypoxia Inducible Factor 1 loci, and discovered eight additional robust signals of high-altitude adaptation, five of which have strong biological functional links to such adaptation. In conclusion, the demographic history of Himalayan populations is complex, with strong local differentiation, reflecting both genetic and cultural factors; these populations also display evidence of multiple genetic adaptations to high-altitude environments.


Figures

<sc>Fig</sc>. 1.
Fig. 1.
Population samples analyzed in this study. (A) Map of South and East Asia, highlighting the four regions examined, and the colour assigned to each. (B) Samples from the Tibetan Plateau. (C) Samples from Nepal. (D) Samples from Bhutan and India. The circle areas are proportional to the sample sizes. The three letter population codes in (B–D) are defined in supplementary table S1, Supplementary Material online.
<sc>Fig</sc>. 2.
Fig. 2.
Genetic structure of the Himalayan region populations from analyses using unlinked SNPs. (A) PCA of the Himalayan and HGDP-CEPH populations. Each dot represents a sample, coded by region as indicated. The Himalayan region samples lie between the HGDP-CEPH East Asian and South Asian samples on the right-hand side of the plot. (B) PCA of the Himalayan populations alone. Each dot represents a sample, coded by country or region as indicated. Most samples lie on an arc between Bhutanese and Nepalese samples; Toto (India) are seen as extreme outlier in the bottom left corner, while Dhimal (Nepal) and Bodo (India) also form outliers. (C) ADMIXTURE (K values of 2–6, as indicated) analysis of the Himalayan samples. Note that most increases in the value of K result in single population being distinguished. Population codes in (C) are defined in supplementary table S1, Supplementary Material online.
<sc>Fig</sc>. 3.
Fig. 3.
Genetic structure of the Himalayan populations from haplotype analysis using fineSTRUCTURE, and comparison with language. (A) Populations are clustered according to haplotype sharing; the branching pattern represents this hierarchy, but the branch lengths have no meaning. Note the geographical clustering of populations, particularly the Bhutanese. (B) Language family annotation of the genetic clusters revealing correspondences between genetics and language. Population codes are defined in supplementary table S1, Supplementary Material online.
<sc>Fig</sc>. 4.
Fig. 4.
Admixture history of five Himalayan populations. The five populations, each named on the left, could be modelled as a mixture between different source populations from two regions. One of these is shown on the vertical axis, while the second is indicated by the colour of the horizontal bar; the position of this bar represents the inferred time of admixture, and the length in time of these admixture events, according to the scale on the horizontal axis. Thus, the Chetri, for example, can be modelled as a mixture of a large number of Asian and European pairs of populations, occurring ∼200–400 years ago.
<sc>Fig</sc>. 5.
Fig. 5.
Relative genetic similarity of the Himalayan region and other populations to four ancient DNA samples. (A–D) Each plot shows a comparison between two ancient samples, and equal similarity is represented by the gray line. Each dot represents a present-day population. Thus, section (A) shows that the Himalayan region populations are more similar to the Upper Palaeolithic Siberian hunter-gatherer than to the Neolithic European farmer.
<sc>Fig</sc>. 6.
Fig. 6.
Signals of positive selection (adaptation) in the Himalayan populations. (A, C, E, G) Manhattan plots showing a measure of confidence in selection (vertical axis) plotted against genomic coordinate (horizontal axis). Each dot represents a SNP. (A) Spearman’s correlation between derived allele frequency and altitude. (C) EMMAX. (E) Population Branch Statistics. (G) Fisher’s combined P value from these three tests. (B, D, F, H) Plots of allele frequency against altitude for four selection candidates. Each dot represents a Himalayan region population. Population codes are defined in supplementary table S1, Supplementary Material online.

References

    1. Ai H, Yang B, Li J, Xie X, Chen H, Ren J.. 2014. Population history and genomic signatures for high-altitude adaptation in Tibetan pigs. BMC Genomics 15:834.. - PMC - PubMed
    1. Aldenderfer M. 2011. Peopling the Tibetan plateau: insights from archaeology. High Alt Med Biol. 122:141–147. - PubMed
    1. Alexander DH, Novembre J, Lange K.. 2009. Fast model-based estimation of ancestry in unrelated individuals. Genome Res. 199:1655–1664. - PMC - PubMed
    1. Allentoft ME, Sikora M, Sjogren K-G, Rasmussen S, Rasmussen M, Stenderup J, Damgaard PB, Schroeder H, Ahlstrom T, Vinner L, et al. . 2015. Population genomics of Bronze Age Eurasia. Nature 5227555:167–172. - PubMed
    1. Ayub Q, Mezzavilla M, Pagani L, Haber M, Mohyuddin A, Khaliq S, Mehdi SQ, Tyler-Smith C.. 2015. The Kalash genetic isolate: ancient divergence, drift, and selection. Am J Hum Genet. 965:775–783. - PMC - PubMed

Publication types