FFAR4 Is Involved in Regulation of Neurotensin Release From Neuroendocrine Cells and Male C57BL/6 Mice
- PMID: 29796668
- PMCID: PMC6486825
- DOI: 10.1210/en.2018-00284
FFAR4 Is Involved in Regulation of Neurotensin Release From Neuroendocrine Cells and Male C57BL/6 Mice
Abstract
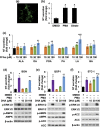
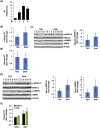
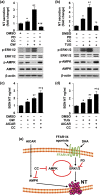
Neurotensin (NT), a 13 amino-acid peptide, is predominantly released from enteroendocrine cells of the small bowel in response to fat ingestion. Free fatty acid receptors (FFARs) FFAR1 and FFAR4 regulate secretion of gut hormones and insulin. Here, we show that docosahexaenoic acid, a long-chain fatty acid, has the most dramatic effect on NT release. FFAR1 agonists slightly stimulate and FFAR4 agonists dramatically stimulate and amplify NT secretion. Double knockdown of FFAR1 and FFAR4 decreases NT release, whereas overexpression of FFAR4, but not FFAR1, increases NT release. Administration of cpdA, an FFAR4 agonist, but not TAK-875, a selective FFAR1 agonist, increases plasma NT levels and further increases olive oil-stimulated plasma NT levels. Inhibition of MAPK kinase (MEK)/ERK1/2 decreased fatty acid-stimulated NT release but increased AMP-activated protein kinase (AMPK) phosphorylation. In contrast, inhibition of AMPK further increased NT secretion and ERK1/2 phosphorylation mediated by FFAR1 or FFAR4. Our results indicate that FFAR4 plays a more critical role than FFAR1 in mediation of fat-regulated NT release and in inhibitory crosstalk between MEK/ERK1/2 and AMPK in the control of NT release downstream of FFAR1 and FFAR4.
Figures


Similar articles
-
Kinase suppressor of Ras 1 and Exo70 promote fatty acid-stimulated neurotensin secretion through ERK1/2 signaling.PLoS One. 2019 Mar 27;14(3):e0211134. doi: 10.1371/journal.pone.0211134. eCollection 2019. PLoS One. 2019. PMID: 30917119 Free PMC article.
-
Activation of AMPK Stimulates Neurotensin Secretion in Neuroendocrine Cells.Mol Endocrinol. 2016 Jan;30(1):26-36. doi: 10.1210/me.2015-1094. Epub 2015 Nov 3. Mol Endocrinol. 2016. PMID: 26528831 Free PMC article.
-
Activation of extracellular signal-regulated protein kinases 1 and 2 (ERK1/2) by free fatty acid receptor 1 (FFAR1/GPR40) protects from palmitate-induced beta cell death, but plays no role in insulin secretion.Cell Physiol Biochem. 2015;35(4):1537-45. doi: 10.1159/000373969. Epub 2015 Mar 12. Cell Physiol Biochem. 2015. PMID: 25792236
-
For Better or Worse: FFAR1 and FFAR4 Signaling in Cancer and Diabetes.Mol Pharmacol. 2016 Dec;90(6):738-743. doi: 10.1124/mol.116.105932. Epub 2016 Aug 31. Mol Pharmacol. 2016. PMID: 27582526 Review.
-
[Free Fatty Acid Receptor Family: A New Therapeutic Target for Metabolic Diseases].Yakugaku Zasshi. 2015;135(6):769-77. doi: 10.1248/yakushi.14-00250-2. Yakugaku Zasshi. 2015. PMID: 26028412 Review. Japanese.
Cited by
-
Current perspectives of oleic acid: Regulation of molecular pathways in mitochondrial and endothelial functioning against insulin resistance and diabetes.Rev Endocr Metab Disord. 2020 Dec;21(4):631-643. doi: 10.1007/s11154-020-09549-6. Rev Endocr Metab Disord. 2020. PMID: 32125563 Review.
-
β-arrestin-biased Allosteric Modulator of Neurotensin Receptor 1 Reduces Ethanol Drinking and Responses to Ethanol Administration in Rodents.bioRxiv [Preprint]. 2024 Apr 13:2024.04.10.588903. doi: 10.1101/2024.04.10.588903. bioRxiv. 2024. PMID: 38645173 Free PMC article. Preprint.
-
Akkermansia muciniphila supplementation improves glucose tolerance in intestinal Ffar4 knockout mice during the daily light to dark transition.mSystems. 2023 Oct 26;8(5):e0057323. doi: 10.1128/msystems.00573-23. Epub 2023 Oct 3. mSystems. 2023. PMID: 37787527 Free PMC article.
-
New Insights in the Control of Fat Homeostasis: The Role of Neurotensin.Int J Mol Sci. 2022 Feb 17;23(4):2209. doi: 10.3390/ijms23042209. Int J Mol Sci. 2022. PMID: 35216326 Free PMC article. Review.
-
Kinase suppressor of Ras 1 and Exo70 promote fatty acid-stimulated neurotensin secretion through ERK1/2 signaling.PLoS One. 2019 Mar 27;14(3):e0211134. doi: 10.1371/journal.pone.0211134. eCollection 2019. PLoS One. 2019. PMID: 30917119 Free PMC article.
References
-
- Carraway R, Leeman SE. The isolation of a new hypotensive peptide, neurotensin, from bovine hypothalami. J Biol Chem. 1973;248(19):6854–6861. - PubMed
-
- Barber DL, Cacace AM, Raucci DT, Ganz MB. Fatty acids stereospecifically stimulate neurotensin release and increase [Ca2+]i in enteric endocrine cells. Am J Physiol. 1991;261(3 Pt 1):G497–G503. - PubMed
-
- Ferris CF, Carraway RE, Hammer RA, Leeman SE. Release and degradation of neurotensin during perfusion of rat small intestine with lipid. Regul Pept. 1985;12(2):101–111. - PubMed
-
- Polak JM, Sullivan SN, Bloom SR, Buchan AM, Facer P, Brown MR, Pearse AG. Specific localisation of neurotensin to the N cell in human intestine by radioimmunoassay and immunocytochemistry. Nature. 1977;270(5633):183–184. - PubMed
-
- Rosell S, Rökaeus A. The effect of ingestion of amino acids, glucose and fat on circulating neurotensin-like immunoreactivity (NTLI) in man. Acta Physiol Scand. 1979;107(3):263–267. - PubMed
Publication types
MeSH terms
Substances
Grants and funding
LinkOut - more resources
Full Text Sources
Other Literature Sources
Molecular Biology Databases
Research Materials
Miscellaneous

