. 2018 Aug;12(8):1264-1285.
doi: 10.1002/1878-0261.12323. Epub 2018 Jun 22.

A combined tissue-engineered/in silico signature tool patient stratification in lung cancer

Affiliations

A combined tissue-engineered/in silico signature tool patient stratification in lung cancer

Claudia Göttlich et al. Mol Oncol. 2018 Aug.

Abstract

Patient-tailored therapy based on tumor drivers is promising for lung cancer treatment. For this, we combined in vitro tissue models with in silico analyses. Using individual cell lines with specific mutations, we demonstrate a generic and rapid stratification pipeline for targeted tumor therapy. We improve in vitro models of tissue conditions by a biological matrix-based three-dimensional (3D) tissue culture that allows in vitro drug testing: It correctly shows a strong drug response upon gefitinib (Gef) treatment in a cell line harboring an EGFR-activating mutation (HCC827), but no clear drug response upon treatment with the HSP90 inhibitor 17AAG in two cell lines with KRAS mutations (H441, A549). In contrast, 2D testing implies wrongly KRAS as a biomarker for HSP90 inhibitor treatment, although this fails in clinical studies. Signaling analysis by phospho-arrays showed similar effects of EGFR inhibition by Gef in HCC827 cells, under both 2D and 3D conditions. Western blot analysis confirmed that for 3D conditions, HSP90 inhibitor treatment implies different p53 regulation and decreased MET inhibition in HCC827 and H441 cells. Using in vitro data (western, phospho-kinase array, proliferation, and apoptosis), we generated cell line-specific in silico topologies and condition-specific (2D, 3D) simulations of signaling correctly mirroring in vitro treatment responses. Networks predict drug targets considering key interactions and individual cell line mutations using the Human Protein Reference Database and the COSMIC database. A signature of potential biomarkers and matching drugs improve stratification and treatment in KRAS-mutated tumors. In silico screening and dynamic simulation of drug actions resulted in individual therapeutic suggestions, that is, targeting HIF1A in H441 and LKB1 in A549 cells. In conclusion, our in vitro tumor tissue model combined with an in silico tool improves drug effect prediction and patient stratification. Our tool is used in our comprehensive cancer center and is made now publicly available for targeted therapy decisions.

Keywords: 3D lung tumor model; Boolean signaling network; HSP90 inhibitor; KRAS mutation signature; chemoresistance; in silico drug screening tool.


Figures

Figure 1
Figure 1
Improved reflection of tumor characteristics by the 3D tissue‐engineered lung tumor model. Tested tumor cell line populations display more homogeneous marker expression in 3D as well as reduced proliferation correlating to tumors. (A) Cells cultured in 2D and 3D conditions shown with immunofluorescence by double stain for E‐cadherin and β‐catenin. Green arrows indicate positive cells and white arrows negative. Scale bars are 50 μm. (B) Paraffin‐embedded adenocarcinoma from patient biopsy was immunofluorescence‐double‐stained against E‐cadherin and β‐catenin. Scale bar is 100 μm. (C) The expression of the proliferation marker Ki67 was detected by immunofluorescence staining of 2D and 3D cultured HCC827 cells, as well as in vivo tissue from a patient biopsy. Scale bar is 100 μm.
Figure 2
Figure 2
Biomarker‐dependent response upon EGFR inhibition is improved in 3D and can also be simulated in silico. (A) Cells cultured in 3D that were either treated with 1 μm Gef or used as untreated controls were paraffin‐embedded and HE‐stained. Scale bar is 100 μm. (B) The proliferation rate (proliferative cells per total cell number) was determined by counting Ki67‐positive cells from immunofluorescence staining in 10 images per sample. Total cell number was quantified by DAPI counterstaining. ***P < 0.001, n ≥ 4. (C) Apoptosis was investigated by M30 CytoDeath™ ELISA. Therefore, supernatants of treated and untreated samples were collected prior to and at 24, 48, and 72 h after treatment. Concentrations of M30 in samples after treatment were normalized to T0 values from samples taken before treatment and related to untreated samples (red line). ***P < 0.001, n ≥ 4. (D) In silico simulation of the Gef treatment (right, pink curve full on at 1.0) shows reduced proliferation (right, black curve) only in HCC827 cells and higher apoptosis (right, gray curve), as compared to untreated cells (left, pink curve switched off at 0.0). Figure S2A shows the in silico topology and Fig. S2B the simulations for A549 and H441. *P < 0.05, **P < 0.01
Figure 3
Figure 3
Effects of the HSP90 inhibitor 17AAG diminish in 3D and cannot be aligned to the biomarker KRAS (A549/H441). Strong treatment responses regarding viability, proliferation, and apoptosis can be observed only in 2D conditions. (A) Cells cultured in 2D conditions were treated with different concentrations of the HSP90 inhibitor 17AAG. Viability was determined after 3 days of treatment by a CellTiter‐Glo® Luminescent Cell Viability Assay. n ≥ 4. (B) 3D cultured cells were treated with 0.25 μm 17AAG, paraffin‐embedded, and HE‐stained. Scale bar is 100 μm. (C) The proliferation rate in 2D and 3D was determined by counting Ki67‐positive cells from immunofluorescence staining in 10 images per sample. Total cell number was quantified by DAPI counterstaining. *P < 0.05, n ≥ 4. (D) Apoptosis was investigated by M30 CytoDeath™ ELISA. Therefore, supernatants of treated and untreated samples were collected prior to and at 24, 48, and 72 h after treatment. Concentrations of M30 in samples after treatment were normalized to T0 values from samples taken before treatment and related to untreated samples (red line). *P < 0.05, ***P < 0.001, n ≥ 4. **P < 0.01.
Figure 4
Figure 4
Signaling changes after HSP90 inhibition differ between 2D and 3D and between the different cell lines and are integrated into in silico topologies. (A) Cells cultured in 2D and 3D were treated with 0.25 μm 17AAG for 24 h (2D) or 72 h (3D). The signaling changes of different phospho‐proteins were analyzed by western blot. The same lysates were used for the pEGFR and ph‐p53(S46) blots of all three cell lines in 2D and 3D HCC827 and for ph‐p53(S46) and pMET blots in 3D H441; thus, the same β‐actin loading control is shown below these phospho‐proteins. (B) DRPs from the in vitro 3D system are connected in silico to the central tumor signaling cascade. Here, we show the topology shared between all three cell lines. Colors reflect important input (treatment), signaling proteins, and cellular output (proliferation and apoptosis). Proteins (‘nodes’) from the topology of Stratmann et al. (2014) are bold rimmed and have an olive background; proteins added specifically to the in silico topology are presented as simple boxes; protein node colors are as in the simulation curves; cell line‐specific proteins (‘nodes’) appear as plus (+). Specific topologies and simulation results for each cell line are given in the Supporting information.
Figure 5
Figure 5
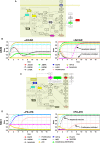
Cell line‐specific in silico simulations for 17AAG treatment according to data from the 3D system. Simulations of the 17AAG treatment reflect the in vitro data. Coloring of the curves is according to the network node colors shared for all three cell lines shown in Fig. 4B. Cell line‐specific pathway differences included are given in Table 2. Top: Simulation of the 17AAG treatment in HCC827 cells (right, red curve at full activation) results in slightly induced apoptosis (gray curve at 0.2) and unchanged proliferation (black curve), as compared to untreated cells (left, red curve at 0.0, no treatment). Middle: The in silico simulation of the 17AAG treatment for A549 shows only low apoptosis induction (0.2); we see no therapeutic effect on proliferation (black curve, dots) compared to untreated cells. However, HSP60 (black curve, squares) is induced after 17AAG treatment, similar to the in vitro data. Bottom: In H441 cells, apoptosis is not elevated over time and no effect on proliferation can be obtained. p53 (pink curve) is induced after 17AAG treatment and correlates with the in vitro data.
Figure 6
Figure 6
KRAS signature development and individual target predictions by generation of HPRD networks. We generated a network around KRAS, according to the experimentally validated DRPs between both KRAS‐mutated cell lines (H441, A549) in the 3D system (Table 1B; 17AAG treatment), and included their direct protein interaction partners using the genomewide HPRD. The resulting larger KRAS interaction network includes 556 proteins (= nodes) and 680 protein–protein interactions (= edges), around nine strongly DRPs (EGFR, ErbB2, ErbB3, MET, FGFR3, c‐Ret, VEGFR2, p53, and HSP60). (A) A Venn diagram compares cell line‐specific mutations. Mapping of cell line‐specific protein mutations (573 for H441 (blue) and 361 for A549 (yellow) from the COSMIC database) against the 556 proteins from the network around KRAS results in 18 H441‐specific mutations and in nine A549‐specific mutations which were included in each cell line‐specific in silico topology to yield the network. Details are given in the Supporting information, and key network differences are shown in B and C. (B) A549‐specific network: represents neighbor proteins that we could target if we consider the experimental data and directly interacting protein neighbors (from HPRD; functional clusters in Fig. S5A). As drug targets do not appear for these small modules from key signaling proteins, we considered experimental derived proteins (red) with all first‐degree neighbors, HSP90 (orange rectangle), and additionally direct neighbors to cell line‐specific mutations (in yellow, suspected ‘driver mutations’). Direct neighbor proteins are labeled in lavender, in cyan are neighbors from neighbors, which are also mutated. The black square (AMPK, interactor of p53 and LKB1) indicates a promising drug target (screening procedure given in Box S1). (C) H441‐specific network: shows neighbor proteins that we could target, if we consider the experimental data, HSP90 (orange rectangle) and directly interacting protein neighbors from HPRD (functional clusters in Fig. S5B). Directly interacting neighbors are shown (lavender, labeling binary interactions). As drug targets do not appear for these small modules from key signaling proteins, we considered all experimental determined nodes (red) with all first‐degree neighbors integrating cell line‐specific H441 mutations (in blue, suspected ‘driver mutations’; EGFR and p53 labeled in red with blue circles as they are array nodes and mutated). Protein interactors according to HPRD are labeled in lavender; in cyan are neighbors from driver mutations, also showing a mutation in H441. The square (HIF1A) indicates a promising drug target (screening procedure given in Box S1).
Figure 7
Figure 7
In silico topologies and simulations of AMPK and HIF1A treatment. Cell‐specific network extensions according to the experimental data (Table 2) are mapped into the shared topology (bold nodes from basic topology from Stratmann et al. (2014), olive shade for topology nodes from Fig. 4B). Furthermore, AMPK as a relevant target for A549 (network in (A)) and HIF1A as a target for H441 (topology in (C)) are included (nodes equivalent to the 17AAG treatment are deposited in olive, protein node colors are the same as in the simulation curves). Both protein targets were integrated with their direct interacting protein neighbors in the cell‐specific networks to mirror in silico individual therapy. In (B) and (D), the cell‐specific topologies are next simulated dynamically, and selected trajectories of protein node activities were plotted, showing the effects of the potential drug candidate AICAR as an AMPK activator for A549 (B), and the HIF1A inhibitor PX‐478 for H441 in (D) to illustrate the in silico screen of different drugs in the two cell line‐specific topologies. (B) Simulation of AMPK activation in A549 cells (right, red curve at stage 1) results in higher apoptosis (pink curve) and reduced proliferation (salmon curve), as compared to untreated cells (left, red curve at 0.0, no activation). (D) The in silico simulation of the HIF1A inhibition for H441 (right, olive curve at full activation) shows higher apoptosis (black curve) and reduced proliferation (salmon curve), as compared to untreated cells (left, olive curve at 0.0, no activation).

References

    1. Acquaviva J, Smith DL, Sang J, Friedland JC, He S, Sequeira M, Zhang C, Wada Y and Proia DA (2012) Targeting KRAS‐mutant non‐small cell lung cancer with the Hsp90 inhibitor ganetespib. Mol Cancer Ther 11, 2633–2643. - PubMed
    1. Alemany‐Ribes M and Semino CE (2014) Bioengineering 3D environments for cancer models. Adv Drug Deliv Rev 79–80, 40–49. - PubMed
    1. Audretsch C, Lopez D, Srivastava M, Wolz C and Dandekar T (2013) A semi‐quantitative model of Quorum‐Sensing in Staphylococcus aureus, approved by microarray meta‐analyses and tested by mutation studies. Mol BioSyst 9, 2665–2680. - PubMed
    1. Bader GD and Hogue CW (2003) An automated method for finding molecular complexes in large protein interaction networks. BMC Bioinformatics 4, 2. - PMC - PubMed
    1. Bhattacharjee Y (2012) Biomedicine. Pharma firms push for sharing of cancer trial data. Science 338, 29. - PubMed

Publication types