

Tumor-derived exosomes induce PD1+ macrophage population in human gastric cancer that promotes disease progression
- PMID: 29799520
- PMCID: PMC5968036
- DOI: 10.1038/s41389-018-0049-3
Tumor-derived exosomes induce PD1+ macrophage population in human gastric cancer that promotes disease progression
Erratum in
-
Correction: Tumor-derived exosomes induce PD1+ macrophage population in human gastric cancer that promotes disease progression.Oncogenesis. 2022 Feb 8;11(1):7. doi: 10.1038/s41389-022-00381-y. Oncogenesis. 2022. PMID: 35136026 Free PMC article. No abstract available.
Abstract
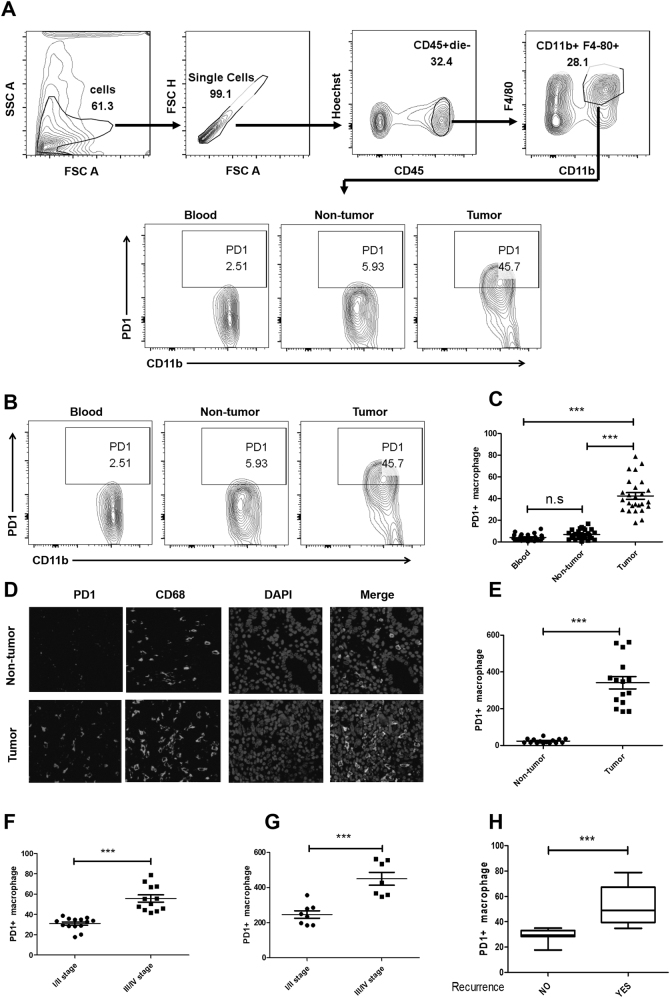
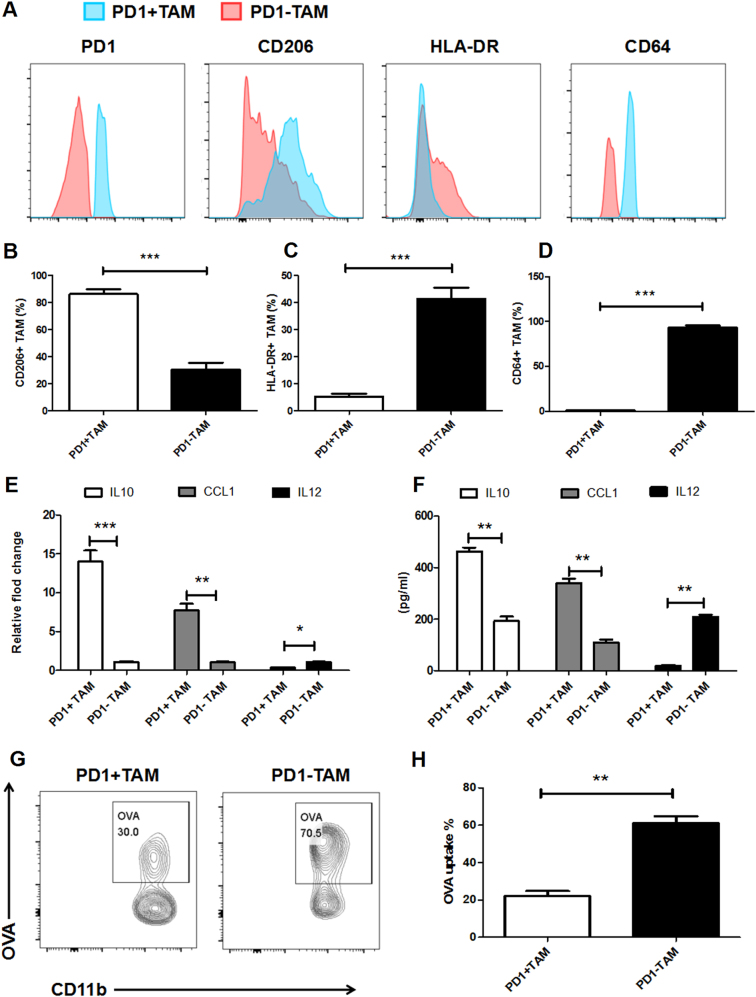
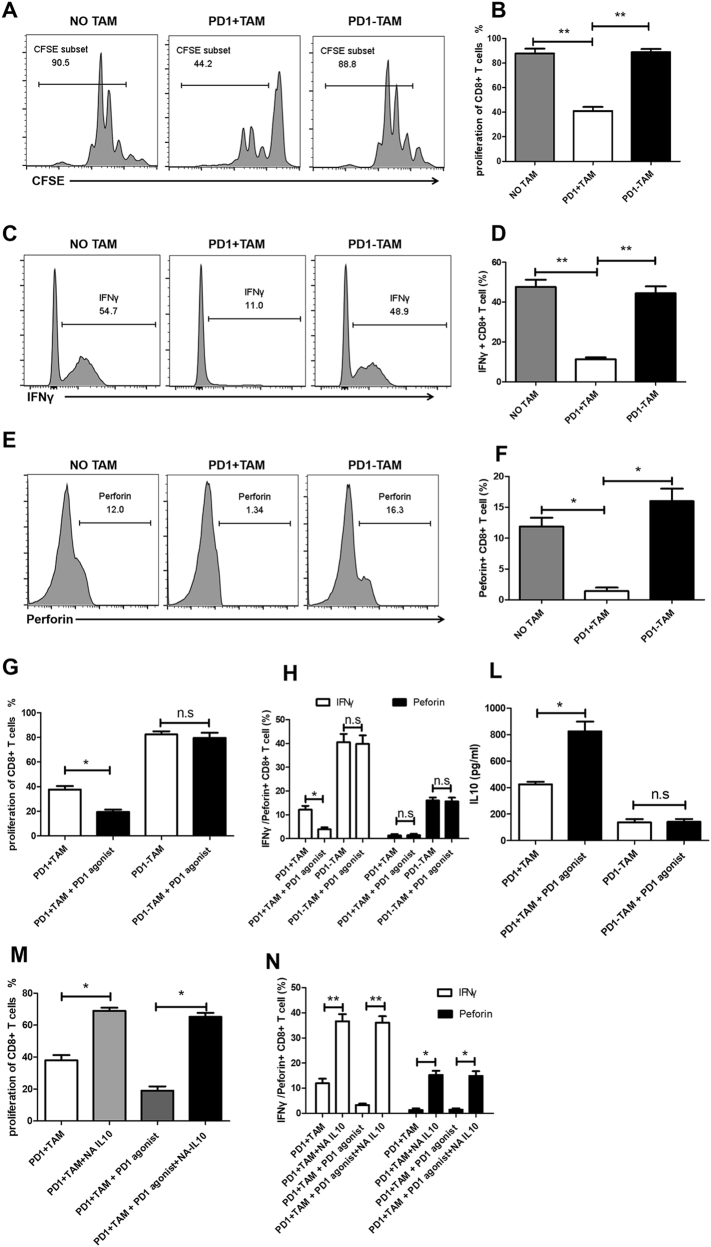
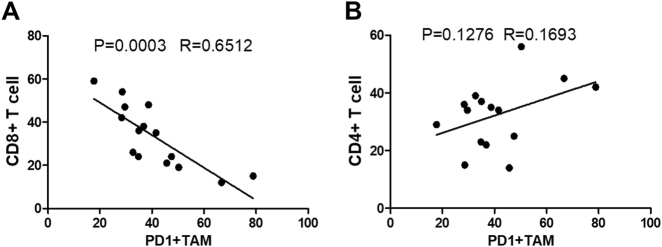
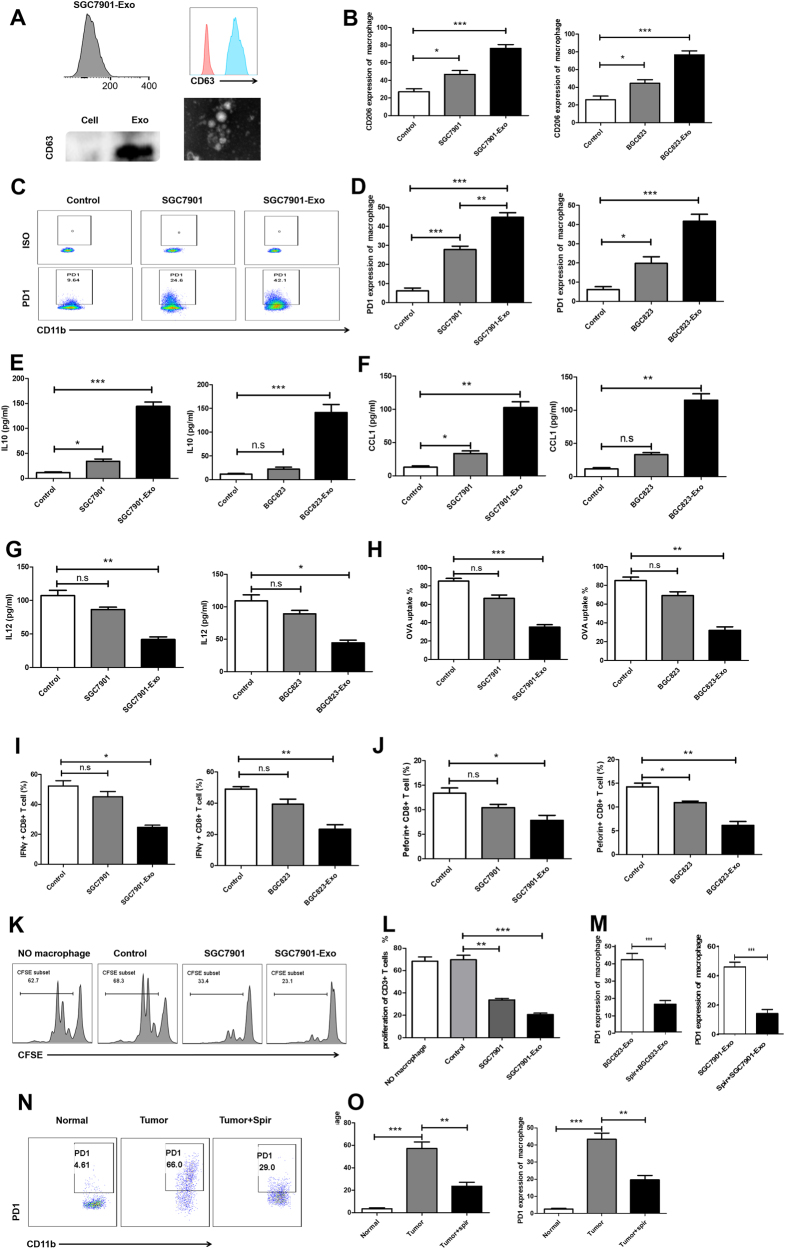
Macrophages constitute a major component of tumor-infiltrating immune cells. M2 macrophages have been reported to promote tumor progression through promoting tumor angiogenesis and metastasis and regulating T-cell function. Here, we identified a protumorigenic subset of macrophages that constitutively expressed programmed cell death 1 (PD1) and accumulated in advanced-stage gastric cancer (GC). These PD1+ tumor-associated macrophages (TAMs) exhibited an M2-like surface profile, with a significant increase in the expression of CD206, IL-10, and CCL1, and a clear decrease in the expression of MHC class II, CD64, and IL-12 and the ability to phagocytose ovalbumin. Moreover, PD1+ TAMs can suppress CD8+ T-cell function and this immunosuppressive activity can effectively be enhanced upon triggering PD1 signal. GC-derived exosomes effectively educated monocytes to differentiate into PD1+ TAMs with M2 phenotypic and functional characteristics. Together, our results are the first to show that GC-derived exosomes can effectively induce PD1+ TAM generation, and these cells can produce a large number of IL-10, impair CD8+ T-cell function, and thereby create conditions that promote GC progression. Thus, methods in which immunotherapy is combined with targeting PD1+ TAMs and tumor-derived exosomes should be used to restore immune function in GC patients.
Conflict of interest statement
The authors declare that they have no conflict of interest.
Figures
Similar articles
-
Tumor-derived exosomal HMGB1 promotes esophageal squamous cell carcinoma progression through inducing PD1+ TAM expansion.Oncogenesis. 2019 Feb 22;8(3):17. doi: 10.1038/s41389-019-0126-2. Oncogenesis. 2019. PMID: 30796203 Free PMC article.
-
Significance of Immunosuppressive Cells as a Target for Immunotherapies in Melanoma and Non-Melanoma Skin Cancers.Biomolecules. 2020 Jul 22;10(8):1087. doi: 10.3390/biom10081087. Biomolecules. 2020. PMID: 32707850 Free PMC article. Review.
-
Tumor-associated macrophages-derived exosomes promote the migration of gastric cancer cells by transfer of functional Apolipoprotein E.Cell Death Dis. 2018 Apr 1;9(4):434. doi: 10.1038/s41419-018-0465-5. Cell Death Dis. 2018. PMID: 29567987 Free PMC article.
-
Expression of PD1/PDL1 in gastric cancer at different microsatellite status and its correlation with infiltrating immune cells in the tumor microenvironment.J Cancer. 2021 Jan 18;12(6):1698-1707. doi: 10.7150/jca.40500. eCollection 2021. J Cancer. 2021. PMID: 33613757 Free PMC article.
-
Exosome-mediated communication between gastric cancer cells and macrophages: implications for tumor microenvironment.Front Immunol. 2024 Feb 22;15:1327281. doi: 10.3389/fimmu.2024.1327281. eCollection 2024. Front Immunol. 2024. PMID: 38455041 Free PMC article. Review.
Cited by
-
Myeloid Cell Modulation by Tumor-Derived Extracellular Vesicles.Int J Mol Sci. 2020 Aug 31;21(17):6319. doi: 10.3390/ijms21176319. Int J Mol Sci. 2020. PMID: 32878277 Free PMC article. Review.
-
Exosomes in gastric cancer: roles, mechanisms, and applications.Mol Cancer. 2019 Mar 15;18(1):41. doi: 10.1186/s12943-019-1001-7. Mol Cancer. 2019. PMID: 30876419 Free PMC article. Review.
-
The Potential Use of Exosomes in Anti-Cancer Effect Induced by Polarized Macrophages.Pharmaceutics. 2023 Mar 22;15(3):1024. doi: 10.3390/pharmaceutics15031024. Pharmaceutics. 2023. PMID: 36986884 Free PMC article. Review.
-
Tumor-Derived Exosomes in Tumor-Induced Immune Suppression.Int J Mol Sci. 2022 Jan 27;23(3):1461. doi: 10.3390/ijms23031461. Int J Mol Sci. 2022. PMID: 35163380 Free PMC article. Review.
-
M1 macrophage-derived exosomes and their key molecule lncRNA HOTTIP suppress head and neck squamous cell carcinoma progression by upregulating the TLR5/NF-κB pathway.Cell Death Dis. 2022 Feb 24;13(2):183. doi: 10.1038/s41419-022-04640-z. Cell Death Dis. 2022. PMID: 35210436 Free PMC article.
References
LinkOut - more resources
Full Text Sources
Other Literature Sources
Research Materials
Miscellaneous
