

Pharmacokinetic Study of Rucaparib in Patients With Advanced Solid Tumors
- PMID: 29799676
- PMCID: PMC6585632
- DOI: 10.1002/cpdd.575
Pharmacokinetic Study of Rucaparib in Patients With Advanced Solid Tumors
Abstract
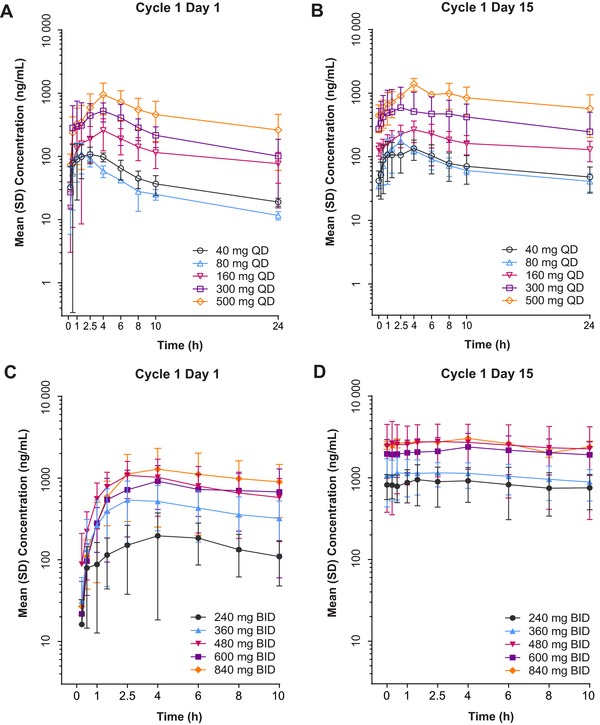
The phase 1-2 study CO-338-010 (Study 10; NCT01482715) is evaluating single-agent rucaparib, a poly(ADP-ribose) polymerase inhibitor, administered orally to patients with an advanced solid tumor. In the dose escalation phase (Part 1), we characterized the single-dose and steady-state pharmacokinetic profiles of rucaparib administered once daily (QD; dose range, 40-500 mg; n = 16) or twice daily (BID; dose range, 240-840 mg; n = 30). Across all dosing schedules examined, the plasma exposure of rucaparib was approximately dose proportional; half-life was approximately 17 hours, and median time to maximum concentration (tmax ) ranged from 1.5 to 6.0 hours after a single dose and 1.5 to 4.0 hours following repeated dosing. The steady-state accumulation ratio ranged from 1.60 to 2.33 following QD dosing and 1.47 to 5.44 following BID dosing. No effect of food on rucaparib pharmacokinetics was observed with a single dose of 40 mg (n = 3) or 300 mg (n = 6). In a phase 2 portion of the study (Part 3), the pharmacokinetic profile of rucaparib was further evaluated at the recommended phase 2 dose of 600 mg BID (n = 26). The mean (coefficient of variation) steady-state maximum concentration (Cmax ) and area under the concentration-time curve from time zero to 12 hours (AUC0-12h ) were 1940 ng/mL (54%) and 16 900 ng ⋅ h/mL (54%), respectively. A high-fat meal moderately increased rucaparib exposure. The fed-to-fasted geometric mean ratios (90% confidence interval [CI]) for AUC0-24h and Cmax were 138% (117%-162%) and 120% (99.1%-146%); the median (90%CI) tmax delay was 2.5 (0.5-4.4) hours.
Keywords: PARP inhibition; food effect; pharmacokinetics; rucaparib; tablet.
© 2018 The Authors. Clinical Pharmacology in Drug Development Published by Wiley Periodicals, Inc. on behalf of The American College of Clinical Pharmacology.
Figures


References
-
- Schreiber V, Dantzer F, Ame JC, de Murcia G. Poly(ADP‐ribose): novel functions for an old molecule. Nat Rev Mol Cell Biol. 2006;7(7):517–528. - PubMed
-
- Helleday T, Lo J, van Gent DC, Engelward BP. DNA double‐strand break repair: from mechanistic understanding to cancer treatment. DNA Repair. 2007;6(7):923–935. - PubMed
-
- Helleday T, Petermann E, Lundin C, Hodgson B, Sharma RA. DNA repair pathways as targets for cancer therapy. Nat Rev Cancer. 2008;8(3):193–204. - PubMed
-
- Moynahan ME, Chiu JW, Koller BH, Jasin M. BRCA1 controls homology‐directed DNA repair. Mol Cell. 1999;4(4):511–518. - PubMed
Publication types
MeSH terms
Substances
Associated data
Grants and funding
LinkOut - more resources
Full Text Sources
Other Literature Sources
Medical
