. 2018 May 25;16(5):e2005754.
doi: 10.1371/journal.pbio.2005754. eCollection 2018 May.

A G-protein-coupled chemoattractant receptor recognizes lipopolysaccharide for bacterial phagocytosis

Affiliations

A G-protein-coupled chemoattractant receptor recognizes lipopolysaccharide for bacterial phagocytosis

Miao Pan et al. PLoS Biol. .

Abstract

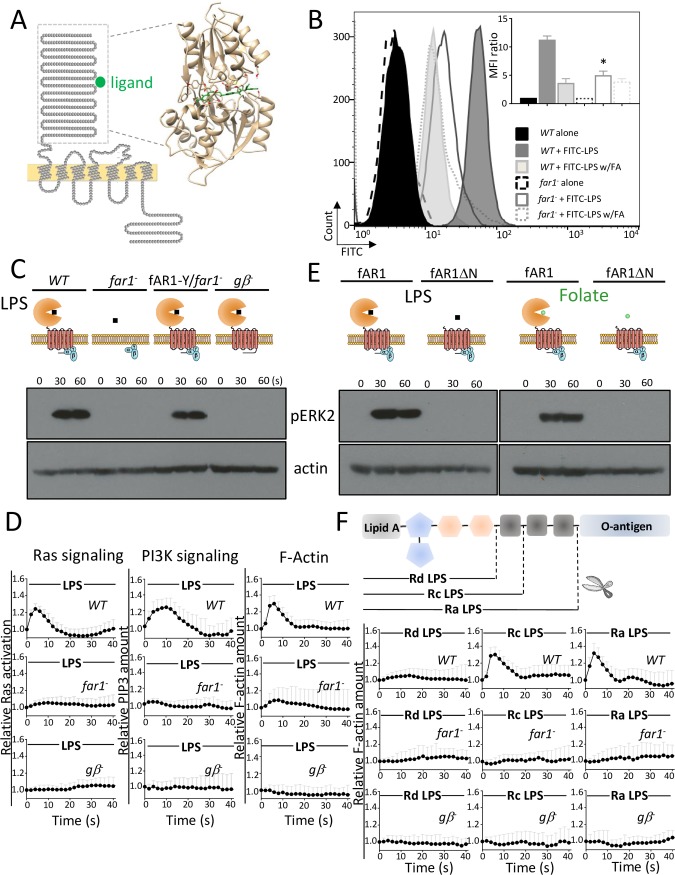
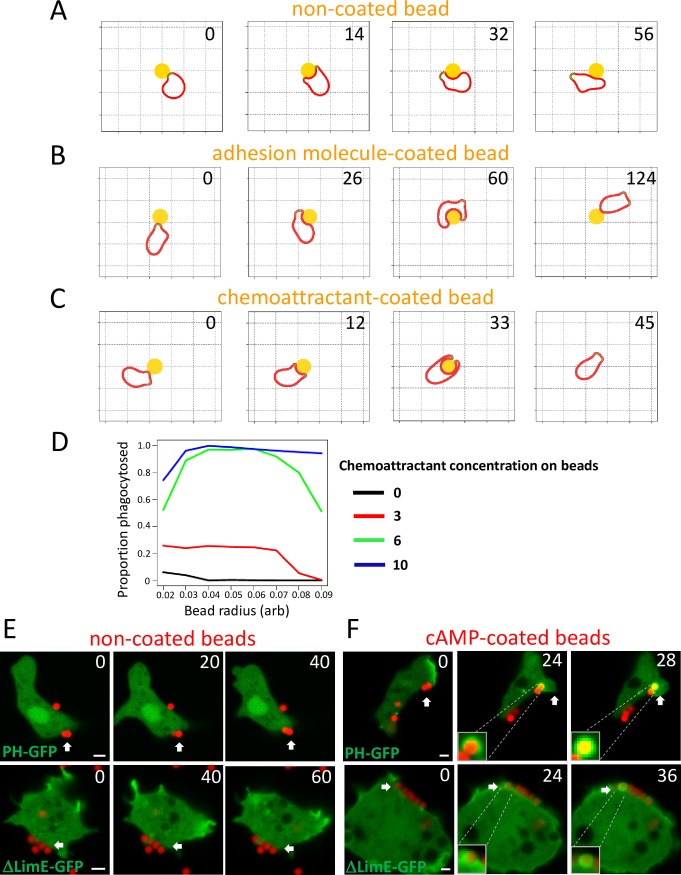
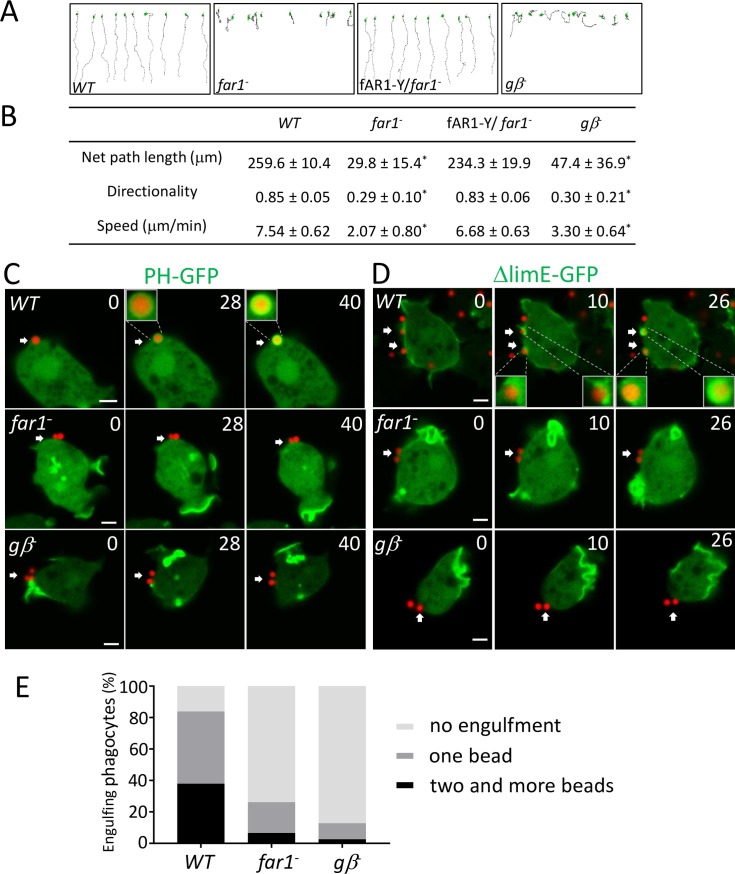
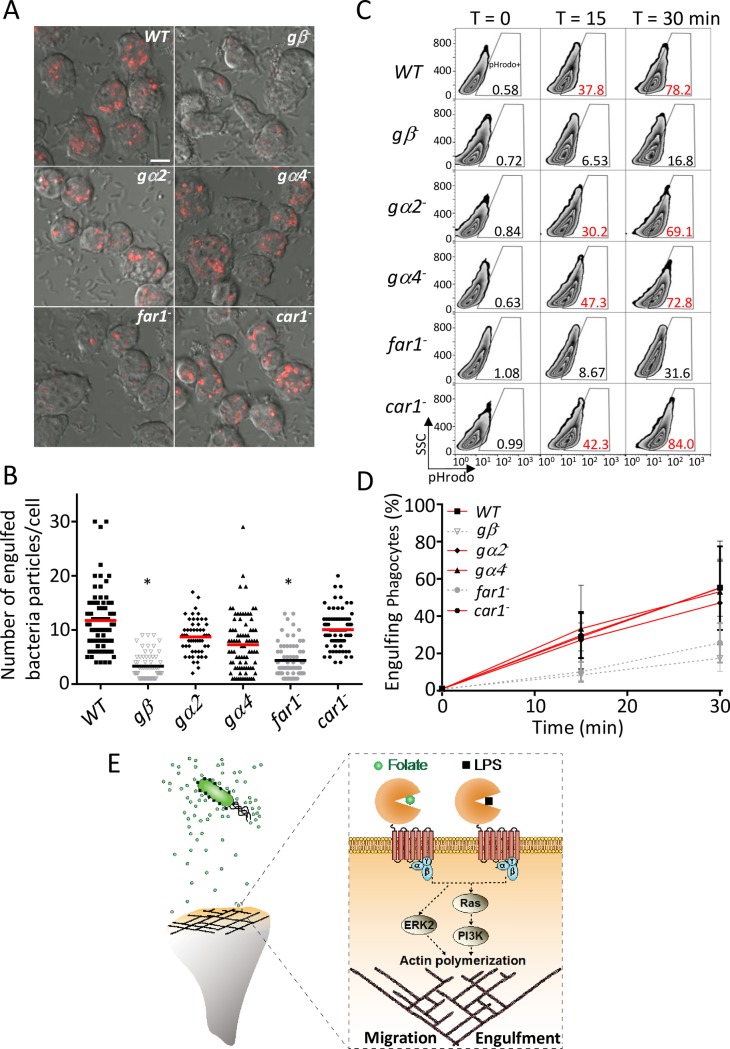
Phagocytes locate microorganisms via chemotaxis and then consume them using phagocytosis. Dictyostelium amoebas are stereotypical phagocytes that prey on diverse bacteria using both processes. However, as typical phagocytic receptors, such as complement receptors or Fcγ receptors, have not been found in Dictyostelium, it remains mysterious how these cells recognize bacteria. Here, we show that a single G-protein-coupled receptor (GPCR), folic acid receptor 1 (fAR1), simultaneously recognizes the chemoattractant folate and the phagocytic cue lipopolysaccharide (LPS), a major component of bacterial surfaces. Cells lacking fAR1 or its cognate G-proteins are defective in chemotaxis toward folate and phagocytosis of Klebsiella aerogenes. Computational simulations combined with experiments show that responses associated with chemotaxis can also promote engulfment of particles coated with chemoattractants. Finally, the extracellular Venus-Flytrap (VFT) domain of fAR1 acts as the binding site for both folate and LPS. Thus, fAR1 represents a new member of the pattern recognition receptors (PRRs) and mediates signaling from both bacterial surfaces and diffusible chemoattractants to reorganize actin for chemotaxis and phagocytosis.


Conflict of interest statement

The authors have declared that no competing interests exist.

Figures

Fig 1
Fig 1. LPS triggered chemotactic signaling through fAR1.
(A) fAR1 possesses a VFT domain for ligand binding. The sequence and topology of fAR1 is shown on the left. The extracellular domain of fAR1 was highlighted by a dashed box. On the right, structural modeling and computational docking predict that the extracellular domain of fAR1 folds into a VFT structure functioning as the binding site for FA moiety (green). (B) far1 has decreased LPS-binding ability. The LPS binding was determined in flow cytometry by measuring the fluorescent intensity of cells binding to FITC-LPS on the surface. The representative data is shown. The MFI ratio with SD from 3 independent repetitions, which reflects the LPS binding of WT and far1 cells in the presence or absence of FA, were graphed. A Student t test indicated a statistically significant difference in LPS binding between far1 and WT cells (* indicates P < 0.01). (C) ERK2 signaling triggered by LPS is impaired in far1 and cells. ERK2 activation in vegetative WT, far1, , and fAR1-Y/far1 cells in response to 100 μg/ml LPS stimulation was examined. ERK2 activation was determined by immunoblotting with anti–phospho-ERK2 antibody, using actin as a loading control. (D) LPS-induced Ras activation, PIP3 signaling, and actin polymerization are mainly dependent on fAR1 and Gβ. Vegetative WT and mutant cells expressing RBD-GFP, PHCRAC-GFP, and LimEΔcoil-GFP were stimulated with 100 μg/ml LPS at 0 s. The transient increase in fluorescence intensity was measured at the plasma membrane and graphed. The intensity of the GFP signal was normalized to the first frame of each set of cells. Mean and SD from 10 cells are shown for the time course. A Student t test indicated a statistically significant difference in fluorescence intensity peak value between far1, , and WT cells (P < 0.01). (E) VFT domain of fAR1 is essential for ERK2 activation by LPS and FA. ERK2 activation in vegetative fAR1-Y/far1 and fAR1ΔN-Y/far1 cells in response to 100 μg/ml LPS or 100 μM FA stimulation was examined by immunoblotting with anti–phospho-ERK2 antibody, using actin as a loading control. (F) fAR1 recognizes saccharide region in LPS to transduce signal. Schematic structure of bacterial LPS molecule, which contains lipid A, core region, and O-antigen. Mutant LPS molecules are composed of same lipid A but different saccharides in core region. Vegetative WT, far1, and cells expressing LimEΔcoil-GFP were stimulated with 100 μg/ml different LPS at 0 s. The transient increase in fluorescence intensity was measured at the plasma membrane and graphed. The intensity of the GFP signal was normalized to the first frame of each set of cells. Mean and SD from 10 cells are shown for the time course. A Student t test indicated a statistically significant difference in fluorescence intensity peak value between far1, , and WT cells triggered by Ra- and Rc-LPS (P < 0.01). There is no significant difference in fluorescence intensity peak value between mutants and WT cells triggered by Rd-LPS under the test condition. Underlying data can be found in S1 Data. ERK2, extracellular signal-regulated kinase 2; FITC, fluorescein isothiocyanate; FA, folic acid; fAR1, folic acid receptor 1; GFP, green fluorescent protein; LimEΔcoil, partial sequences of LimE protein; LPS, lipopolysaccharide; MFI, mean fluorescence intensity; PHCRAC, PH domain of cytosolic regulator of adenylyl cyclase; PIP3, phosphatidylinositol (3,4,5)-trisphosphate; RBD, Ras binding domain; VFT, Venus-Flytrap; WT, wild-type.
Fig 2
Fig 2. A chemoattractant-sensing machinery promotes the engulfment of particles.
(A) Simulated cell migration in the presence of a circular obstacle without any coating. The cell fails to engulf the obstacle. (B) Simulation of cell migration in the presence of circular obstacle coated with adhesive molecules, which increases interaction between cell and obstacle but fails to promote engulfment. (C) Simulated cell migration in the presence of a circular obstacle coated with chemoattractant on surface, which promotes engulfment. (D) Engulfment efficiency is dependent on the concentration of chemoattractant on the surface of the obstacle. (E) Developed D. discoideum WT cells expressing PHCRAC-GFP and and LimEΔcoil-GFP were incubated with NeutrAvidin beads. The beads failed to trigger signaling events and engulfment. Scale bar: 2 μm. F. cAMP coated on the beads triggers PIP3 signaling and actin polymerization for engulfment in developed D. discoideum cells. Phagocytosis of 1 μm cAMP-coated beads (red) by developed WT expressing PHCRAC-GFP, LimEΔcoil-GFP (green). Scale bar, 2 μm. Underlying data can be found in S1 Data. PHCRAC, PH domain of cytosolic regulator of adenylyl cyclase; LimEΔcoil, partial sequences of LimE protein; PIP3, phosphatidylinositol (3,4,5)-trisphosphate; WT, wild-type
Fig 3
Fig 3. fAR1/G protein machinery mediates LPS-induced cell migration and particle engulfment.
(A) EZ-TAXIScan chemotaxis toward a linear LPS gradient of vegetative WT, , far1, and fAR1-Y/far1 cells. Migration paths toward LPS are shown. (B) Ten cells of each strain from (A) were used for tracing. The mean and SD resulting from quantification of chemotaxis parameters are shown. A Student t test indicated a statistically significant difference between , far1, and WT cells (* indicates P < 0.01). (C) LPS on particle surface triggers localized PIP3 signaling and engulfment. Engulfment of 1 μm LPS-coated beads (red) by WT but not far1 or cells expressing PHCRAC-GFP (green). Scale bar: 2 μm. (D) LPS on particle surface triggers localized actin polymerization to form phagocytic cup. Engulfment of 1 μm LPS-coated beads (red) by WT but not far1 or cells expressing LimEΔcoil-GFP (green). Scale bar: 2 μm. (E) LPS triggers engulfment through fAR1 and Gβ. Quantitation of engulfment movies from C and D to compare engulfment ability between WT, far1, and cells. A Student t test indicated a statistically significant difference in percentage of cell-engulfing LPS-beads between far1, , and WT cells (P < 0.01). Underlying data can be found in S1 Data. fAR1, folic acid receptor 1; LimEΔcoil, partial sequences of LimE protein; LPS, lipopolysaccharide; PHCRAC, PH domain of cytosolic regulator of adenylyl cyclase; PIP3, phosphatidylinositol (3,4,5)-trisphosphate; WT, wild-type; LimEΔcoil, partial sequences of LimE protein
Fig 4
Fig 4. fAR1/G protein machinery mediates live K. aerogenes engulfment.
(A) WT and mutants were mixed with pHrodo-labeled K. aerogenes at a 1:50 ratio. After 20 min, cells were mounted on a slide in basic pH buffer and analyzed by confocal microscopy. The representative data are shown. The engulfed pHrodo-labeled K. aerogenes are shown as red; Scale bars, 5 μm. (B) The engulfed bacterial number in each cell from (A) was measured and plotted for WT and mutant cells. A Student t test indicated a statistically significant difference in number of engulfed bacteria per cell between far1, , and WT cells (* indicates P < 0.01). (C) WT and mutant cells were mixed with pHrodo-labeled live K. aerogenes at a 1:100 ratio for the indicated time. Cells were suspended in basic pH buffer and analyzed for the percentage of pHrodo positive cells by flow cytometry, which represents the cells that engulfed K. aerogenes. Quantification of engulfed K. aerogenes is compared between different Dictyostelium strains. (D) The mean and SD resulting from quantification of 3 independent repetitions of the experiments exemplified in (C) are plotted. (E) fAR1 recognizes not only diffusible chemoattractant but also immobilized ligand on bacterial surface to mediate both migration and engulfment. Underlying data can be found in S1 Data. ERK2, extracellular signal-regulated kinase 2; fAR1, folic acid receptor 1; LPS, lipopolysaccharide; PI3K, phosphatidylinositol-4,5-bisphosphate 3-kinase abbreviation SSC, side scatter; WT, wild type.

References

    1. Stefater JA 3rd, Ren S, Lang RA, Duffield JS. Metchnikoff's policemen: macrophages in development, homeostasis and regeneration. Trends Mol Med. 2011;17(12):743–52. doi: 10.1016/j.molmed.2011.07.009 ; PubMed Central PMCID: PMC3225647. - DOI - PMC - PubMed
    1. Freeman SA, Grinstein S. Phagocytosis: receptors, signal integration, and the cytoskeleton. Immunol Rev. 2014;262(1):193–215. doi: 10.1111/imr.12212 . - DOI - PubMed
    1. Kaufmann SHE, Dorhoi A. Molecular Determinants in Phagocyte-Bacteria Interactions. Immunity. 2016;44(3):476–91. doi: 10.1016/j.immuni.2016.02.014 . - DOI - PubMed
    1. Rougerie P, Miskolci V, Cox D. Generation of membrane structures during phagocytosis and chemotaxis of macrophages: role and regulation of the actin cytoskeleton. Immunol Rev. 2013;256(1):222–39. doi: 10.1111/imr.12118 ; PubMed Central PMCID: PMC3806206. - DOI - PMC - PubMed
    1. Devreotes PN, Bhattacharya S, Edwards M, Iglesias PA, Lampert T, Miao Y. Excitable Signal Transduction Networks in Directed Cell Migration. Annu Rev Cell Dev Biol. 2017;33:103–25. doi: 10.1146/annurev-cellbio-100616-060739 . - DOI - PMC - PubMed

Publication types

LinkOut - more resources