. 2018 Nov;15(11):1698-1707.
doi: 10.1016/j.hrthm.2018.05.018. Epub 2018 May 23.

Electrophysiological effects of nicotinic and electrical stimulation of intrinsic cardiac ganglia in the absence of extrinsic autonomic nerves in the rabbit heart

Affiliations

Electrophysiological effects of nicotinic and electrical stimulation of intrinsic cardiac ganglia in the absence of extrinsic autonomic nerves in the rabbit heart

Emily Allen et al. Heart Rhythm. 2018 Nov.

Abstract

Background: The intrinsic cardiac nervous system is a rich network of cardiac nerves that converge to form distinct ganglia and extend across the heart and is capable of influencing cardiac function.

Objective: The goals of this study were to provide a complete picture of the neurotransmitter/neuromodulator profile of the rabbit intrinsic cardiac nervous system and to determine the influence of spatially divergent ganglia on cardiac electrophysiology.

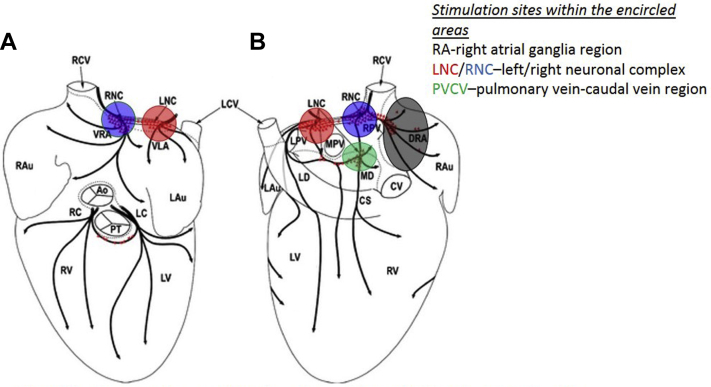
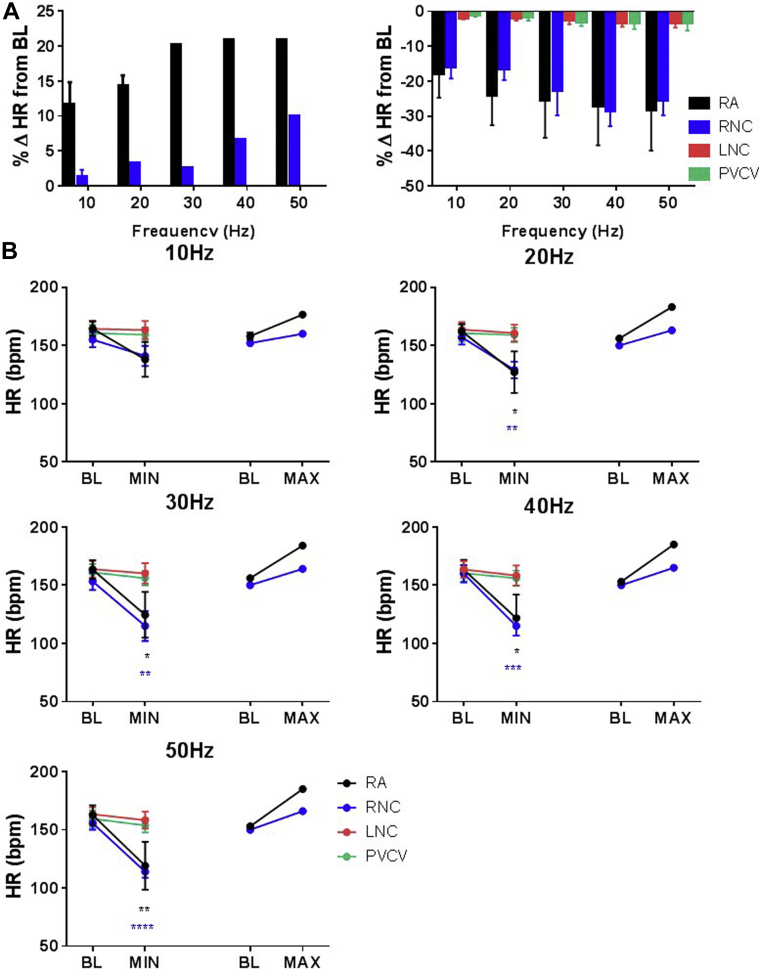
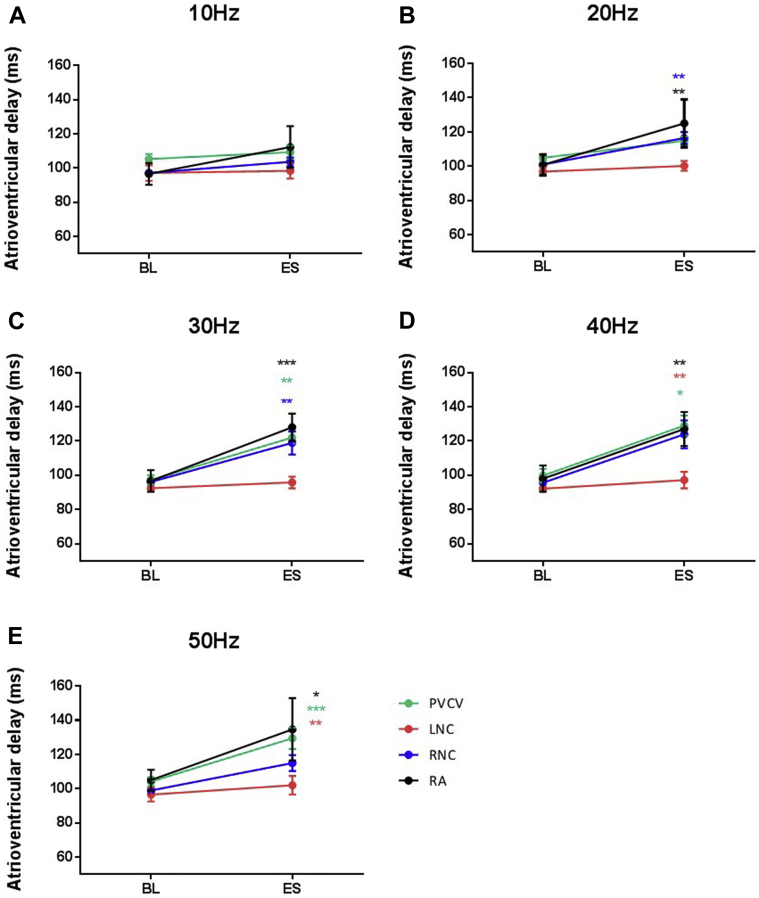
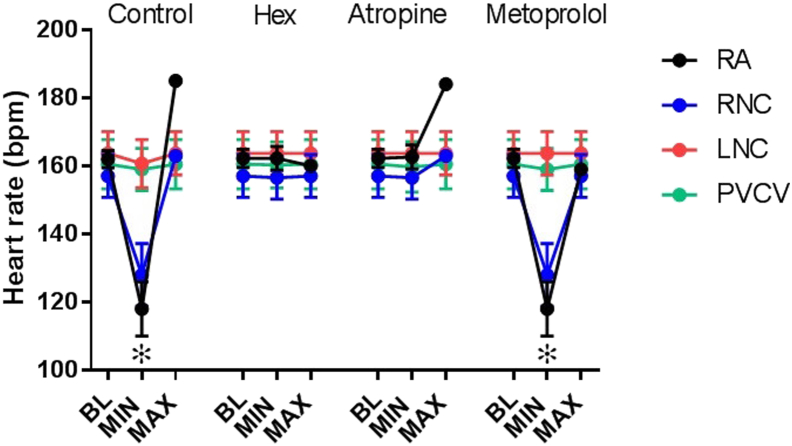
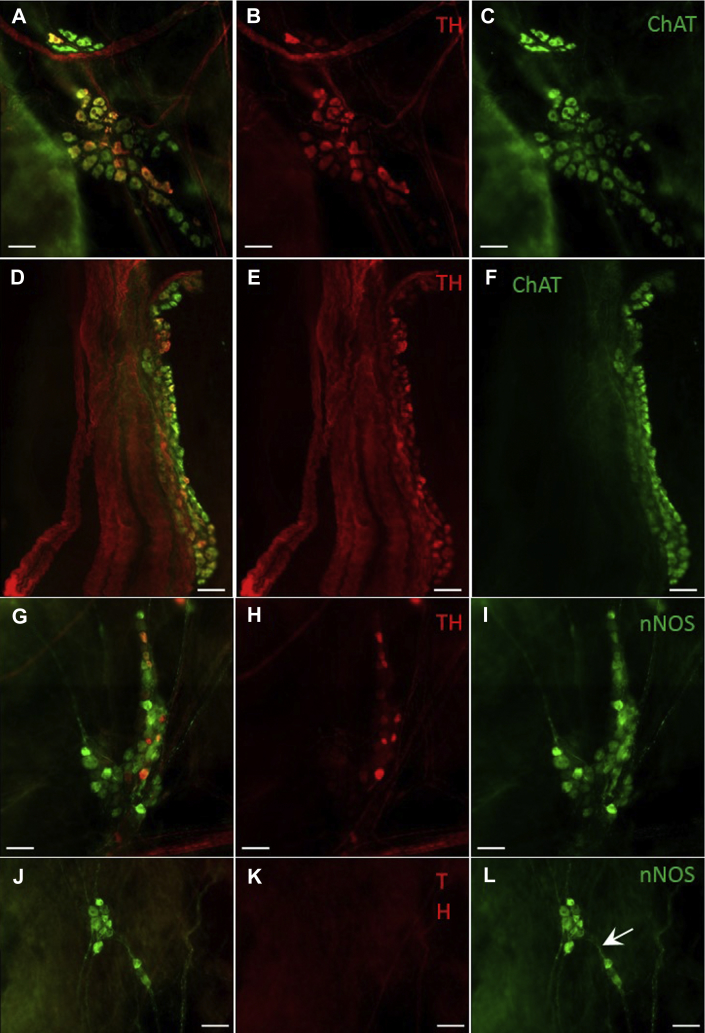
Methods: Nicotinic or electrical stimulation was applied at discrete sites of the intrinsic cardiac nerve plexus in the Langendorff-perfused rabbit heart. Functional effects on sinus rate and atrioventricular conduction were measured. Immunohistochemistry for choline acetyltransferase (ChAT), tyrosine hydroxylase, and/or neuronal nitric oxide synthase (nNOS) was performed using whole mount preparations.

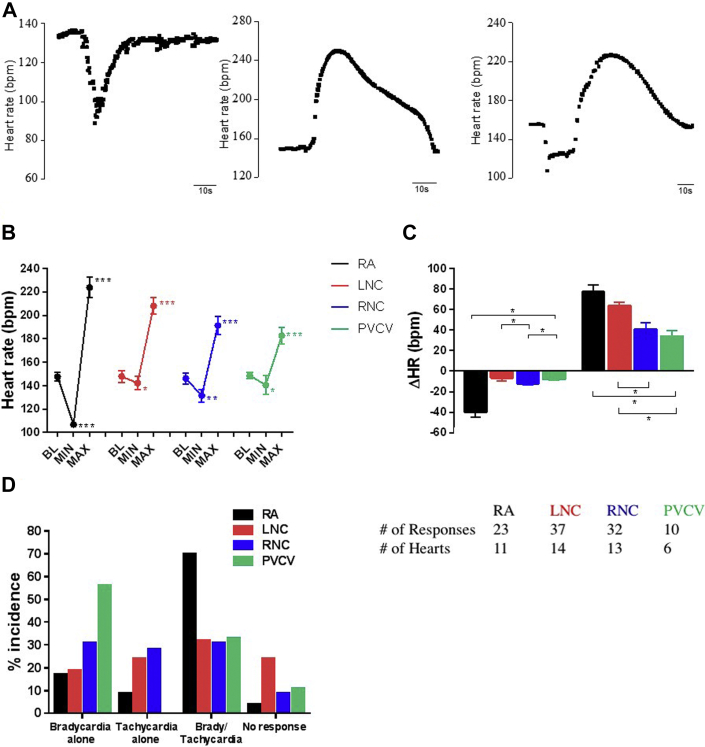
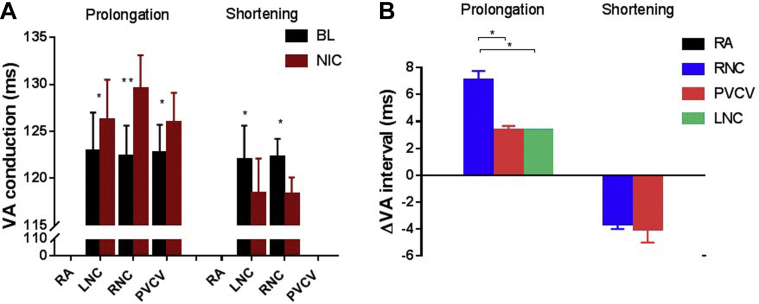
Results: Stimulation within all ganglia produced either bradycardia, tachycardia, or a biphasic brady-tachycardia. Electrical stimulation of the right atrial and right neuronal cluster regions produced the largest chronotropic responses. Significant prolongation of atrioventricular conduction was predominant at the pulmonary vein-caudal vein region. Neurons immunoreactive (IR) only for ChAT, tyrosine hydroxylase, or nNOS were consistently located within the limits of the hilum and at the roots of the right cranial and right pulmonary veins. ChAT-IR neurons were most abundant (1946 ± 668 neurons). Neurons IR only for nNOS were distributed within ganglia.

Conclusion: Stimulation of intrinsic ganglia, shown to be of phenotypic complexity but predominantly of cholinergic nature, indicates that clusters of neurons are capable of independent selective effects on cardiac electrophysiology, therefore providing a potential therapeutic target for the prevention and treatment of cardiac disease.

Keywords: Choline acetyltransferase; Electrophysiology; Ganglionic plexus; Heart; Intrinsic cardiac ganglia; Neuronal nitric oxide synthase; Tyrosine hydroxylase.


Figures

Figure 1
Figure 1
Anterior (A) and posterior (B) views of the heart, indicating sites of ganglionic stimulation in the present study. Red triangles indicate the location of neuronal clusters and epicardial ganglia. Ao = aorta; CS = coronary sinus; CV = caudal vein; DRA = dorsal right atrial subplexus; Lau = left auricle; LC = left coronary subplexus; LCV = left cranial vein; LD = left dorsal subplexus; LNC = left neuronal cluster; LPV = left pulmonary vein; LV = left ventricle; MD = middle dorsal subplexus; MPV = middle pulmonary vein; PT = pulmonary trunk; RAu = right auricle; RC = right coronary subplexus; RCV = right cranial vein; RNC = right neuronal cluster; RPV = right pulmonary vein; RV = right ventricle; VLA = ventral left atrial subplexus; VRA = ventral right atrial subplexus.
Figure 2
Figure 2
Quantification of nicotine-induced HR responses. A: Characteristic chronotropic responses to nicotinic application at individual cardiac regions known to contain ganglia. B: HR at BL and during bradycardia (MIN) and tachycardia (MAX) phases of the response. C: ΔHR of each phase. P < .05, ∗∗P < .01, ∗∗∗P < .001 vs corresponding BL. D: Incidence of each HR response according to response type and region. The table given at the end presents the number of responses (nicotine applications) and hearts studied. BL = baseline; HR = heart rate; ΔHR = change in heart rate; LNC = left neuronal cluster; MAX = HR during tachycardia phases of the response; MIN = HR during bradycardia phases of the response; PVCV = pulmonary vein-caudal vein; RA = right atrial; RCV = right cranial vein.
Figure 3
Figure 3
HR independent changes in atrioventricular conduction during constant right ventricular pacing. A: Mean data representing the interval from ventricular pacing to atrial electrogram activation at BL and after NIC application. B: Mean data representing the change in VA interval calculated from data in panel A. BL = baseline; HR = heart rate; LNC = left neuronal cluster; NIC = nicotine; PVCV = pulmonary vein-caudal vein; RA = right atrial; RCV = right cranial vein; VA = ventriculo-atrial; ΔVA = the change in VA from BL. P < .05, ∗∗P < .01 vs BL.
Figure 4
Figure 4
HR responses induced by electrical stimulation at sites in RA, RNC, LNC, and PVCV. A: Comparison of %ΔHR during electrical stimulation at different regions. B: Comparison of maximum reductions and maximum increases in HR compared to BL during electrical stimulation at different frequencies—10, 20, 30, 40, and 50 Hz—at sites in different regions—RA (black), RNC (blue), LNC (red), and PVCV (green). Data are presented as mean ± SEM. BL = baseline; HR = heart rate; %ΔHR = percent change in heart rate; LNC = left neuronal cluster; MAX = maximum increase in HR compared to BL; MIN = maximum reduction in HR compared to BL; PVCV = pulmonary vein-caudal vein; RA = right atrial; RCV = right cranial vein. P < .05, ∗∗P < .01, ∗∗∗P < .001,∗∗∗∗P < .0001 vs BL HR.
Figure 5
Figure 5
ES–induced effects on atrioventricular conduction. Mean data representing the average change in atrioventricular delay during electrical stimulation at sites in intrinsic cardiac ganglia—PVCV (n = 9), LNC (n = 7), RNC (n = 27), and RA (n = 4)—at different frequencies—(A) 10 Hz, (B) 20 Hz, (C) 30 Hz, (D) 40 Hz, and (E) 50 Hz. Data are presented as mean ± SEM. BL = baseline; ES = electrical stimulation; LNC = left neuronal cluster; PVCV = pulmonary vein-caudal vein; RA = right atrial; RCV = right cranial vein. P < .05, ∗∗P < .01, ∗∗∗P < .001.
Figure 6
Figure 6
Pharmacological autonomic blockade of HR responses to electrical stimulation. HR response during control and in the presence of atropine (0.1 μM15), metoprolol (1.8 μM15), and hexamethonium (0.5 mM23). Electrical stimulation applied at either LNC, PVCV, RA, or RNC. Data are presented as mean ± SEM. BL = baseline; HR = heart rate; LNC = left neuronal cluster; MAX = maximum increase in HR compared to BL; MIN = maximum reduction in HR compared to BL; PVCV = pulmonary vein-caudal vein; RA = right atrial; RCV = right cranial vein; RNC = right neuronal cluster. P < .001 vs BL HR.
Figure 7
Figure 7
Microphotographs illustrating the predominance of cholinergic (ChAT-IR) neurons within ganglia. A–C: Microphotographs of ganglia containing both ChAT-IR and TH-IR neurons located within the RNC of the rabbit ICNS. D–F: Microphotographs illustrating nerves accessing the heart on the medial side of the root of RCV, where TH-IR nerve fibers predominate. G–I: Microphotographs illustrating the presence of both TH-IR and nNOS-IR neurons at the root of RCV. J–L: Illustration of a smaller ganglion located in close proximity to ganglia shown in images G and H and containing only nNOS-positive neurons. Note the thin nNOS-IR nerve fibers (white arrow) connecting 2 small neighboring ganglia. Scale bars represent 100 μm. ChAT = choline acetyltransferase; IR = immunoreactive; nNOS = neuronal nitric oxide synthase; RCV = right cranial vein; RNC = right neuronal cluster; TH = tyrosine hydroxylase.

References

    1. Wake E., Brack K. Characterization of the intrinsic cardiac nervous system. Auton Neurosci. 2016;199:3–16. - PubMed
    1. Butler C.K., Smith F.M., Cardinal R., Murphy D.A., Hopkins D.A., Armour J.A. Cardiac responses to electrical stimulation of discrete loci in canine atrial and ventricular ganglionated plexi. Am J Physiol. 1990;259:H1365–H1373. - PubMed
    1. Cardinal R., Page P., Vermeulen M., Ardell J.L., Armour J.A. Spatially divergent cardiac responses to nicotinic stimulation of ganglionated plexus neurons in the canine heart. Auton Neurosci. 2009;145:55–62. - PubMed
    1. Armour J.A., Huang M.H., Smith F.M. Peptidergic modulation of in situ canine intrinsic cardiac neurons. Peptides. 1993;14:191–202. - PubMed
    1. Brack K.E. The heart’s “little brain” controlling cardiac function in the rabbit. Exp Physiol. 2015;100:348–353. - PMC - PubMed

Publication types

LinkOut - more resources