

Spatially explicit assessment of heat health risk by using multi-sensor remote sensing images and socioeconomic data in Yangtze River Delta, China
- PMID: 29801488
- PMCID: PMC5970500
- DOI: 10.1186/s12942-018-0135-y
Spatially explicit assessment of heat health risk by using multi-sensor remote sensing images and socioeconomic data in Yangtze River Delta, China
Abstract
Background: The increase in the frequency and intensity of extreme heat events, which are potentially associated with climate change in the near future, highlights the importance of heat health risk assessment, a significant reference for heat-related death reduction and intervention. However, a spatiotemporal mismatch exists between gridded heat hazard and human exposure in risk assessment, which hinders the identification of high-risk areas at finer scales.
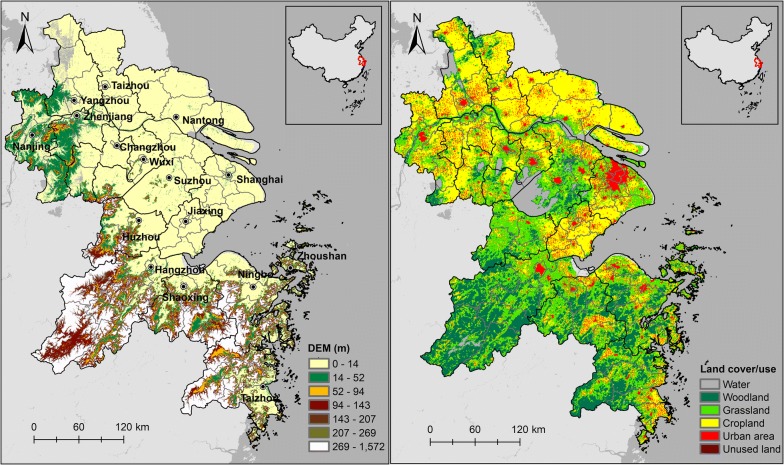
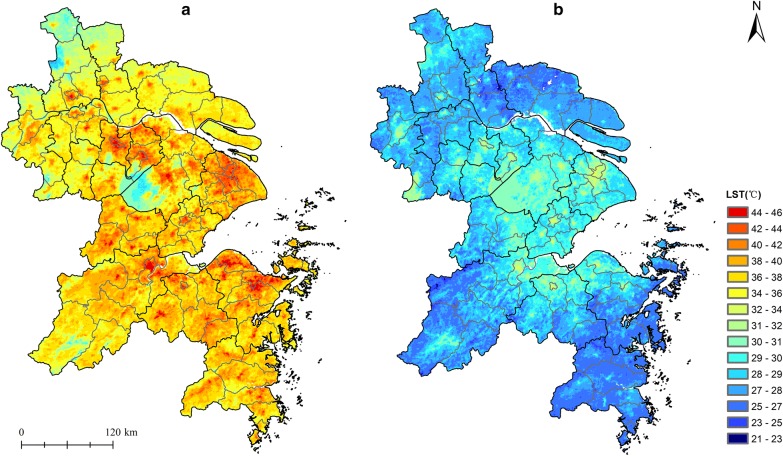
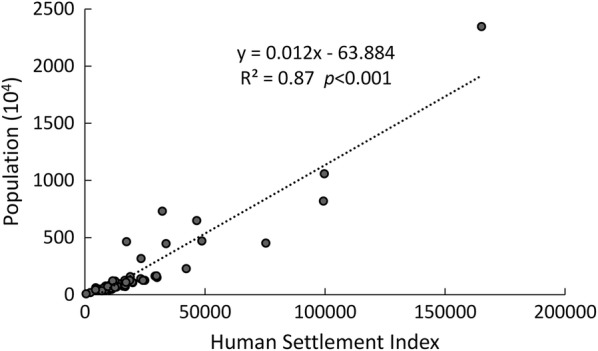
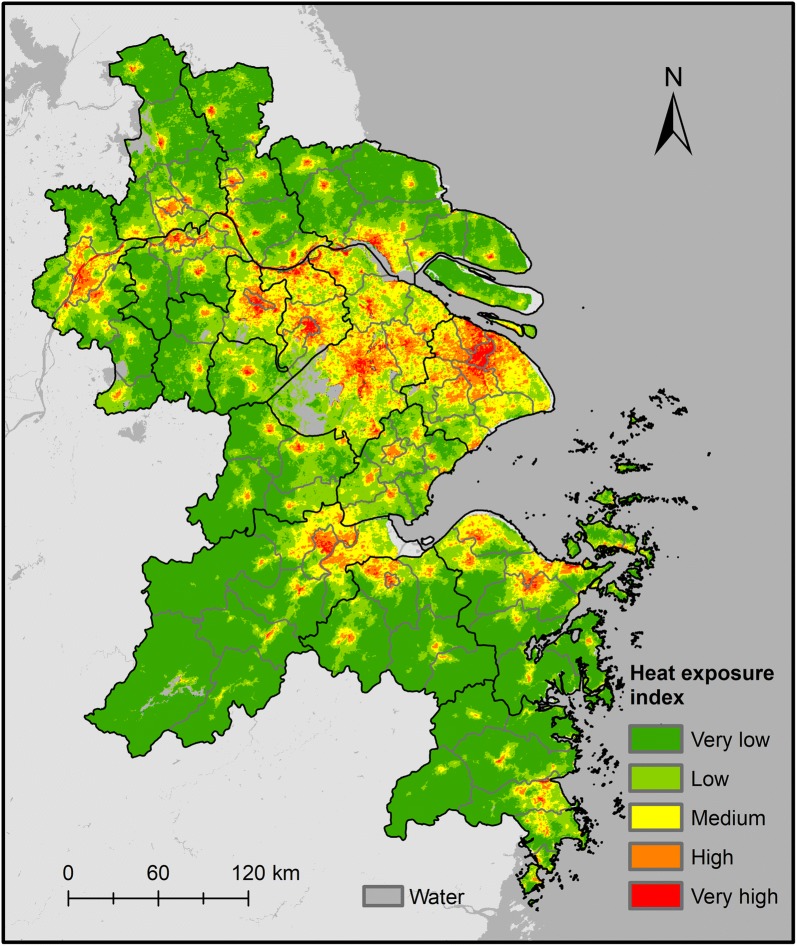
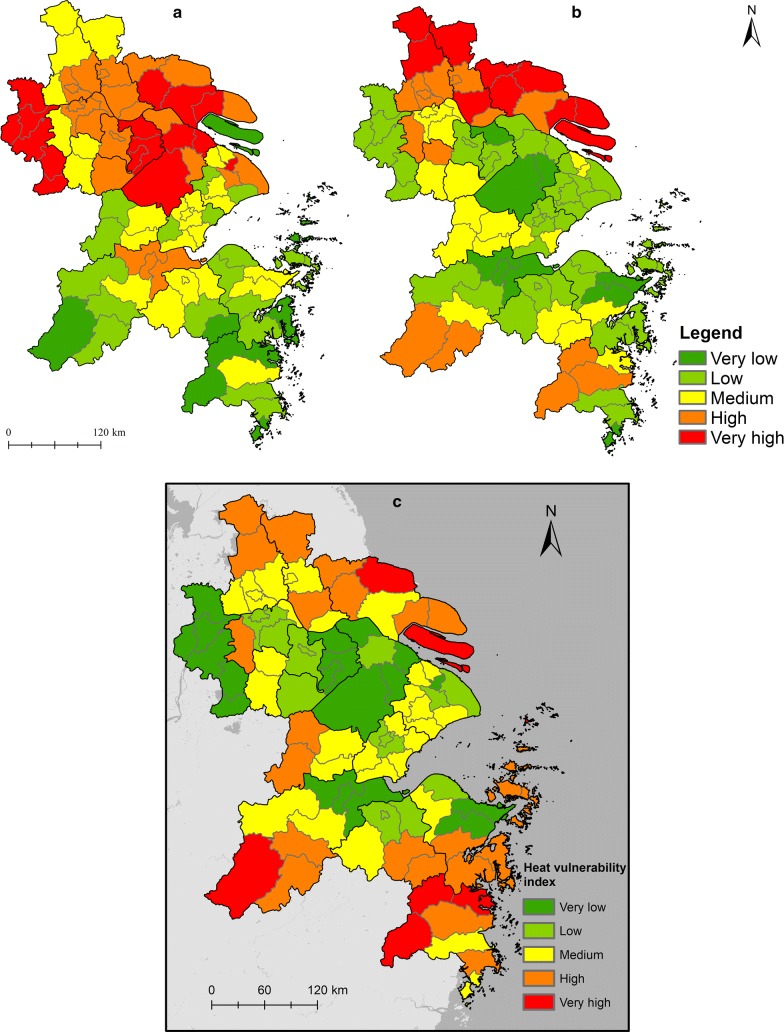
Methods: A human settlement index integrated by nighttime light images, enhanced vegetation index, and digital elevation model data was utilized to assess the human exposure at high spatial resolution. Heat hazard and vulnerability index were generated by land surface temperature and demographic and socioeconomic census data, respectively. Spatially explicit assessment of heat health risk and its driving factors was conducted in the Yangtze River Delta (YRD), east China at 250 m pixel level.
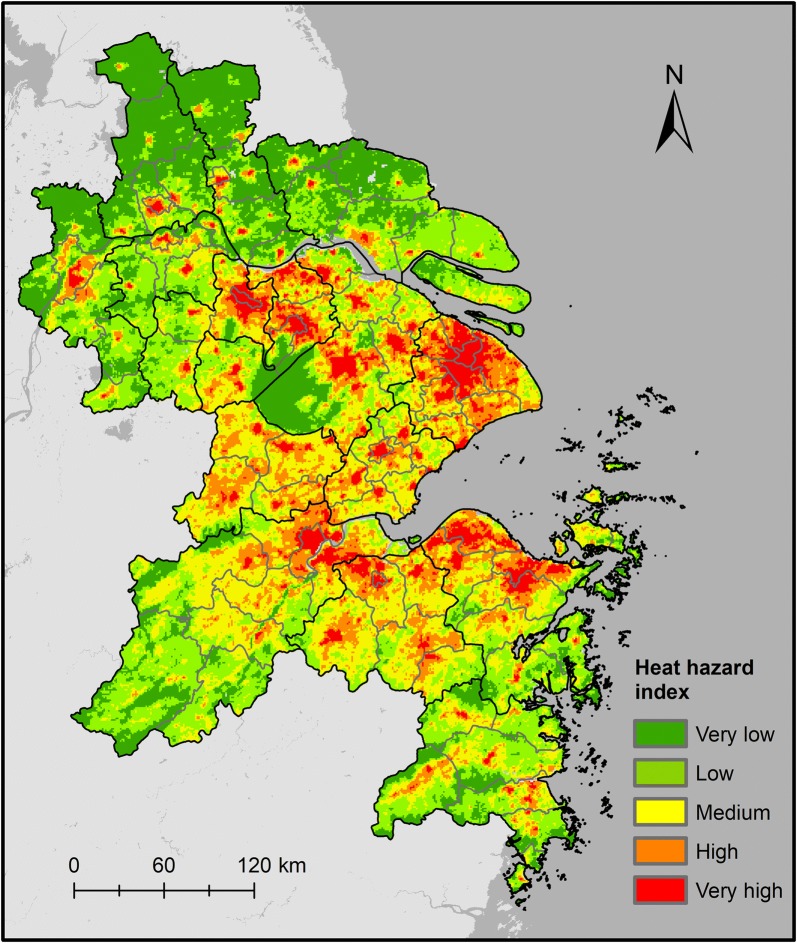
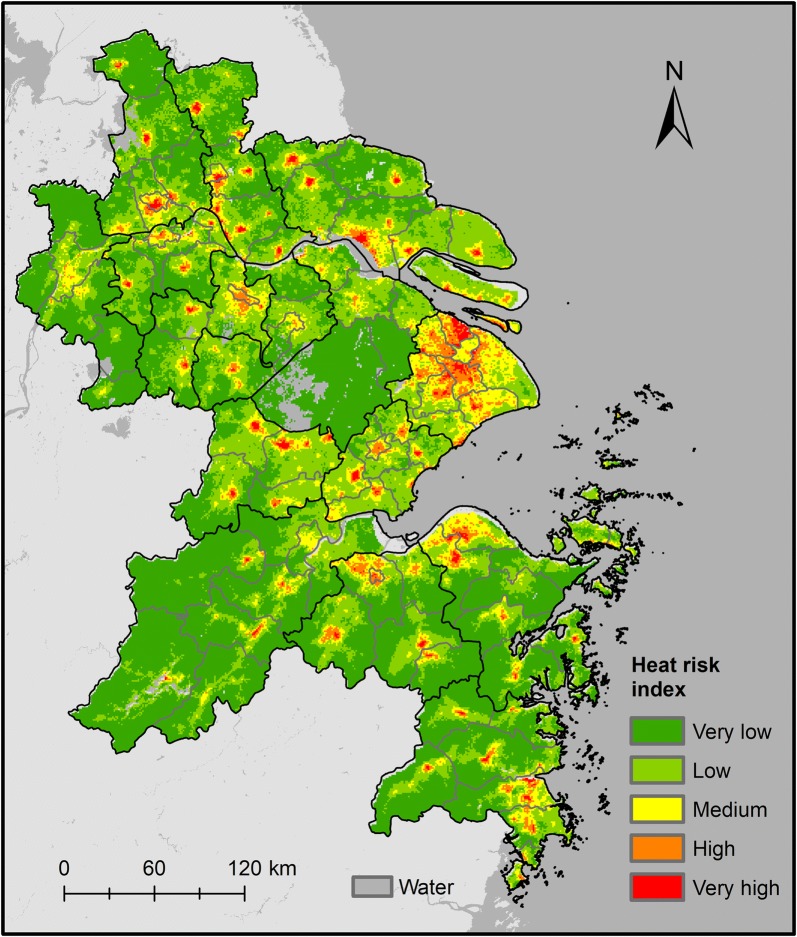
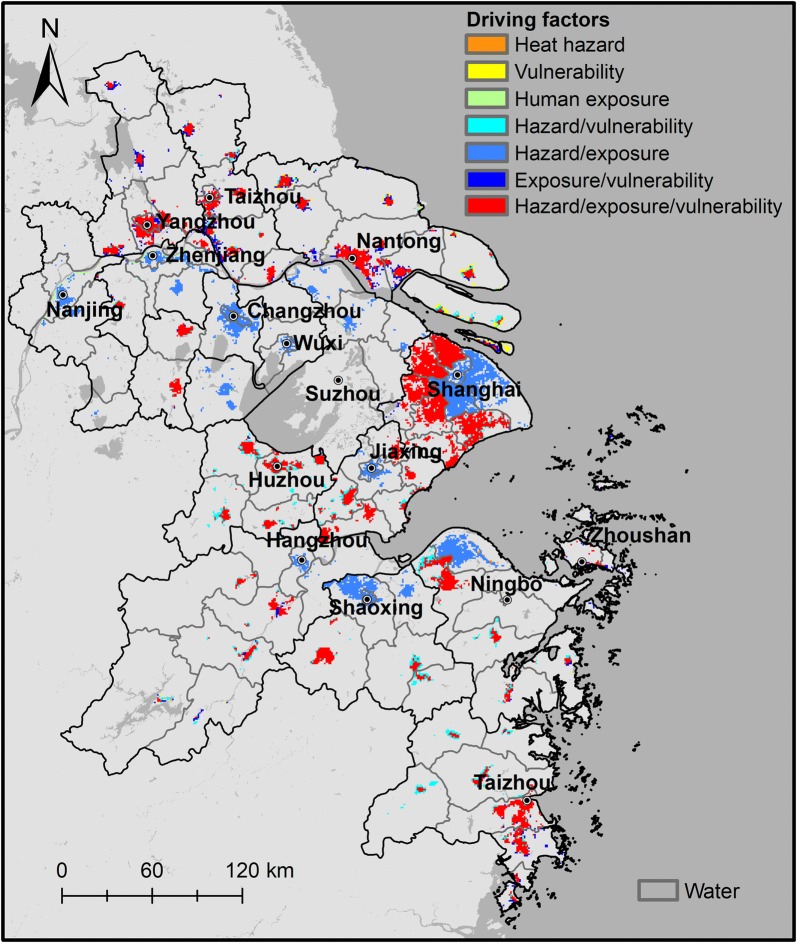
Results: High-risk areas were mainly distributed in the urbanized areas of YRD, which were mostly driven by high human exposure and heat hazard index. In some less-urbanized cities and suburban and rural areas of mega-cities, the heat health risks are in second priority. The risks in some less-developed areas were high despite the low human exposure index because of high heat hazard and vulnerability index.
Conclusions: This study illustrated a methodology for identifying high-risk areas by combining freely available multi-source data. Highly urbanized areas were considered hotspots of high heat health risks, which were largely driven by the increasing urban heat island effects and population density in urban areas. Repercussions of overheating were weakened due to the low social vulnerability in some central areas benefitting from the low proportion of sensitive population or the high level of socioeconomic development. By contrast, high social vulnerability intensifies heat health risks in some less-urbanized cities and suburban areas of mega-cities.
Keywords: GIS; Heat health risk; Remote sensing; Spatial risk assessment; Yangtze River Delta.
Figures
Similar articles
-
Spatio-temporal variations of heat extremes across the yangtze river delta during 2001-2023 based on remotely sensed seamless air temperature.Environ Res. 2025 Mar 1;268:120824. doi: 10.1016/j.envres.2025.120824. Epub 2025 Jan 10. Environ Res. 2025. PMID: 39800303
-
A Spatial Framework to Map Heat Health Risks at Multiple Scales.Int J Environ Res Public Health. 2015 Dec 18;12(12):16110-23. doi: 10.3390/ijerph121215046. Int J Environ Res Public Health. 2015. PMID: 26694445 Free PMC article.
-
Spatially Explicit Mapping of Heat Health Risk Utilizing Environmental and Socioeconomic Data.Environ Sci Technol. 2017 Feb 7;51(3):1498-1507. doi: 10.1021/acs.est.6b04355. Epub 2017 Jan 25. Environ Sci Technol. 2017. PMID: 28068073
-
Mapping Heat Vulnerability and Heat Risk for Neighborhood Health Risk Management in Urban Environment? Challenges and Opportunities.Curr Environ Health Rep. 2025 Feb 24;12(1):14. doi: 10.1007/s40572-025-00478-7. Curr Environ Health Rep. 2025. PMID: 39992351 Review.
-
Review on research methods of the surface urban heat island effect based on CNKI bibliometrics.Ying Yong Sheng Tai Xue Bao. 2025 Mar 18;36(3):647-658. doi: 10.13287/j.1001-9332.202503.029. Ying Yong Sheng Tai Xue Bao. 2025. PMID: 40380824 Review. English.
Cited by
-
Shared insights for heat health risk adaptation in metropolitan areas of developing countries.iScience. 2024 Apr 12;27(5):109728. doi: 10.1016/j.isci.2024.109728. eCollection 2024 May 17. iScience. 2024. PMID: 38706855 Free PMC article.
-
Heat health assessment and risk simulation prediction in eastern China: a geospatial analysis.Front Public Health. 2025 Mar 7;13:1521997. doi: 10.3389/fpubh.2025.1521997. eCollection 2025. Front Public Health. 2025. PMID: 40124407 Free PMC article.
-
Mapping Heat-Related Risks in Northern Jiangxi Province of China Based on Two Spatial Assessment Frameworks Approaches.Int J Environ Res Public Health. 2020 Sep 10;17(18):6584. doi: 10.3390/ijerph17186584. Int J Environ Res Public Health. 2020. PMID: 32927631 Free PMC article.
-
Spatiotemporal Variation Analysis of the Fine-Scale Heat Wave Risk along the Jakarta-Bandung High-Speed Railway in Indonesia.Int J Environ Res Public Health. 2021 Nov 19;18(22):12153. doi: 10.3390/ijerph182212153. Int J Environ Res Public Health. 2021. PMID: 34831908 Free PMC article.
-
Climate-related health impact indicators for public health surveillance in a changing climate: a systematic review and local suitability analysis.Lancet Reg Health Am. 2024 Jul 29;38:100854. doi: 10.1016/j.lana.2024.100854. eCollection 2024 Oct. Lancet Reg Health Am. 2024. PMID: 39171197 Free PMC article. Review.
References
-
- WHO . The world health report 2008: primary health care-now more than ever. Geneva: World Health Organization; 2008.
Publication types
MeSH terms
Grants and funding
LinkOut - more resources
Full Text Sources
Other Literature Sources
