. 2018 Jun 19;48(6):1183-1194.e5.
doi: 10.1016/j.immuni.2018.04.004. Epub 2018 May 22.

Anti-apoptotic Protein BIRC5 Maintains Survival of HIV-1-Infected CD4+ T Cells

Affiliations

Anti-apoptotic Protein BIRC5 Maintains Survival of HIV-1-Infected CD4+ T Cells

Hsiao-Hsuan Kuo et al. Immunity. .

Abstract

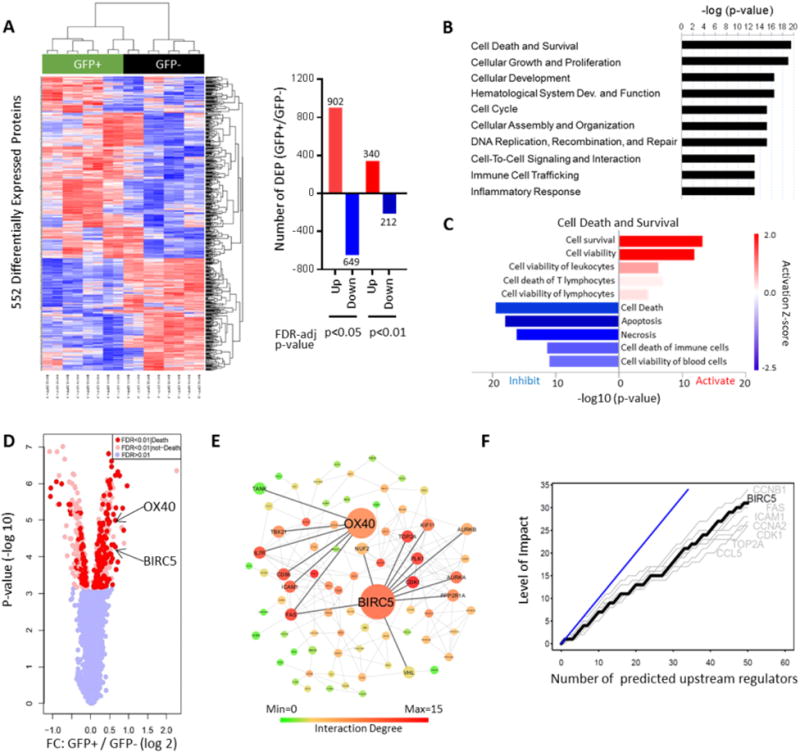
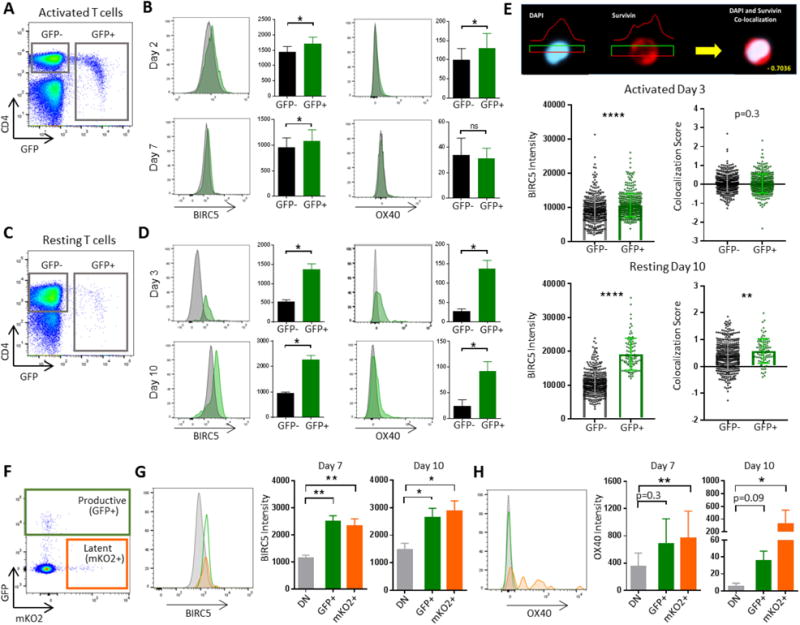
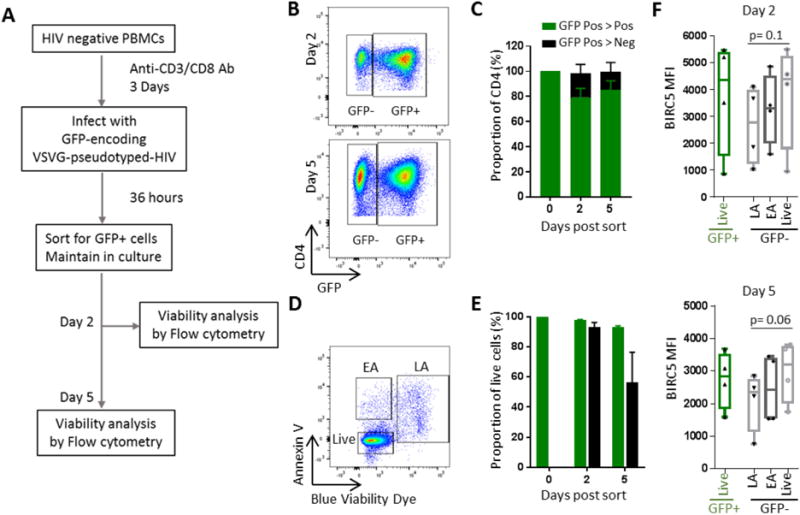
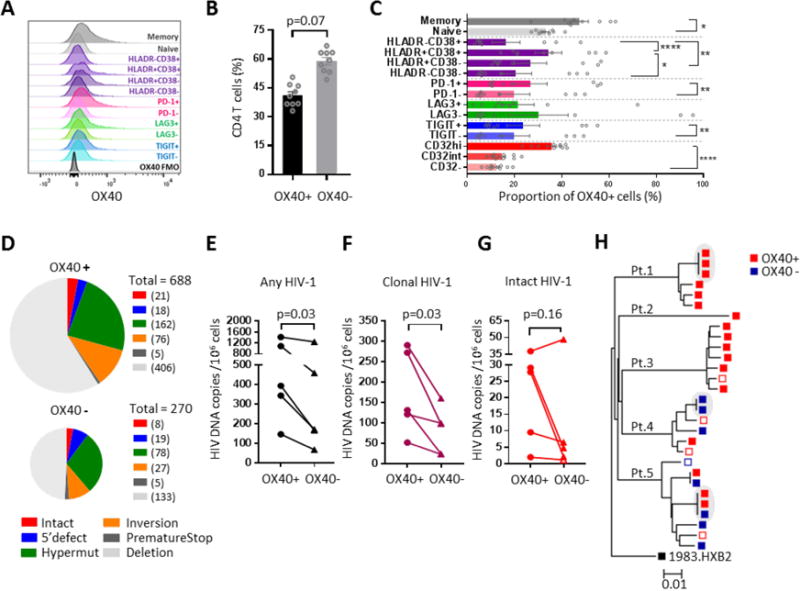
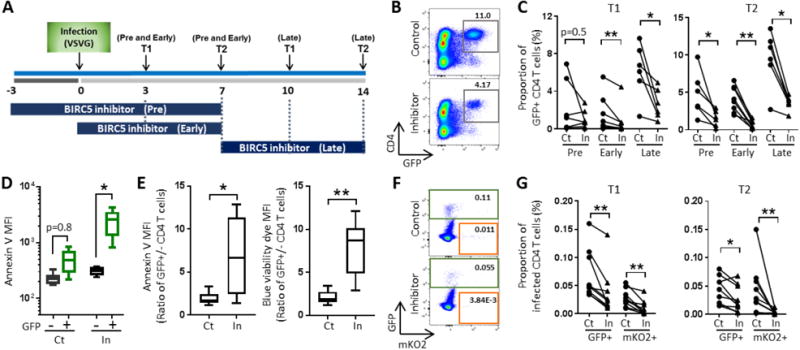
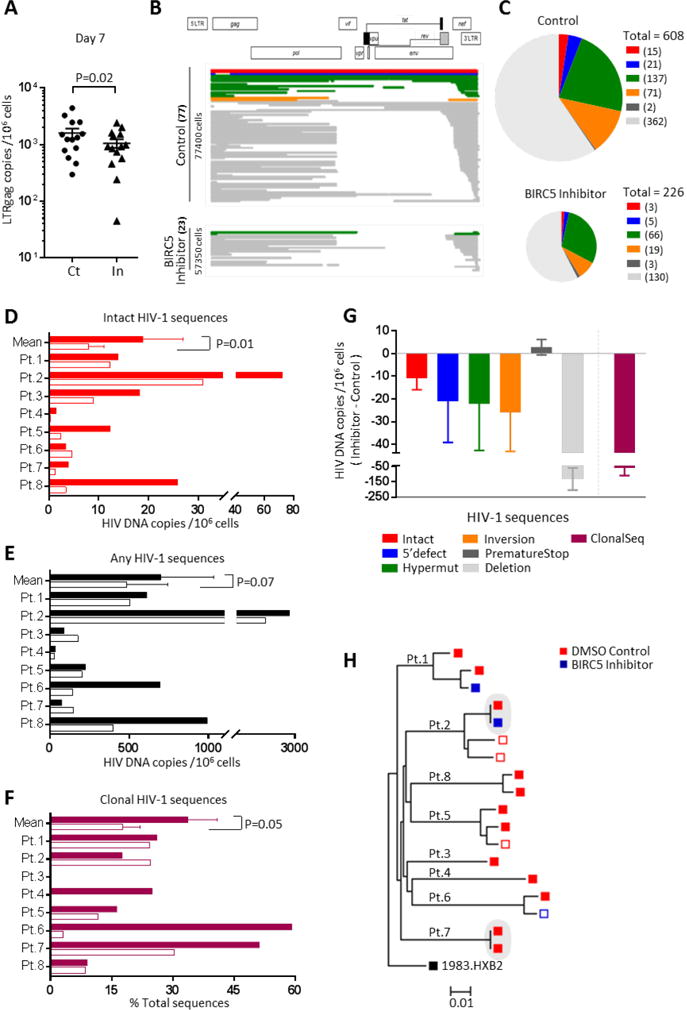
HIV-1 infection of CD4+ T cells leads to cytopathic effects and cell demise, which is counter to the observation that certain HIV-1-infected cells possess a remarkable long-term stability and can persist lifelong in infected individuals treated with suppressive antiretroviral therapy (ART). Using quantitative mass spectrometry-based proteomics, we showed that HIV-1 infection activated cellular survival programs that were governed by BIRC5, a molecular inhibitor of cell apoptosis that is frequently overexpressed in malignant cells. BIRC5 and its upstream regulator OX40 were upregulated in productively and latently infected CD4+ T cells and were functionally involved in maintaining their viability. Moreover, OX40-expressing CD4+ T cells from ART-treated patients were enriched for clonally expanded HIV-1 sequences, and pharmacological inhibition of BIRC5 resulted in a selective decrease of HIV-1-infected cells in vitro. Together, these findings suggest that BIRC5 supports long-term survival of HIV-1-infected cells and may lead to clinical strategies to reduce persisting viral reservoirs.

Keywords: BIRC5; HIV-1; OX40; Survivin; apoptosis; clonal proliferation; latency; proteomics; viral reservoirs.


Conflict of interest statement

Conflicts of Interests

The authors declare that conflicts of interests do not exist.

Figures

Figure 1
Figure 1. HIV-1 activates survival programs in infected CD4+ T cells
(A): Left panel: Heatmap demonstrating differentially expressed proteins between GFP+ and GFP CD4+ T cells following in vitro infection with GFP-encoding HIV-1. Samples were run in biological duplicates; data from four patients are shown. Rows represent individual proteins detected by quantitative mass spectrometry. Right panel: Bar diagrams reflecting numbers of upregulated and downregulated proteins in GFP+ CD4+ T cells at indicated levels of FDR-adjusted significance. (B): Predicted functional annotations (“diseases and functions”) of differentially-expressed proteins (FDR-adjusted p-value <0.01), based on Ingenuity Pathway Analysis (IPA). (C): Predicted canonical pathway enrichment of differentially-expressed proteins (FDR-adjusted p-value <0.01). Z-score indicates activation vs. inhibition of indicated functions. (D): Volcano plot indicating fold-changes and corresponding FDR-adjusted p-values of all detected proteins in GFP+/GFP cells. Proteins with predicted involvement in cell death and survival are highlighted in red. (E): Functional linkage network of differentially-expressed proteins. Positions of BIRC5 and its upstream regulator OX40 are indicated. (F): Diagram reflecting top 8 effector molecules most frequently involved in downstream signaling of predicted upstream regulators of differentially-expressed proteins. Y-axis reflects number of upstream regulators signaling via indicated effector molecules. Blue line indicates hypothetical reference molecule involved in downstream signaling of all upstream regulators. See also Figure S1, Table S1 and Table S2.
Figure 2
Figure 2. BIRC5 and OX40 are upregulated in productively and latently HIV-1-infected CD4+ T cells
(A/C): Representative flow cytometry dot plots demonstrating gating of GFP+ and GFP CD4+ T cells following infection of in vitro activated (A, day 7 after infection) and non-activated (C, day 10 after infection) CD4+ T cells with R5-tropic GFP-encoding HIV-1. (B/D): Histograms reflecting intracellular BIRC5 and surface OX40 expression on CD4+ T cell populations (n=6) described in (A/B) at indicated timepoints after infection. Bar diagrams summarize expression intensity of BIRC5 and OX40 on GFP+ and GFP-CD4+ T cell populations described in (A/B). *p<0.05 (Wilcoxon test). (E): Representative ImageStream analysis plots indicating subcellular location of BIRC5 in CD4+ T cells, relative to nuclear counterstain with DAPI. Left panels demonstrate intracellular BIRC5 expression on activated CD4+ T cells and non-activated CD4+ T cells at indicated timepoints after infection; right panels show co-localization scores between BIRC5 and DAPI. Each dot represents data from one individual cell. Results from one out of two experiments are shown. **p<0.01, ****p<0.0001 (Mann-Whitney U test). (F): Representative flow cytometry dot plot indicating gating of GFP+, mKO2+ and GFP/mKO2 cells following infection of resting CD4+ T cells with dual reporter-encoding HIV-1. (G-H): Representative histograms and bar diagrams reflecting fluorescence intensity of BIRC5 (G) and OX40 (H) in cell populations described in (F). Data from n=6 study subjects are shown. (G-H): *p<0.05, **p<0.01 (Friedman test with post-hoc Dunn’s test for multiple comparison).
Figure 3
Figure 3. BIRC5 expression is functionally associated with survival of HIV-1-infected CD4+ T cells
(A): Schematic overview for analyzing cell death in CD4+ T cells transitioning from productive infection to latency, as described in (Cooper et al., 2013). (B): Flow cytometry dot plots indicating gating of GFP+ and GFP CD4+ T cells on days 2 and 5 within GFP+ CD4+ T cells sorted on day 0. (C): Bar diagram summarizing proportions of GFP+ and GFP CD4+ T cells on indicated timepoints within GFP+ CD4+ T cells sorted on day 0. Mean and standard error from n=4 study subjects are shown. (D): Representative flow cytometry dot plot showing relative proportions of cells in early apoptosis (“EA”), late apoptosis (“LA”) or live cells (“Live”) on day 5 after sorting of GFP+ CD4+ T cells. (E): Bar diagrams demonstrating proportions of live cells within GFP+ and GFP HIV-1-infected CD4+ T cells on indicated timepoints after sorting of GFP+ CD4+ T cells on day 0. (F): Expression intensity of BIRC5 in indicated GFP+ and GFP CD4+ T cell populations on day 2 and day 5 after sorting of GFP+ CD4+ T cells on day 0. Differences were tested for significance using one-tailed Wilcoxon test.
Figure 4
Figure 4. OX40 enriches for CD4+ T cells encoding for clonally-expanded HIV-1
(A): Overlap histogram reflecting OX40 expression in indicated CD4+ T cell populations. Data from one representative study subject are shown. (B/C): Bar diagrams reflecting the proportions of OX40+ CD4+ T cells within total CD4+ T cells (B) and within CD4+ T cell populations with indicated phenotypic properties (C). Data from 9 ART-treated HIV-1 patients are shown. *p<0.05, **p<0.01, ****p<0.001 (Wilcoxon test or Friedman test with post-hoc Dunn’s test). (D): Pie charts reflecting HIV-1 DNA copies amplified by single-template near full-length HIV-1 PCR from OX40+ and OX40 CD4+ T cells. Color coding indicates categories of HIV-1 that are intact or show defined defects. Cumulative data from n=5 study subjects are shown, pie sizes correlate to total numbers of sequences analyzed. (E-G): Frequency of any (E), clonally-expanded (F, defined as sequences detected more than once) and intact (G) HIV-1 DNA copies in OX40+ and OX40 CD4+ T cells. P-values were calculated using a one-tailed Wilcoxon test. Open symbol reflects calculated limit of detection. (H): Phylogenetic tree of intact HIV-1 sequences retrieved from OX40+ and OX40 CD4+ T cells from the five study subjects. Shaded areas reflect identical sequences, consistent with clonal expansion. Red symbols: sequences detected in OX40+ CD4+ T cells; blue symbols: sequences detected in OX40 CD4+ T cells. Solid symbols: intact sequences, open symbols: inferred intact sequences. See also Figure S2 and Table S3.
Figure 5
Figure 5. BIRC5 inhibition causes selective reduction of in vitro HIV-1-infected CD4+ T cells
Schematic overview for experiments described in panels (B-G). Note that YM155 (pharmacological inhibitor of BIRC5) was added before (pre, n = 7), immediately after (post, n = 8) or 7 days (late, n = 6) after in vitro infection with VSV-G pseudotyped HIV-1. (B): Flow cytometry dot plots indicating proportions of resting GFP+ CD4+ T cells on day 14 after infection and treatment with YM155 (In) or DMSO as control (Ct) for 7 days. (C): Proportions of GFP+ CD4+ T cells after treatment of HIV-1-infected cells with YM155 (In) or control (Ct) at indicated timepoints. *p<0.05, **p<0.01 (Wilcoxon test). (D): Mean fluorescent intensity of Annexin V in GFP and GFP+ CD4+ T cells after infection and co-culture with YM155 (In) or DMSO as control (Ct) for 7 days. *p<0.05 (Wilcoxon test). (E): Ratio of Annexin V and blue viability dye fluorescence intensity in GFP+ CD4+ T cells relative to GFP counterparts 7 days after infection and treatment with YM155 or control. *p<0.05, **p<0.01 (Wilcoxon test). (F): Representative flow cytometry plots indicating proportions of GFP+ and mKO2+ CD4+ T cells 10 days after infection of resting CD4+ T cells with dual-reporter HIV-1. (G): Proportions of GFP+ and mKO2+ CD4+ T cells cultured for indicated times after infection with dual-reporter virus in the presence of YM155 or control. *p<0.05, **p<0.01 (Wilcoxon test).
Figure 6
Figure 6. Pharmacologic inhibition of BIRC5 diminishes the frequency of in vivo infected CD4+ T cells encoding for intact, near full-length HIV-1 sequences
(A): HIV-1 LTR-Gag DNA copies in CD8- and NK-cell depleted PBMCs from 14 ART-treated patients co-cultured for seven days with YM155. **p<0.01 (One-tailed Wilcoxon test). (B): Diagrams highlighting viral DNA sequences generated by single-template near full-length HIV-1 PCR from CD4+ T cells isolated from an ART-treated patient (patient 8) after seven days of in vitro culture with YM 155 or control DMSO. Absolute frequencies of sequences and numbers of analyzed cells are indicated on y-axis. (C): Pie charts indicating absolute frequencies of HIV-1 DNA sequences generated by single-template near full-length HIV-1 PCR from all eight study patients, after treatment with YM155 or control. Color coding reflects intact HIV-1 DNA or sequences with defined defects. Sizes of pies correspond to total numbers of viral sequences in each condition. (D-F): Numbers of intact (D), any (E) and clonally-expanded (F) HIV-1 sequences detected in YM155-treated (open bars) and control cells (solid bars) in each of the eight study subjects. P-values were calculated using paired one-tailed Wilcoxon test. For patients 3, 4, 5, 7, 8 in panel D, no intact sequence was detected in YM155-treated conditions, respective values reflect calculated limit of detection. (G): Changes in the frequencies of indicated HIV-1 DNA sequences, or in the frequency of clusters consisting of identical viral sequences, during treatment with YM155 in all eight study patients. Data indicate mean and SEM of the difference between HIV-1 DNA sequences/million CD4+ T cells from YM155-treated and control cells. (H): Phylogenetic tree summarizing all intact HIV-1 sequences from the eight study subjects after treatment with control DMSO (red symbols) or YM155 (blue symbols). Shaded areas reflect identical sequences, consistent with clonal expansion. Solid symbols: intact sequences, open symbols: inferred intact sequences. See also Table S4.

Comment in

  • Cheating cell death.
    Minton K. Minton K. Nat Rev Immunol. 2018 Jul;18(7):418-419. doi: 10.1038/s41577-018-0026-2. Nat Rev Immunol. 2018. PMID: 29802385 No abstract available.

Similar articles

Cited by

References

    1. Altieri DC. Survivin and IAP proteins in cell-death mechanisms. The Biochemical journal. 2010;430:199–205. - PMC - PubMed
    1. Altieri DC. Survivin - The inconvenient IAP. Seminars in cell & developmental biology. 2015;39:91–96. - PMC - PubMed
    1. Ambrosini G, Adida C, Altieri DC. A novel anti-apoptosis gene, survivin, expressed in cancer and lymphoma. Nature medicine. 1997;3:917–921. - PubMed
    1. Andersson KM, Brisslert M, Cavallini NF, Svensson MN, Welin A, Erlandsson MC, Ciesielski MJ, Katona G, Bokarewa MI. Survivin co-ordinates formation of follicular T-cells acting in synergy with Bcl-6. Oncotarget. 2015;6:20043–20057. - PMC - PubMed
    1. Archin NM, Liberty AL, Kashuba AD, Choudhary SK, Kuruc JD, Crooks AM, Parker DC, Anderson EM, Kearney MF, Strain MC, et al. Administration of vorinostat disrupts HIV-1 latency in patients on antiretroviral therapy. Nature. 2012;487:482–485. - PMC - PubMed

Publication types