. 2018 Jun;30(6):1337-1352.
doi: 10.1105/tpc.17.00867. Epub 2018 May 25.

The Chromatin Remodelers PKL and PIE1 Act in an Epigenetic Pathway That Determines H3K27me3 Homeostasis in Arabidopsis

Affiliations

The Chromatin Remodelers PKL and PIE1 Act in an Epigenetic Pathway That Determines H3K27me3 Homeostasis in Arabidopsis

Benjamin Carter et al. Plant Cell. 2018 Jun.

Abstract

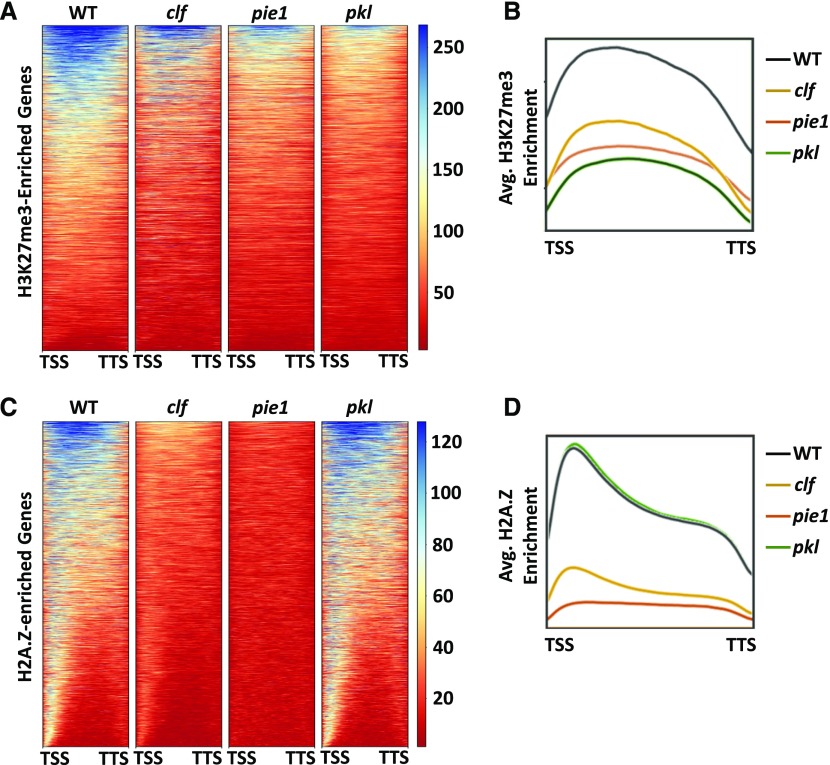
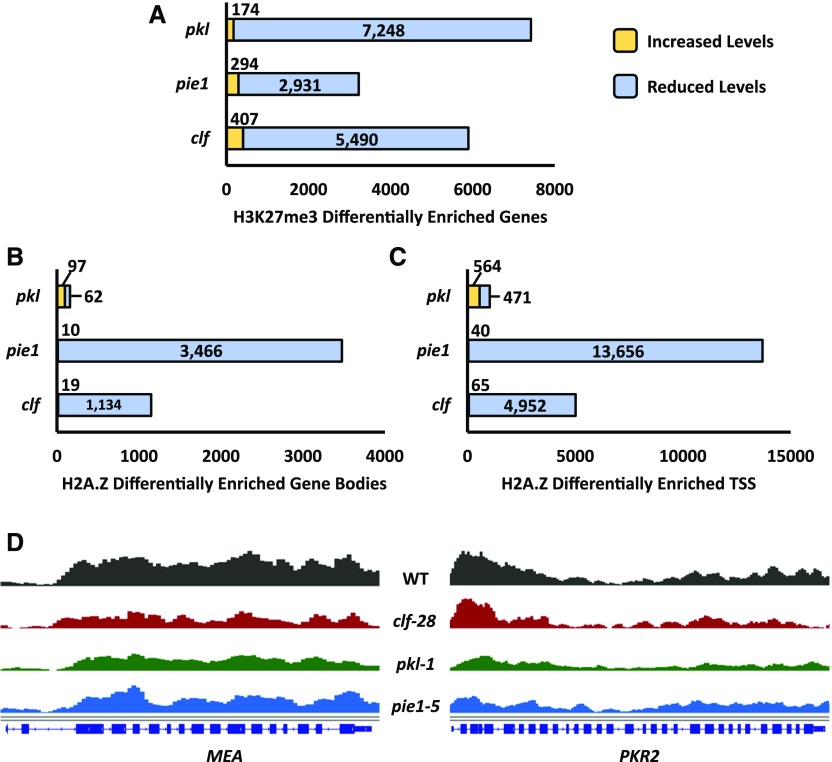
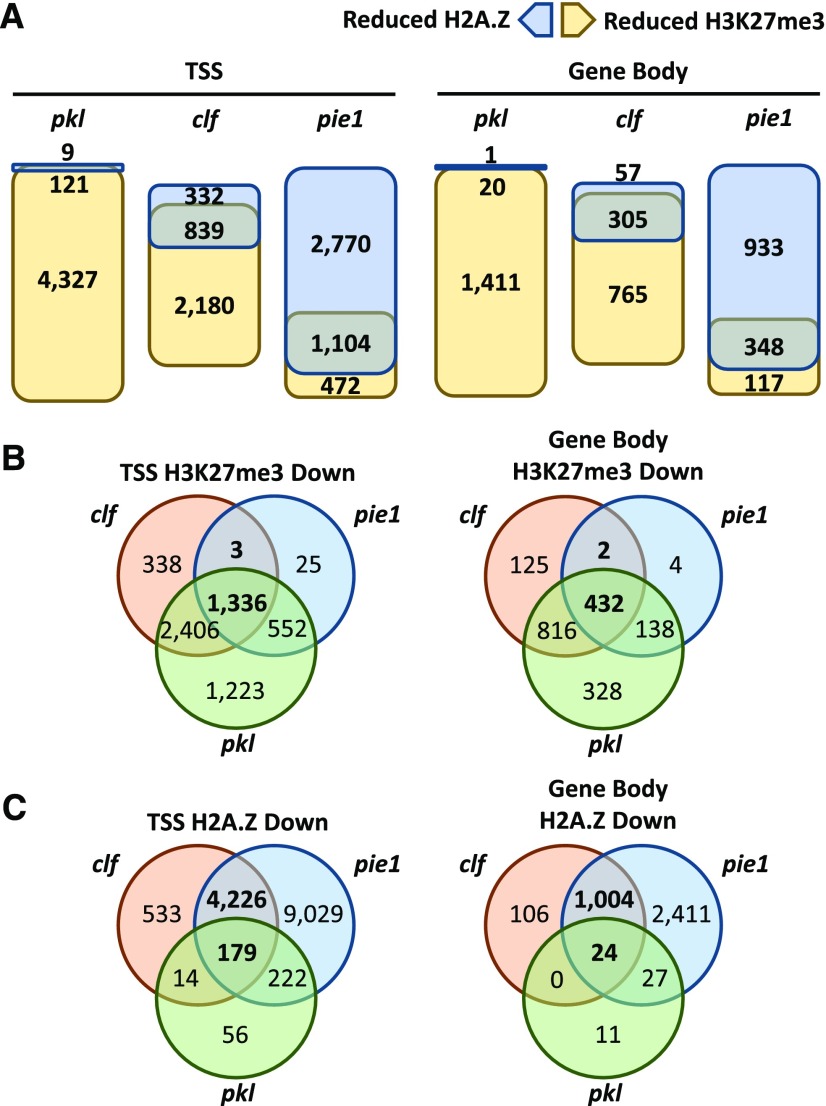
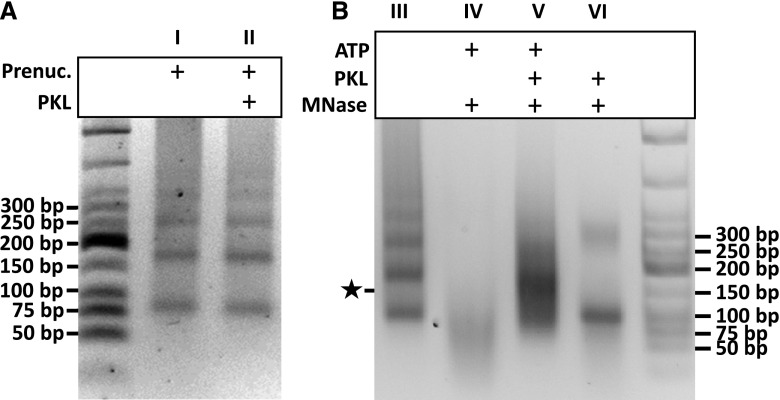
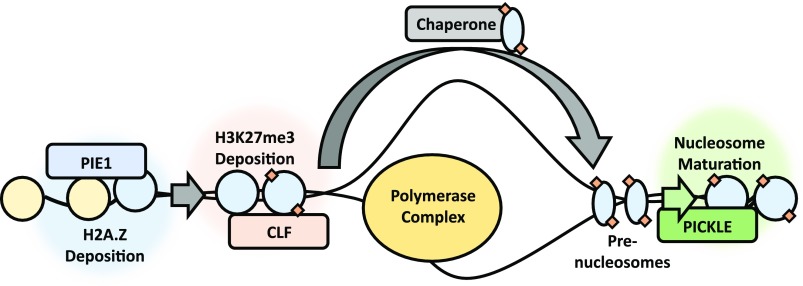
Selective, tissue-specific gene expression is facilitated by the epigenetic modification H3K27me3 (trimethylation of lysine 27 on histone H3) in plants and animals. Much remains to be learned about how H3K27me3-enriched chromatin states are constructed and maintained. Here, we identify a genetic interaction in Arabidopsis thaliana between the chromodomain helicase DNA binding chromatin remodeler PICKLE (PKL), which promotes H3K27me3 enrichment, and the SWR1-family remodeler PHOTOPERIOD INDEPENDENT EARLY FLOWERING1 (PIE1), which incorporates the histone variant H2A.Z. Chromatin immunoprecipitation-sequencing and RNA-sequencing reveal that PKL, PIE1, and the H3K27 methyltransferase CURLY LEAF act in a common gene expression pathway and are required for H3K27me3 levels genome-wide. Additionally, H3K27me3-enriched genes are largely a subset of H2A.Z-enriched genes, further supporting the functional linkage between these marks. We also found that recombinant PKL acts as a prenucleosome maturation factor, indicating that it promotes retention of H3K27me3. These data support the existence of an epigenetic pathway in which PIE1 promotes H2A.Z, which in turn promotes H3K27me3 deposition. After deposition, PKL promotes retention of H3K27me3 after DNA replication and/or transcription. Our analyses thus reveal roles for H2A.Z and ATP-dependent remodelers in construction and maintenance of H3K27me3-enriched chromatin in plants.


Figures

Figure 1.
Figure 1.
pkl-10 pie1-5 Seedlings Exhibit Profound Defects in Organogenesis. Seedlings were grown on MS medium under 24-h light and images were collected at 2 weeks of age. Background colors are desaturated for visual clarity. Bar = 2 mm. (A) Representative wild-type seedling. (B) Representative pkl-10 seedling exhibiting the characteristic reduced petiole length and rosette diameter. (C) Representative pie1-5 seedilng. (D) Representative pkl-10 pie1-5 seedling.
Figure 2.
Figure 2.
Summary of Differentially Expressed Genes. Total numbers of genes identified as differentially expressed relative to the wild type in the indicated samples. Gene sets corresponding to statistically significant increases in expression are shaded yellow, and those corresponding to significant decreases in expression are shaded blue. Differential expression was determined based on mean counts per million using the edgeR package with a Benjamini-Hochberg FDR threshold of <0.05 and a fold change threshold of ≥1.5-fold change relative to the wild type.
Figure 3.
Figure 3.
pkl, pie1, and clf Affect Expression of Common Sets of Genes. (A) and (B) Statistical analysis of intersections between sets of DEGs exhibiting increased (A) or decreased (B) expression in the indicated mutants relative to the wild type. Gene sets are ordered by size. y axes indicate the size of the indicated gene set (first three columns) or intersection in number of genes. Bars are shaded to reflect the P value of the intersection obtained using Fisher’s exact test with a null hypothesis of an intersection no greater than predicted by chance. Column end labels indicate the log(P value) for the indicated intersection. Data visualization was performed using the SuperExactTest package in Bioconductor (Wang et al., 2015). (C) to (E) Correlation between expression of DEGs in the indicated genotypes. Axes indicate fold change in expression relative to wild-type plants on a log2 scale. Green points represent genes that are differentially expressed in both genotypes, and gray points represent genes that are differentially expressed in one of the two genotypes. Dotted lines depict linear-fit trendlines of the stated R2 value calculated using common DEGs (green points). (F) and (G) Diagrams of the three-way intersections from (A) and (B). Numbers in parentheses indicate the size of the intersection predicted by chance (the product of the probabilities of a gene being in each group * population size).
Figure 4.
Figure 4.
H3K27me3 and H2A.Z Exhibit Coenrichment and Are Associated with Low Levels of Gene Expression. Genes enriched for H3K27me3 and H2A.Z were identified relative to H3 using SICER (Xu et al., 2014). (A) Diagrams of intersections between gene sets determined to be enriched for H3K27me3 or H2A.Z in the gene body relative to H3 in our analysis versus previously published analyses (Bouyer et al., 2011; Coleman-Derr and Zilberman, 2012). Gene body is defined as the central region of genes that remain after omitting the terminal 1000-bp ends from the TSS and the transcription termination site as annotated in the Araport11 reference genome. Genes shorter than 2.1 kb are thus excluded (Coleman-Derr and Zilberman, 2012). (B) Diagrams of intersections between genes enriched for H2A.Z and/or in H3K27me3 relative to H3 in the TSS (upper left) or in the gene body (lower right). TSS is defined as the first 500 bp (from base 0 to base +500) from the start of the mRNA sequence. Genes shorter than 500 bp are excluded. (C) Box-and-whisker plot depicting the distributions of gene expression for genes enriched in the gene body in varying combinations of H2A.Z and/or H3K27me3 as indicated. The y axis represents mRNA mean counts per million values in wild-type plants. Dashes indicate that all genes were included in the set regardless of enrichment status of the indicated mark.
Figure 5.
Figure 5.
H3K27me3 and H2A.Z Enrichment Patterns in the Wild Type, clf-28, pie1-5, and pkl-1. Enrichment visualizations generated using the deepTools2 package (Ramírez et al., 2016). Gene regions are scaled to 1 kb on the x axes. Samples were normalized using the RPKM method. Displayed genes are restricted to those that contain at least one region of enrichment of the relevant mark relative to H3 as determined by SICER. Data are representative of two independent biological replicates. (A) Heat maps of H3K27me3 enrichment in the indicated genetic backgrounds. (B) Metagene profile of average enrichment data from (A). (C) Heat maps of H2A.Z enrichment in the indicated genetic backgrounds. (D) Metagene profile of average enrichment data from (C).
Figure 6.
Figure 6.
Summary of Differentially Enriched Genes. (A) to (D) Summary of differentially enriched genes identified for each mutant line. Differential enrichment was determined relative to H3 using SICER-df (Xu et al., 2014). Differentially enriched gene sets were filtered to contain only genes identified as such in both of two biological replicates. (A) Summary of genes identified as differentially enriched relative to the wild type for H3K27me3. (B) Summary of genes identified as differentially enriched relative to the wild type for H2A.Z in the gene body. (C) Summary of genes identified as differentially enriched relative to the wild type for H2A.Z at the TSS. The gene body and TSS data sets are described in the Figure 4 legend. (D) Two representative H3K27me3-enriched genes that exhibit reduced levels of H3K27me3 in the indicated genetic backgrounds. Displayed bigwig tracks were normalized using the RPKM method of deepTools2 and visualized using IGV (Robinson et al., 2011). Data are representative of two independent biological replicates.
Figure 7.
Figure 7.
Intersection Analysis of Differentially Enriched Gene Sets. (A) Diagrams of intersections between gene sets exhibiting reduced levels of H3K27me3 and those exhibiting reduced levels of H2A.Z in the indicated mutant lines. Genes were limited to those enriched for both epigenetic marks for this analysis. (B) Venn diagrams depicting the intersections among gene sets exhibiting reduced H3K27me3 in the indicated mutant lines at the TSS (left) or in the gene body (right). (C) Venn diagrams depicting the intersections among gene sets exhibiting reduced H2A.Z in the indicated mutant lines at the TSS (left) or in the gene body (right).
Figure 8.
Figure 8.
PKL Converts Prenucleosomes into Canonical Nucleosomes. Prenucleosome maturation assay performed as described previously (Fei et al., 2015). Reaction products were deproteinated and fragments were analyzed using agarose gel electrophoresis. Bands were visualized using ethidium bromide. (A) Assembly of poly-prenucleosomal templates (Prenuc.) in the absence (lane I) or presence (lane II) of recombinant PKL. Mono-prenucleosomes were assembled as previously described (Fei et al., 2015), and poly-prenucleosomes were synthesized by ligating the mono-prenucleosomes using T4 DNA ligase and ATP. (B) Digestion of poly-prenucleosomal templates from panel A (lane III) with MNase, which spares DNA fragments rendered inaccessible due to occlusion by a nucleosome. Prior to digestion, samples were incubated in the absence or presence of recombinant PKL and/or ATP (lanes IV through VI). Generation of mature nucleosomes was assessed by the appearance of approximately 147-bp DNA fragments (indicated with a star) corresponding to the DNA occlusion length of the mature nucleosome core particle.
Figure 9.
Figure 9.
Model for H3K27me3 Deposition and Maintenance. Generation of H3K27me3-enriched chromatin is dependent on the prior action of PIE1 and H2A.Z. PKL acts subsequently to maintain this epigenetic state during DNA replication and/or transcription by facilitating nucleosome retention.
None

Similar articles

Cited by

References

    1. Aranda S., Mas G., Di Croce L. (2015). Regulation of gene transcription by Polycomb proteins. Sci. Adv. 1: e1500737. - PMC - PubMed
    1. Berriri S., Gangappa S.N., Kumar S.V. (2016). SWR1 chromatin-remodeling complex subunits and H2A.Z have non-overlapping functions in immunity and gene regulation in Arabidopsis. Mol. Plant 9: 1051–1065. - PMC - PubMed
    1. Bieluszewski T., Galganski L., Sura W., Bieluszewska A., Abram M., Ludwikow A., Ziolkowski P.A., Sadowski J. (2015). AtEAF1 is a potential platform protein for Arabidopsis NuA4 acetyltransferase complex. BMC Plant Biol. 15: 75. - PMC - PubMed
    1. Bolger A.M., Lohse M., Usadel B. (2014). Trimmomatic: a flexible trimmer for Illumina sequence data. Bioinformatics 30: 2114–2120. - PMC - PubMed
    1. Bouyer D., Roudier F., Heese M., Andersen E.D., Gey D., Nowack M.K., Goodrich J., Renou J.P., Grini P.E., Colot V., Schnittger A. (2011). Polycomb repressive complex 2 controls the embryo-to-seedling phase transition. PLoS Genet. 7: e1002014. - PMC - PubMed

Publication types

MeSH terms