. 2018 Jun;30(6):1220-1242.
doi: 10.1105/tpc.18.00153. Epub 2018 May 25.

Response to Persistent ER Stress in Plants: A Multiphasic Process That Transitions Cells from Prosurvival Activities to Cell Death

Affiliations

Response to Persistent ER Stress in Plants: A Multiphasic Process That Transitions Cells from Prosurvival Activities to Cell Death

Renu Srivastava et al. Plant Cell. 2018 Jun.

Abstract

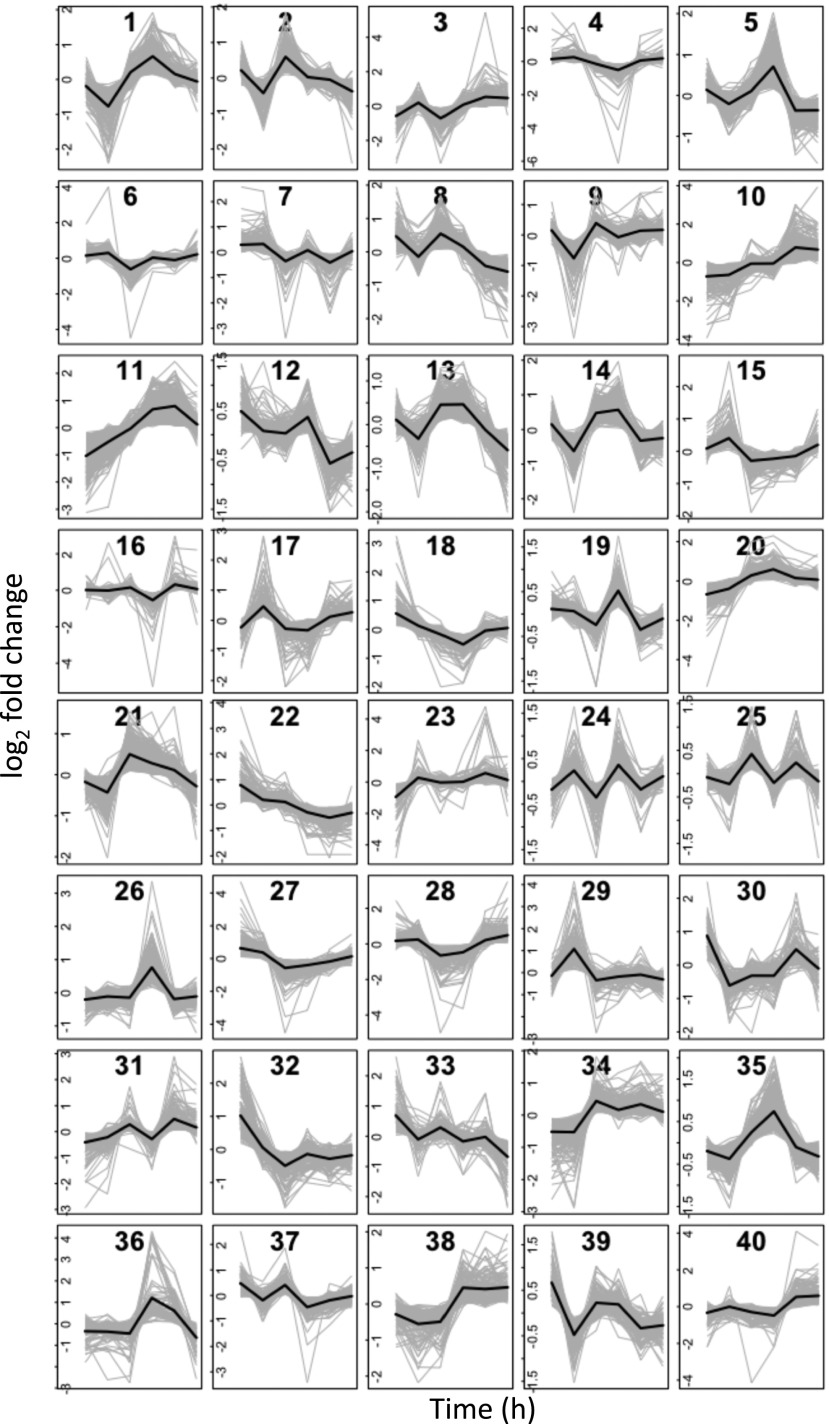
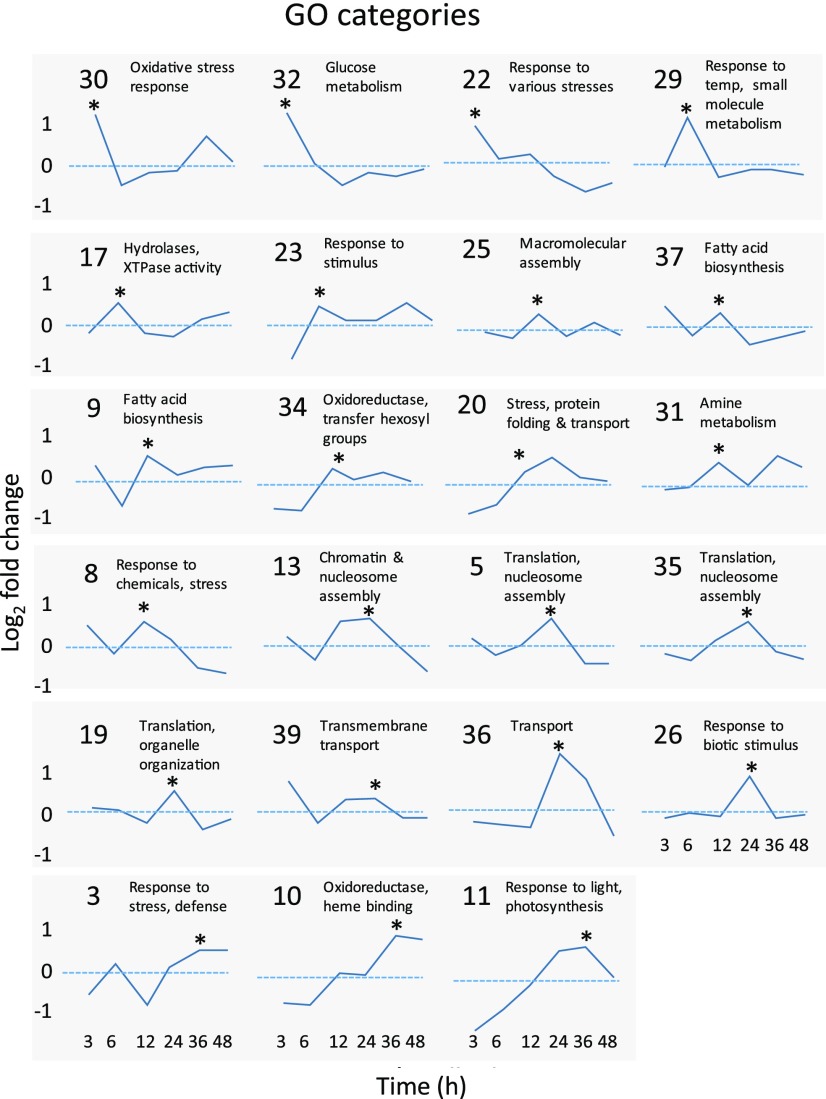
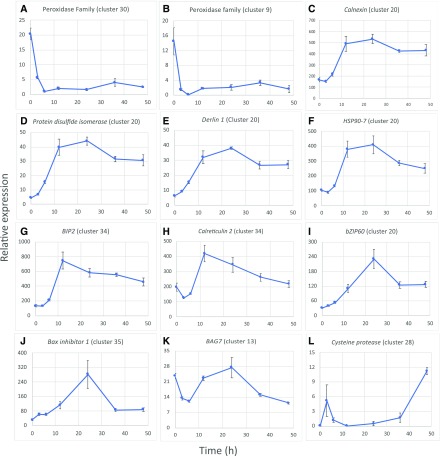
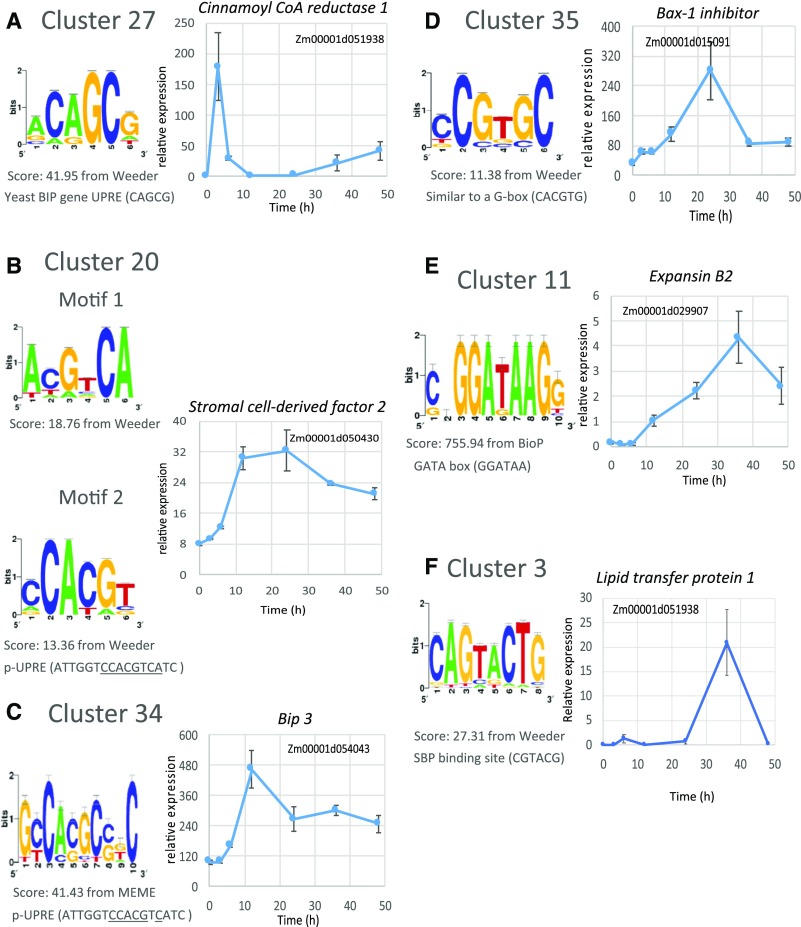
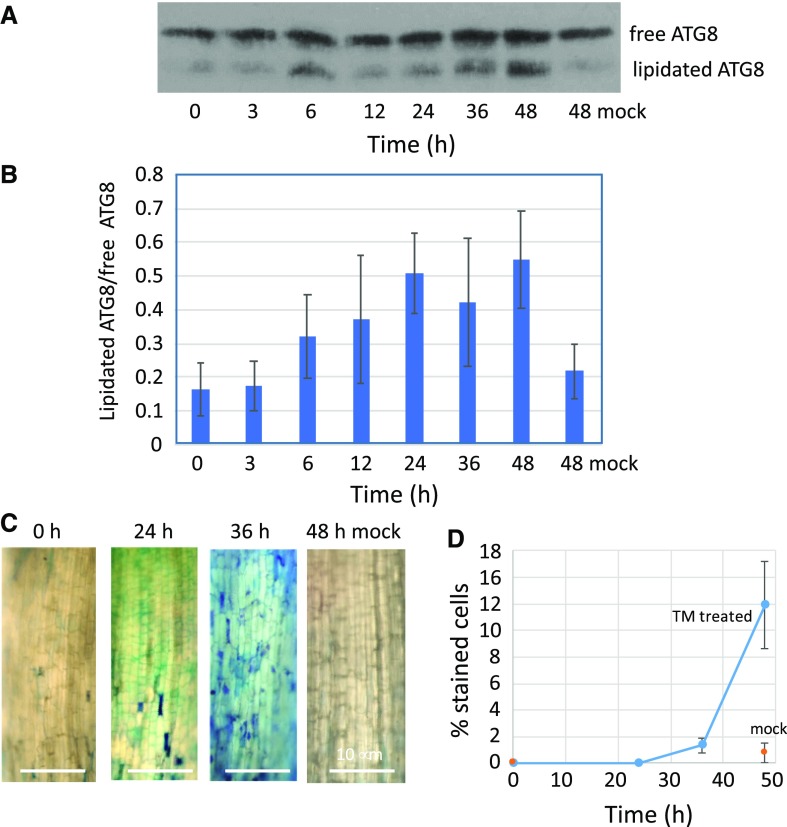
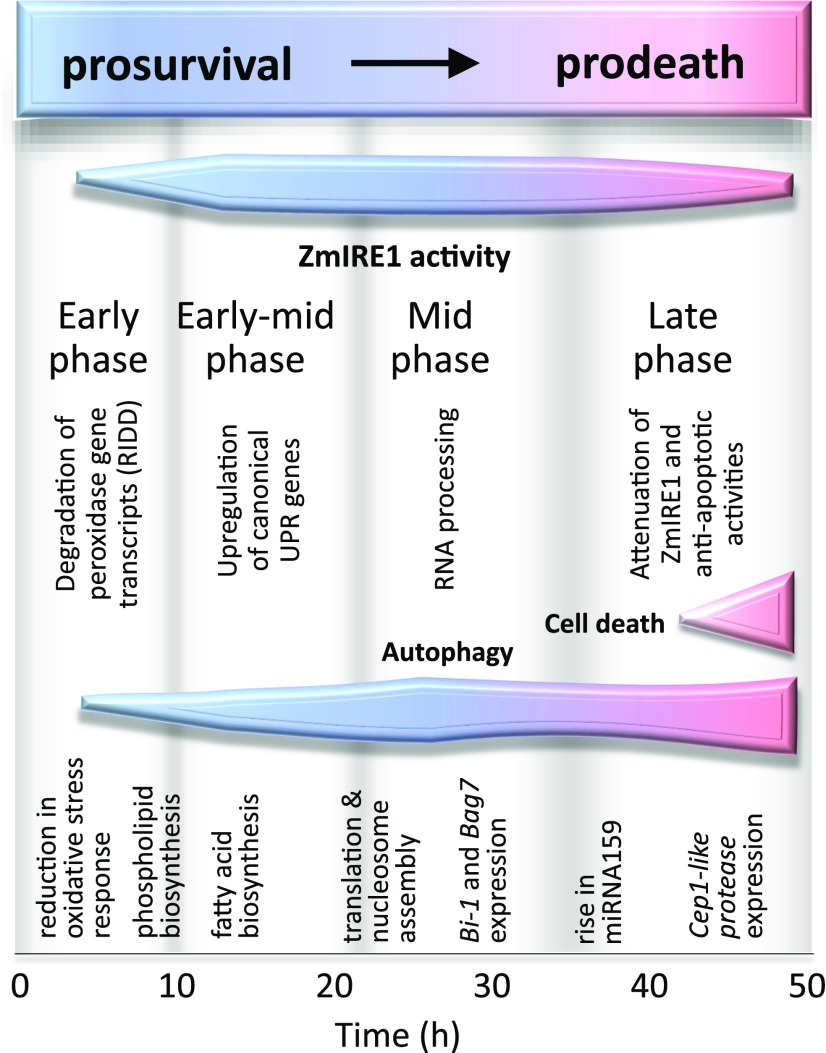
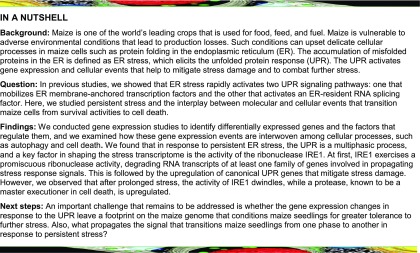
The unfolded protein response (UPR) is a highly conserved response that protects plants from adverse environmental conditions. The UPR is elicited by endoplasmic reticulum (ER) stress, in which unfolded and misfolded proteins accumulate within the ER. Here, we induced the UPR in maize (Zea mays) seedlings to characterize the molecular events that occur over time during persistent ER stress. We found that a multiphasic program of gene expression was interwoven among other cellular events, including the induction of autophagy. One of the earliest phases involved the degradation by regulated IRE1-dependent RNA degradation (RIDD) of RNA transcripts derived from a family of peroxidase genes. RIDD resulted from the activation of the promiscuous ribonuclease activity of ZmIRE1 that attacks the mRNAs of secreted proteins. This was followed by an upsurge in expression of the canonical UPR genes indirectly driven by ZmIRE1 due to its splicing of Zmbzip60 mRNA to make an active transcription factor that directly upregulates many of the UPR genes. At the peak of UPR gene expression, a global wave of RNA processing led to the production of many aberrant UPR gene transcripts, likely tempering the ER stress response. During later stages of ER stress, ZmIRE1's activity declined, as did the expression of survival modulating genes, Bax inhibitor1 and Bcl-2-associated athanogene7, amid a rising tide of cell death. Thus, in response to persistent ER stress, maize seedlings embark on a course of gene expression and cellular events progressing from adaptive responses to cell death.


Figures

Figure 1.
Figure 1.
Gene Expression Patterns in Response to Persistent ER Stress. Differentially expressed genes during the 48-h time course of treatment of maize seedlings with TM were clustered using a K-means algorithm with Pearson correlation-based distance for the treated samples. The gray lines correspond to the gene expression patterns estimated by scaled model-based log2 fold change for each time point compared with time 0 h, and the black lines plot the centroid gene expression pattern. Data for each time point were obtained from three biological replicates, each analyzed in two technical replicates.
Figure 2.
Figure 2.
Categories of Gene Expression Patterns in Response to Persistent ER Stress and Major GO Terms. Blue line represents log2 fold change for each time point during TM-induced ER stress in maize seedlings compared with zero time and is the centroid for the gene expression patterns from Figure 1. The clusters shown are those with significantly enriched GO terms obtained from AgriGO (http://bioinfo.cau.edu.cn/agriGO/). The clusters have been time ordered by the appearance of the first major peak (marked with an asterisk) or by first major increment in gene expression.
Figure 3.
Figure 3.
Expression Patterns of Individual Genes during the UPR. RPKM (reads per kilobase million) values from the RNA-seq analysis are plotted against time of treatment with TM. Expression patterns of genes from selected clusters. (A) and (B) Peroxidase family gene Zm00001d022282 from cluster 30 (A) and Zm00001d006937 from cluster 9 (B). (C) to (F) UPR genes from cluster 20: Calnexin 1 (Zm00001d003857) (C), Protein disulfide isomerase (Zm00001d005866) (D), Derlin-1 (Zm00001d010368) (E), and Hsp90-7 (Zm00001d036401) (F). (G) and (H) UPR genes found in cluster 34: Binding protein2 (Bip2) (Zm00001d014993) (G) and Calreticulin 2 (Zm00001d019283) (H). (I) to (L) Additional genes of interest are Zmbzip60 (Zm00001d046718) from cluster 20 (I), Bax inhibitor1 (Bi-1, Zm00001d015091) from cluster 35 (J), Bcl-2 associated anthanogene7 (Bag7, Zm00001d045596) from cluster 13 (K), and a cysteine protease gene (Zm00001d007049) from cluster 28 (L). Error bars = se. For each time point, n = 6, except for the 24-h time point in which n = 5.
Figure 4.
Figure 4.
Upstream Sequence Motifs for Genes in Different Clusters. Panels show (left to right) sequence motifs for different gene clusters and the gene expression pattern of a representative gene from the cluster. (A) Upstream sequence motifs for some of the earliest genes such as Cinnamoyl COA reductase 1 (Zm00001d051938) in cluster 27. Upstream regions (500 bp) of genes with q-values < 9.9E-05 from the RNA-seq analysis were analyzed for common sequence motifs using Promzea. A mean normalized conditional probability score of >1 indicates that the sequences 5ʹ to the transcription start site are enriched for that motif compared with the upstream sequences of randomly selected genes. The sequence motifs for cluster 27 are similar to the core sequences in the yeast UPRE (CAGCG) (Mori et al., 1992). (B) Upstream regions for the genes in cluster 20 such as Stromal cell-derived factor (Zm00001d050430) are enriched for CCACGTCA sequences similar to the core sequences in the p-UPRE (ATTGGTCCACGTCATC) (Oh et al., 2003; Iwata and Koizumi, 2005b; Tajima et al., 2008). (C) Most frequent upstream sequence motif for the top genes in cluster 34 from the RNA-seq analysis (q-values < 1.0E-07, including Bip3 Zm00001d054043) is also similar to the core p-UPRE. (D) and (E) Many of the genes in cluster 35 (D) including Bax-1 inhibitor (Zm00001d050430) share a common upstream motif (CGTG) that is similar to a G-box, while the genes in cluster 11 (E), such as Expansin B2 (Zm00001d029907), have sequence motifs (GGATAAG) similar to GATA boxes. (F) The genes in cluster 3, expressed late in the time course such as Lipid transfer protein 1 (Zm00001d029907), bear GTAC sequences in their upstream regions similar to squamosa binding protein sites (CGTACG). Error bars = se.
Figure 5.
Figure 5.
Genes with Promoters to Which ZmbZIP60 or ZmbZIP17 Bind. ChIPseq analysis in maize seedling leaf mesophyll protoplasts was used to identify genes to which GFP-ZmbZIP60ΔC or GFP-ZmbZIP17ΔC bind within 500 bp of the start of transcription. Genes are rank ordered in terms of peak score (-log10 q-value), annotated using version 4 and classified by cluster. Expression patterns in the appended heat map show normalized counts from the RNA-seq analysis.
Figure 6.
Figure 6.
Open Chromatin Regions in UPR Genes in Cluster 20. ATACseq analysis was conducted on 10-d-old B73 maize seedling roots at time 0, 6, and 12 h of TM treatment, and the frequency of DNA fragment counts from the ATACseq analysis was plotted versus genomic position. Sar1 (Zm00001d049068) (A), Hsp90-7, Shepherd (Zm00001d036401) (B), Derlin-1 (Zm00001d010368) (C), and Calnexin 1 (Zm00001d003857) (D) are typical UPR genes and are strongly upregulated from 6 to 12 h after the initiation of TM treatment. A region 500 bp upstream from the gene was boxed to highlight the changes in openness (accessibility to Tn5 transposase) of the promoter region in response to ER stress. Numbers within the box are a summation of the normalized counts within that interval.
Figure 7.
Figure 7.
Expression Pattern of miR529 and Its Target Genes. Relative expression pattern for miR529 following TM treatment. Expression patterns for predicted targets of miR529, genes encoding SBPs. Sbp14 (Zm00001d020941) (A), Sbp17 (Zm00001d052890) (B), and Sbp23 (Zm00001d006028) (C). Dashed lines in (B) to (D) represent the peak time point for miR529 as shown in (A). Bars = se. For each time point, n = 6, except for the 24-h time point.
Figure 8.
Figure 8.
RNA Processing of Selected UPR Genes. Expression profiles from the RNA-seq analysis are shown for alternatively spliced UPR genes in which at least one RNA isoform showed the greatest differential between two time points. Isoforms differed when one or more exons (or part of an exon) was missing. (A) Left panel: Expression pattern for the individual RNA isoforms of Bip2 (Zm00001d014993). Right panel: Gene models for the various isoforms of Bip2 taken from EnsemblPlants (https://plants.ensembl.org/index.html). (B) Left panel: Expression pattern for the RNA isoforms of Pdil-1 (Zm00001d049099). Right panel: Gene models for the various isoforms of Pdil-1. (C) Left panel: Expression pattern for the RNA isoforms for Calreticulin 1a (Zm00001d019283). Right panel: Gene models for the various isoforms of Calreticulin 1a.
Figure 9.
Figure 9.
Autophagy and Cell Death. (A) Immunoblot of root proteins extracted at various times following treatment of maize seedlings with 5 μg/mL TM, including a mock treatment at 48 h. Blots were probed with antibodies against ATG8. (B) Ratio of lipidated ATG8 versus free ATG8 at various times as assessed by Image J analysis (https://imagej.nih.gov) of immunoblots as in (A). Mean values from three biological replicates are shown. Error bars = se. (C) Maize seedlings were treated with TM as above for various times and then stained with the vital dye Evans blue. Bar = 10 μm. (D) Root epidermal cells were examined by light microscopy and the number of stained versus unstained cells in 100 μm2 were plotted to determine the frequency of cell death. Error bars = se, n = 5.
Figure 10.
Figure 10.
Phases during Persistent ER Stress Involving Major Gene Expression and Cellular and Metabolic Events. In response to persistent ER stress induced by the treatment of maize seedlings with TM, cells transition from prosurvival stages to cell death. The program of gene expression and cellular events is multiphasic, characterized by the onset of RIDD, upregulation of UPR genes, period of intense RNA processing, and induction of antiapoptotic activities. Overlying the various phases is the activity pattern of ZmIRE1, which influences many of the cellular and gene expression events, and autophagy, which may play a role in both prosurvival activities and cell death.
None

Similar articles

Cited by

References

    1. Amin-Wetzel N., Saunders R.A., Kamphuis M.J., Rato C., Preissler S., Harding H.P., Ron D. (2017). A J-protein co-chaperone recruits BiP to monomerize IRE1 and repress the unfolded protein response. Cell 171: 1625–1637. - PMC - PubMed
    1. Anders S., Reyes A., Huber W. (2012). Detecting differential usage of exons from RNA-seq data. Genome Res. 22: 2008–2017. - PMC - PubMed
    1. Anderson P., Kedersha N. (2002). Stressful initiations. J. Cell Sci. 115: 3227–3234. - PubMed
    1. Arimoto K., Fukuda H., Imajoh-Ohmi S., Saito H., Takekawa M. (2008). Formation of stress granules inhibits apoptosis by suppressing stress-responsive MAPK pathways. Nat. Cell Biol. 10: 1324–1332. - PubMed
    1. Arimoto-Matsuzaki K., Saito H., Takekawa M. (2016). TIA1 oxidation inhibits stress granule assembly and sensitizes cells to stress-induced apoptosis. Nat. Commun. 7: 10252. - PMC - PubMed

Publication types

MeSH terms