. 2018 May 25;8(1):8125.
doi: 10.1038/s41598-018-25991-8.

Developmental temperature has persistent, sexually dimorphic effects on zebrafish cardiac anatomy

Affiliations

Developmental temperature has persistent, sexually dimorphic effects on zebrafish cardiac anatomy

Anastasia Dimitriadi et al. Sci Rep. .

Abstract

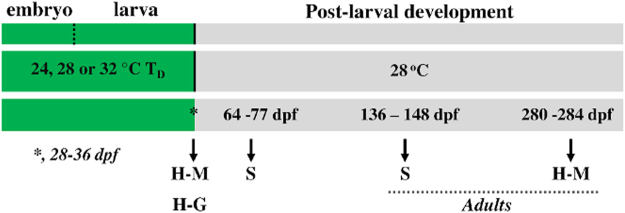
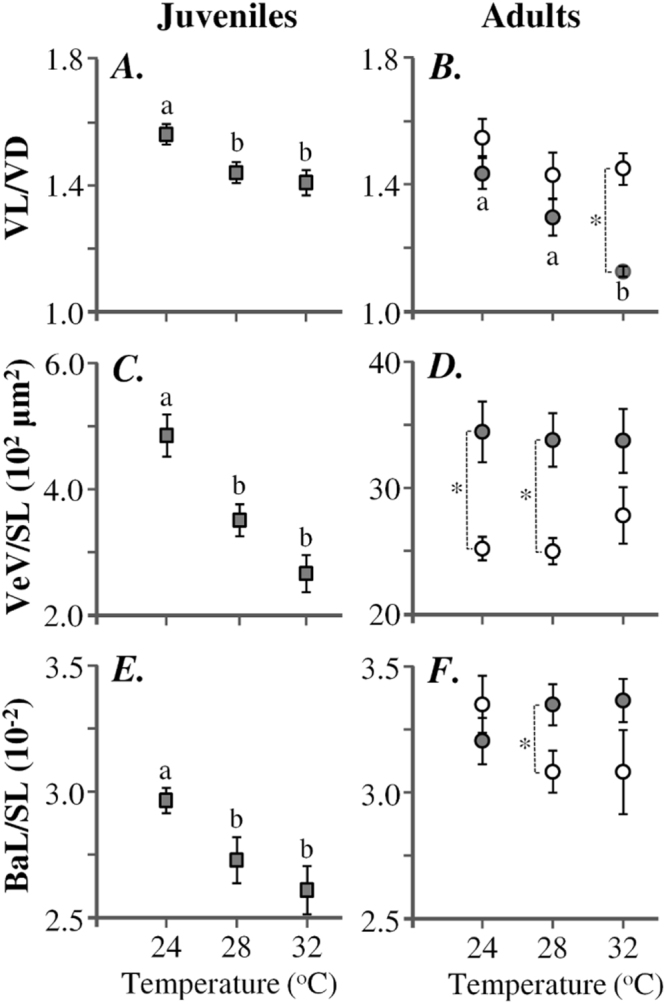
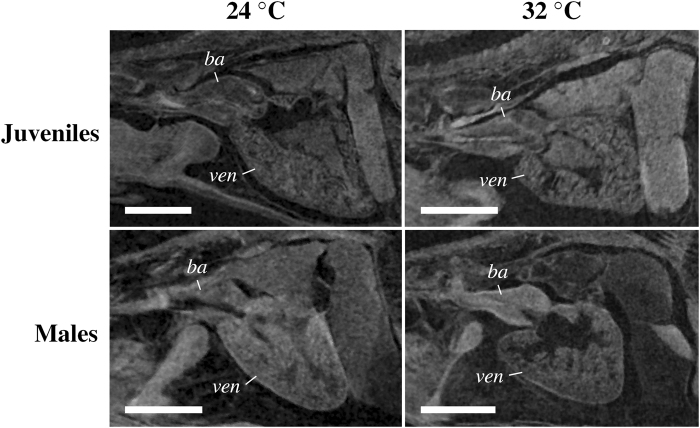
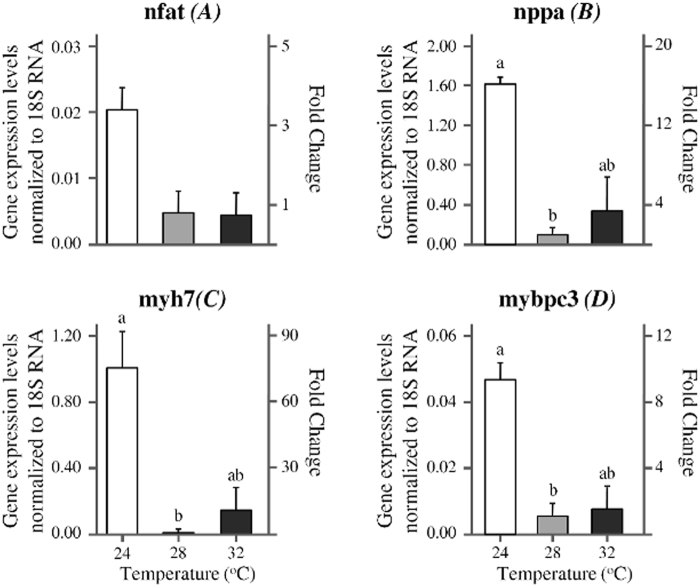
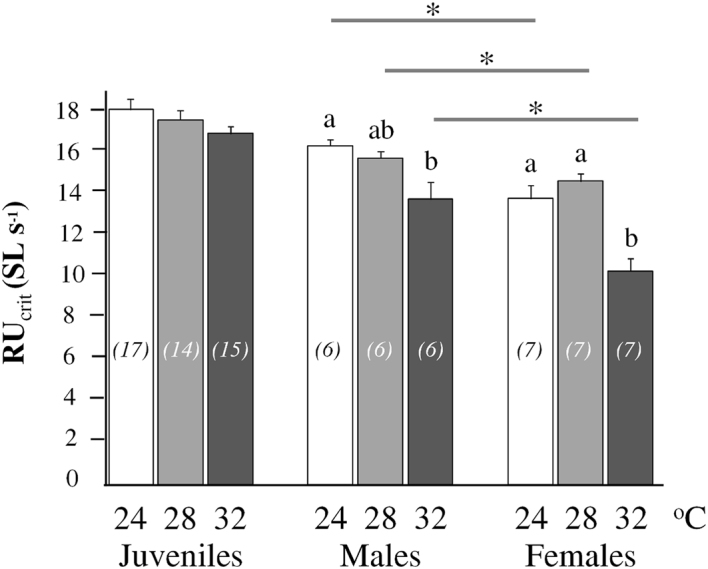
Over the next century, climate change of anthropogenic origin is a major threat to global biodiversity. We show here that developmental temperature can have significant effects on zebrafish cardiac anatomy and swimming performance. Zebrafish embryos were subjected to three developmental temperature treatments (TD = 24, 28 or 32 °C) up to metamorphosis and then all maintained under common conditions (28 °C) to adulthood. We found that developmental temperature affected cardiac anatomy of juveniles and adults even eight months after the different thermal treatments had been applied. The elevation of TD induced a significant increase of the ventricle roundness in juvenile (10% increase) and male (22% increase), but not in female zebrafish. The aerobic exercise performance of adult zebrafish was significantly decreased as TD elevated from 24 to 32 °C. Gene expression analysis that was performed at the end of the temperature treatments revealed significant up-regulation of nppa, myh7 and mybpc3 genes at the colder temperature. Our work provides the first evidence for a direct link between developmental temperature and cardiac form at later life-stages. Our results also add to the emerging rationale for understanding the potential effects of global warming on how fish will perform in their natural environment.


Conflict of interest statement

The authors declare no competing interests.

Figures

Figure 1
Figure 1
Experimental design of the study. Fish were subjected to one of three developmental temperature (TD) treatments up to metamorphosis (*) and then at a common temperature till adulthood. Transcriptomic analysis of the heart (H-G) was performed 1 d before the transfer of the fish to the same temperature. Morphometric analysis of the heart (H-M) was performed 1 d before the transfer of the fish to the same temperature (early juveniles) and at the adult stage (9–10 months later). Swimming performance (S) was measured 4 weeks after the transfer of the fish to the same temperature (late juveniles) and at the adult stage (3–4 months later). TD, developmental temperature; dpf, days after fertilization.
Figure 2
Figure 2
Multiple views from a single scan of an adult zebrafish. (A) Representative oblique slice defined by three landmarks (anterior and posterior end of the bulbus arteriosus, the centre of the 1st vertebra). (B) Inset of Fig. 2A, showing the ventricle (ven), bulbus arteriosus (ba), as well as the distance measurements taken. (C) Three-dimensional volume rendering of the bulbus arteriosus (purple) and ventricle (green). V, first vertebra. ba, bulbus arteriosus. ven, ventricle. Landmark 1, bulbus junction with the first branchial arch. Landmark 2, ventricle – bulbus valve. Landmark 3, ventricle apex. Landmarks 4 and 5 define the widest distance of the ventricle, perpendicularly to ventricle length (D2–3). D1–2, Bulbus-arteriosus length (BaL); D2–3, Ventricle length (VL); D4–5, maximum ventricle depth (VD), perpendicular to VL.
Figure 3
Figure 3
Changes in early juvenile and adult cardiac anatomy in response to developmental temperature. Cardiac morphometric indices in males (filled circles, n = 7–9), females (open circles, n = 7–9) and early juveniles (squares, n = 8–15) of different treatment groups. (A,B) Ventricle length-to-depth ratio, (C,D) ventricle volume normalized to standard length, (E,F) bulbus arteriosus length normalized to standard length. BaL, bulbus arteriosus length. SL, standard length. VD, ventricle depth. VL, ventricle length. VeV, ventricle volume. Values without a letter in common are statistically different (p < 0.05, Kruskal-Wallis and Mann-Whitney U test). Asterisks indicate significant statistical differences (p < 0.05, Mann-Whitney U test) between males and females of the same treatment. Error bars equal to ± 1 SEM.
Figure 4
Figure 4
Representative primary images showing the comparatively more round ventricle in juvenile and male zebrafish reared at 32 °C developmental temperature (TD). Scale bars equal to 0.25 (juveniles) or 1.0 mm (males). ba, bulbus arteriosus. ven, ventricle.
Figure 5
Figure 5
Effect of developmental temperature on the relative gene expression levels (mRNA). (A) Nuclear factor of activated T cells (nfatc1), (B) natriuretic peptide precursor a (nppa), (C) myosin heavy chain 7 (myh7) and (D) myosin binding protein C (mybpc3) in juvenile zebrafish at the end of the thermal treatment application. Expression levels were measured by real-time PCR using SYBR green and normalized to 18S RNA internal reference gene. Fold change is relative to 28 °C controls. n equals to 4, 4 and 3 for 24, 28 and 32 °C group respectively. Values without a letter in common are statistically different (p < 0.05, Kruskal-Wallis and Mann-Whitney U test). Error bars equal to 1 SEM.
Figure 6
Figure 6
Effect of developmental temperature on the aerobic swimming performance of zebrafish. Mean RUcrit was measured in late juveniles (n = 15–17), males (n = 6) and females (n = 7) of different treatment groups. Values without a letter in common are statistically different (p < 0.05, Kruskal-Wallis and Mann-Whitney U test). Asterisks indicate significant statistical differences between males and females of the same developmental temperature (p < 0.05, Mann-Whitney U test). Error bars equal to 1 SEM.

Similar articles

Cited by

References

    1. Somero GN. The physiology of climate change: how potentials for acclimatization and genetic adaptation will determine ‘winners’ and ‘losers’. J Exp Biol. 2010;213:912–920. doi: 10.1242/jeb.037473. - DOI - PubMed
    1. Poloczanska ES, et al. Global imprint of climate change on marine life. Nat Clim Change. 2013;3:919–925. doi: 10.1038/nclimate1958. - DOI
    1. Schulte PM, Healy TM, Fangue NA. Thermal performance curves, phenotypic plasticity, and the time scales of temperature exposure. Integr Comp Biol. 2011;51:691–702. doi: 10.1093/icb/icr097. - DOI - PubMed
    1. Thomas CD, et al. Extinction risk from climate change. Nature. 2004;427:145–148. doi: 10.1038/nature02121. - DOI - PubMed
    1. Heller NE, Zavaleta ES. Biodiversity management in the face of climate change: A review of 22 years of recommendations. Biol Conserv. 2009;142:14–32. doi: 10.1016/j.biocon.2008.10.006. - DOI

Publication types

LinkOut - more resources