. 2018 May 25;9(1):2066.
doi: 10.1038/s41467-018-04336-z.

Fibrotic microtissue array to predict anti-fibrosis drug efficacy

Affiliations

Fibrotic microtissue array to predict anti-fibrosis drug efficacy

Mohammadnabi Asmani et al. Nat Commun. .

Abstract

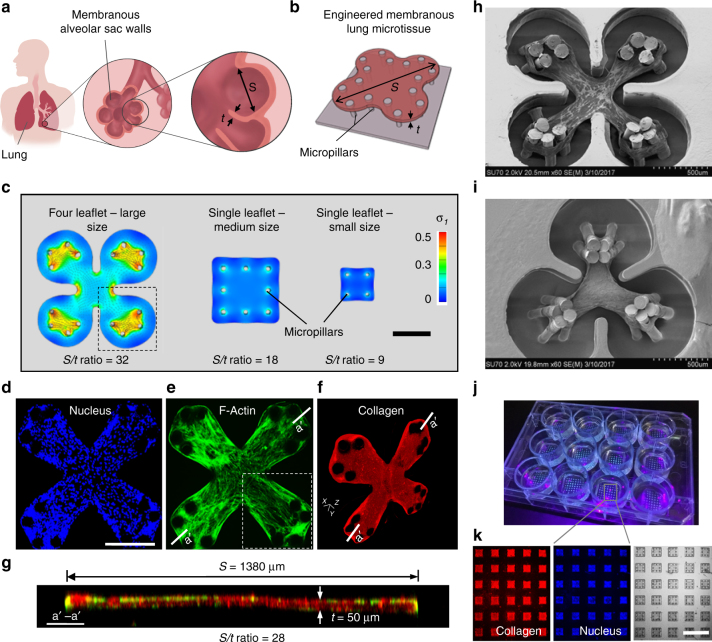
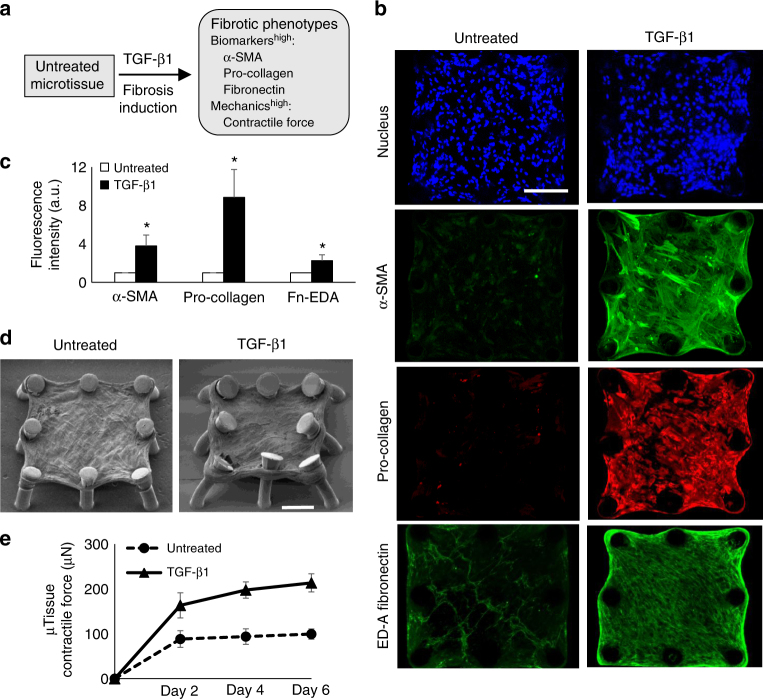
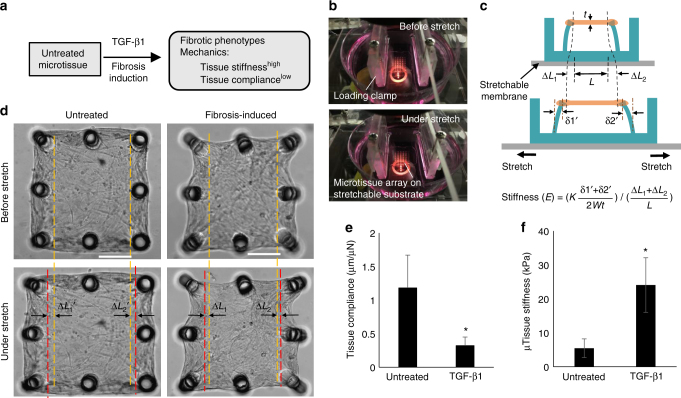
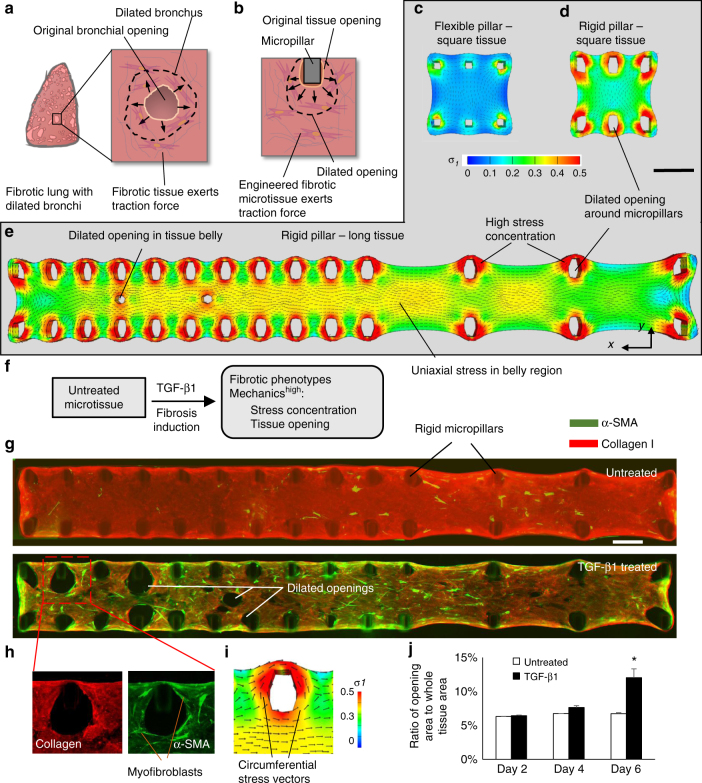
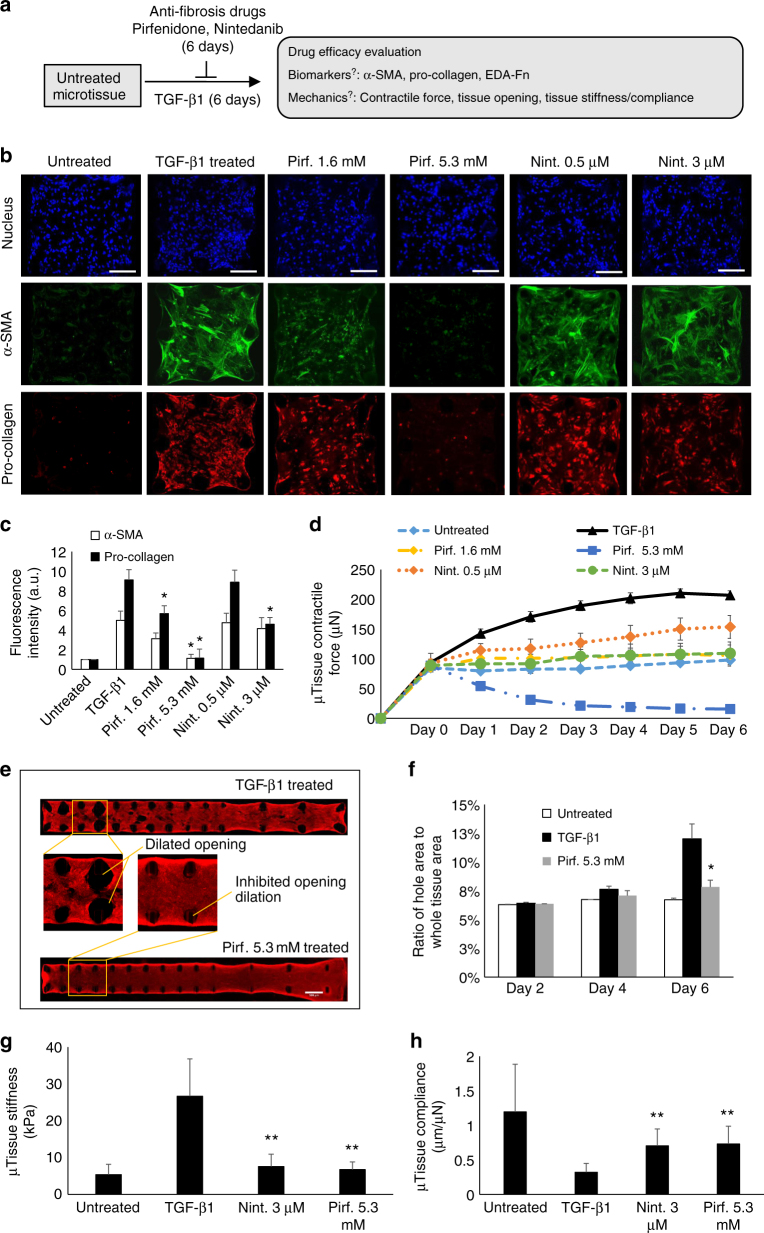
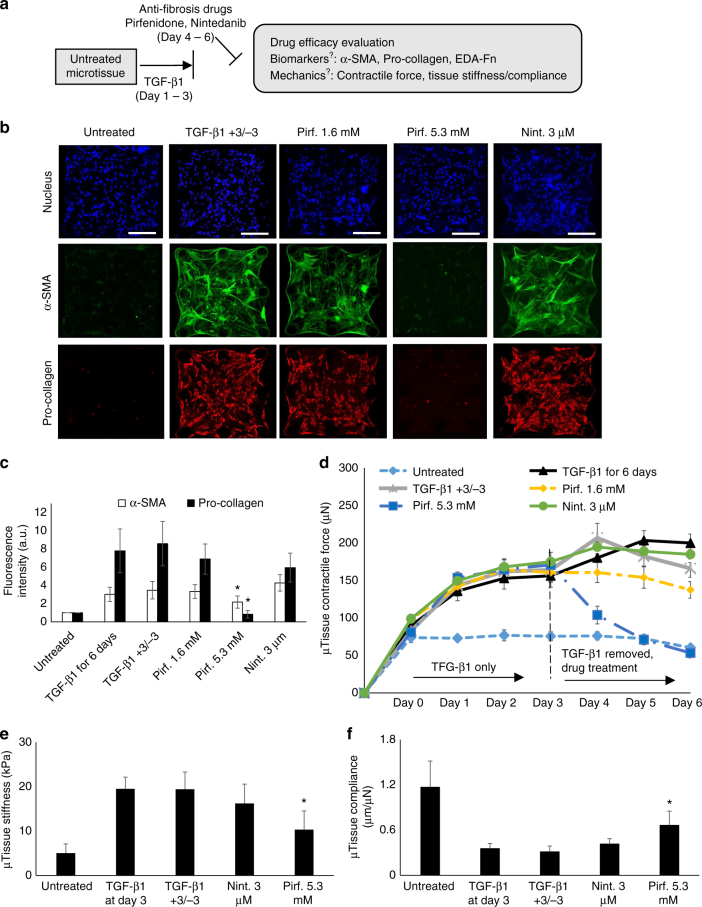
Fibrosis is a severe health problem characterized by progressive stiffening of tissues which causes organ malfunction and failure. A major bottleneck in developing new anti-fibrosis therapies is the lack of in vitro models that recapitulate dynamic changes in tissue mechanics during fibrogenesis. Here we create membranous human lung microtissues to model key biomechanical events occurred during lung fibrogenesis including progressive stiffening and contraction of alveolar tissue, decline in alveolar tissue compliance and traction force-induced bronchial dilation. With these capabilities, we provide proof of principle for using this fibrotic tissue array for multi-parameter, phenotypic analysis of the therapeutic efficacy of two anti-fibrosis drugs recently approved by the FDA. Preventative treatments with Pirfenidone and Nintedanib reduce tissue contractility and prevent tissue stiffening and decline in tissue compliance. In a therapeutic treatment regimen, both drugs restore tissue compliance. These results highlight the pathophysiologically relevant modeling capability of our novel fibrotic microtissue system.


Conflict of interest statement

The authors declare no competing interests.

Figures

Fig. 1
Fig. 1
Development of arrays of membranous lung microtissues. a The lung alveolar sac wall features large surface area and small tissue thickness, which is characterized by the high span length (S) to thickness (t) ratio. b Engineered lung microtissues were developed to model the membranous morphology of the alveolar sac wall. c Finite element (FE) models were developed to study the effects of microtissue geometry and size on the evolution of contractile stress during microtissue formation. First principal stress contour was plotted on deformed microtissue geometry with overlaid plot of stress vectors, where applicable. Scale bar is 500 µm. Representative 2D-projected fluorescent confocal images of an experimentally-created four-leaflet lung microtissue stained for nucleus (d) and F-actin (e). Note highlighted area shows highly aligned F-actin stress fibers running along the diagonal axis of the microtissue, matching with the direction of the principal stress in highlighted area in c. Scale bar in d is 500 µm. f 3D isometric view of the same microtissue stained for collagen type-I. g Merged fluorescent cross-sectional view (F-actin and collagen type-I) taken at a′–a′ plane of the four-leaflet microtissue showing S/t ratio of 28, corresponding well to alveolar sac geometry. SEM images of a four leaflet (h) and a three leaflet (i) human lung fibroblast-populated microtissue. j Arrays of square lung microtissues were integrated into a 12-well plate to enable parallel testing of multiple pharmacological conditions. Bright spots in each well correspond to individual microtissues. k Immunofluorescence imaging of the microtissue array allowed multi-parameter, phenotypic analysis of the drug efficacy. Scale bar is 3 mm
Fig. 2
Fig. 2
Recapitulation of tissue fibrogenesis in lung microtissues. a Overview of the strategy for fibrosis induction and evaluation based on the measurements of biomarker expression and tissue contractile force. b Continuous TGF-β1 treatment induced strong expressions of α-SMA stress fibers, cytosolic pro-collagen, and EDA-Fibronectin (Fn) in lung fibroblast-populated microtissue, as illustrated by representative fluorescent confocal images. c Fluorescence intensity levels of α-SMA, pro-collagen, and EDA-Fibronectin in TGF-β1-treated and untreated microtissues. d SEM images of an untreated and a TGF- β1-treated microtissue. Significant micropillar deflection caused by elevated tissue contraction can be seen in TGF- β1-treated microtissue. e Time-lapsed microtissue contractile force measurement. Contractile force of TGF-β1-treated samples nearly doubled that of untreated samples at every time point over a 6 day period. Data are reported as the mean ± SD. n ≥ 10; *P < 0.001 when compared to untreated condition by one-way ANOVA with Tukey test. Scale bar is 200 µm
Fig. 3
Fig. 3
Modeling fibrotic tissue stiffening in lung microtissues. a Overview of the strategy for fibrosis induction and evaluation based on the measurement of tissue stiffness and compliance. b Mechanical stretching of the membranous microtissue mimics the respiratory distention of the alveolar sac walls. Top: unstretched microtissue array was bonded to a transparent stretchable substrate, which was mounted on a loading frame directly above microscope objective. Bottom: microtissue array under stretch. c Schematic shows the principle of tissue stiffness measurement. d Phase contrast images of microtissues before and under stretching. Stretch-induced extension of TGF-β1-treated microtissue (ΔL1 + ΔL2) was much less than that of untreated microtissue (ΔL1′ + ΔL2′), indicating reduced compliance for TGF-β1-treated samples. e Plot of microtissue compliance shows a substantial decline in the compliance in TGF-β1-treated microtissues as compared to untreated microtissues. f Plot of microtissue stiffness shows much higher stiffness developed in TGF-β1-treated microtissues as compared to untreated microtissues. Data are reported as the mean ± SD. n ≥ 10; *P < 0.001 when compared to untreated condition by one-way ANOVA with Tukey test. Scale bar is 200 µm
Fig. 4
Fig. 4
Modeling the biomechanics of traction bronchiectasis. a Schematic shows the formation of numerous cystic airspaces in the fibrotic lung interstitium due to traction force-induced bronchial dilation. b The bronchial dilation was modeled through inducing the dilation of tissue openings in engineered fibrotic microtissues. FE simulated first principal stress distribution of a square microtissue supported by flexible micropillars (c), a square microtissue supported by rigid micropillars (d) and a long microtissue supported by rigid micropillars (e). Note high stress concentration around the micropillars in d and e induced dilation of the tissue opening. f Overview of the strategy for fibrosis induction in long microtissue and fibrosis evaluation based on the measurement of stress concentration and tissue opening size. g Merged immunofluorescence images of α-SMA and collagen type-I of untreated and TGF-β1-treated long microtissues. Apparent dilation of openings around micropillars and in the belly region can be observed in TGF-β1-treated condition. Scale bar is 500 µm. h Enlarged views of collagen type-I and α-SMA of highlighted region in g. α-SMA positive myofibroblasts aligned circumferentially around the dilated openings, matched well with the direction of simulated principal stress vectors (i). j Plot of the percentage of microtissue area occupied by the openings. The opening area of TGF-β1-treated sample is significantly larger than that of untreated sample at day 6. Data are reported as the mean ± SD. n ≥ 5; *P < 0.001 when compared to untreated condition by one-way ANOVA with Tukey test
Fig. 5
Fig. 5
Anti-fibrosis drug efficacy under preventative treatment. a Overview of the strategy for preventative anti-fibrosis treatment and evaluation of the anti-fibrosis efficacy based on the measurement of biomarker expression and tissue mechanical properties. Pirfenidone (Pirf.) and Nintedanib (Nint.) were co-administered with TGF-β1 at the beginning of experiments and remained throughout the 6 day treatment period. b Representative immunofluorescence images of nuclei, α-SMA and pro-collagen of microtissues at day 6, with or without preventative anti-fibrosis treatments. Scale bar is 200 µm. c Plot of tissue-level fluorescence intensity of α-SMA and pro-collagen at day 6. d Time-lapsed measurement of microtissue contractile force. e Representative fluorescent images of collagen type-I of TGF- β1-treated and Pirf.-treated long microtissues. Zoom-in views showed that dilation of opening was inhibited by Pirf. treatment. Scale bar is 500 µm. f Time-lapsed plot of the percentage microtissue area occupied by the tissue openings. Pirfenidone treatment almost completely inhibited opening dilation at day 6. g Plot of the microtissue stiffness measured by tensile test at day 6. h Plot of the microtissue compliance measured at day 6. Data are reported as the mean ± SD. n ≥ 10; *P < 0.05 when compared to TGF-β1-treated condition; **P < 0.001 when compared to TGF-β1-treated condition. Statistical significance was determined by one-way ANOVA with Tukey test
Fig. 6
Fig. 6
Anti-fibrosis drug efficacy under therapeutic treatment. a Overview of the strategy for therapeutic anti-fibrosis treatment and evaluation of the anti-fibrosis efficacy based on the measurement of biomarker expression and tissue mechanical properties. Initial fibrosis progression was induced using TGF-β1 in the first three days and anti-fibrosis treatments were applied from day 3 to 6 without the presence of TGF-β1. b Representative immunofluorescence images of nuclei, α-SMA and pro-collagen of microtissues at day 6, with or without therapeutic anti-fibrosis treatments. TGF-β1 +3/−3 represents 3 days of TGF-β1 treatment followed by 3 days of normal culture condition without TGF-β1. Scale bar is 200 µm. c Plot of tissue-level fluorescence intensity of α-SMA and pro-collagen at day 6. d Time-lapsed measurement of microtissue contractile force. e Plot of microtissue stiffness measured by tensile test at day 6. f Plot of microtissue compliance measured at day 6. Data are reported as the mean ± SD. n ≥ 10; *P < 0.05 when compared to TGF-β1-treated condition. Statistical significance was determined by one-way ANOVA with Tukey test

References

    1. Friedman S, Sheppard D, Duffield J, Violette S. Therapy for fibrotic diseases: nearing the starting line. Sci. Transl. Med. 2013;5:167sr161. doi: 10.1126/scitranslmed.3004700. - DOI - PubMed
    1. Wynn TA, Ramalingam TR. Mechanisms of fibrosis: therapeutic translation for fibrotic disease. Nat. Med. 2012;18:1028–1040. doi: 10.1038/nm.2807. - DOI - PMC - PubMed
    1. Ahluwalia N, Shea BS, Tager AM. New therapeutic targets in idiopathic pulmonary fibrosis. Aiming to rein in runaway wound-healing response. Am. J. Respir. Crit. Care Med. 2014;190:867–878. doi: 10.1164/rccm.201403-0509PP. - DOI - PMC - PubMed
    1. King TE, Pardo A, Selman M. Idiopathic pulmonary fibrosis. Lancet. 2011;378:1949–1961. doi: 10.1016/S0140-6736(11)60052-4. - DOI - PubMed
    1. Hinz B. Mechanical aspects of lung fibrosis: a spotlight on the myofibroblast. Proc. Am. Thorac. Soc. 2012;9:137–147. doi: 10.1513/pats.201202-017AW. - DOI - PubMed

Publication types

MeSH terms