. 2018 May 25;8(1):8097.
doi: 10.1038/s41598-018-26397-2.

TDP-43 induces p53-mediated cell death of cortical progenitors and immature neurons

Affiliations

TDP-43 induces p53-mediated cell death of cortical progenitors and immature neurons

Miriam A Vogt et al. Sci Rep. .

Abstract

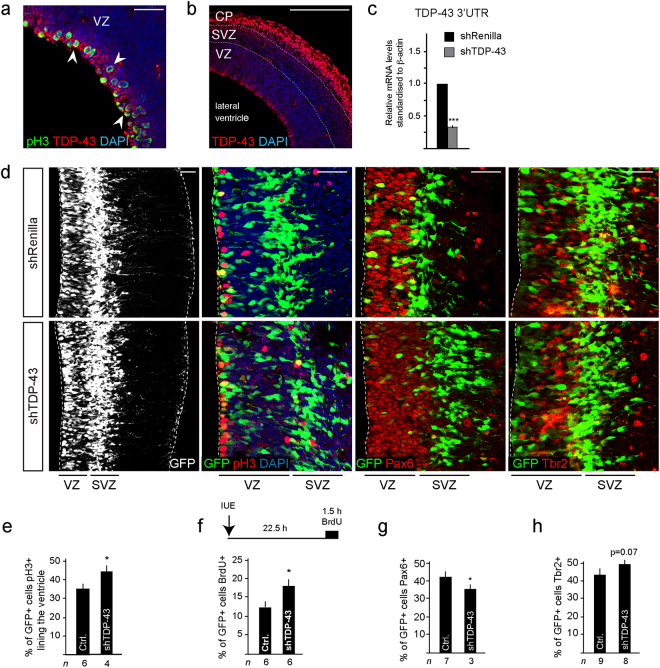
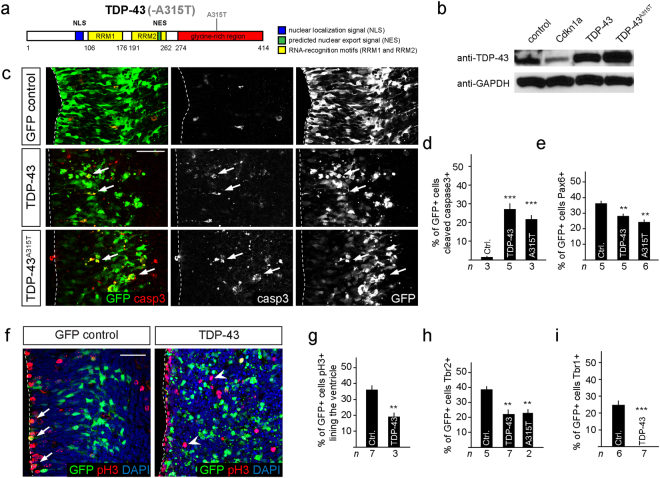
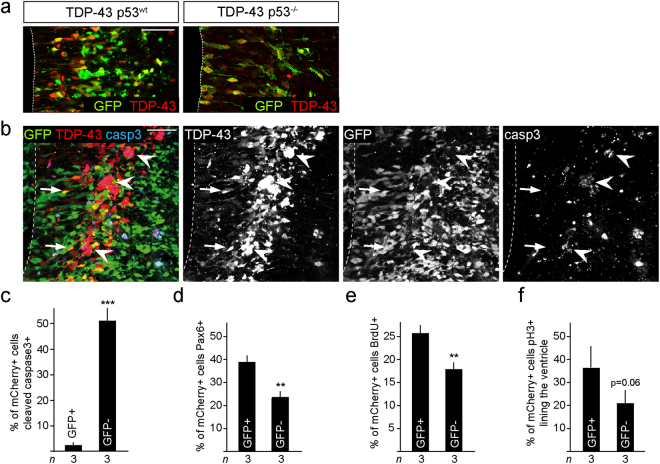
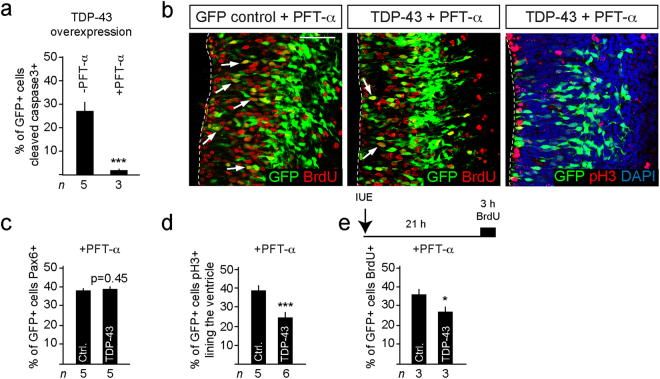
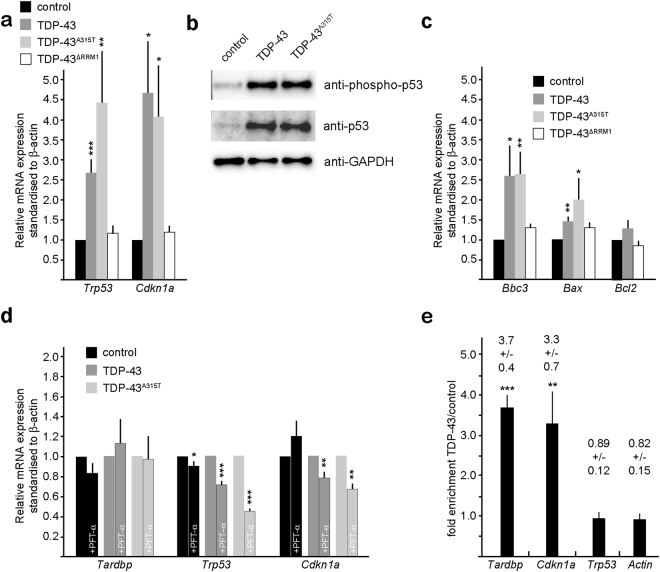
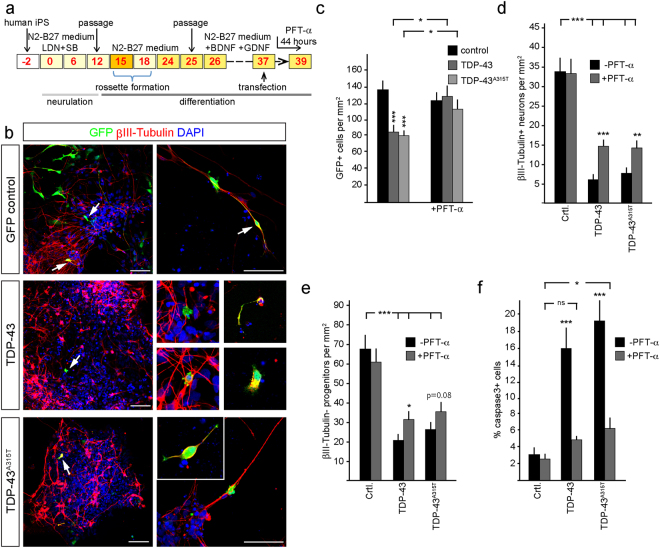
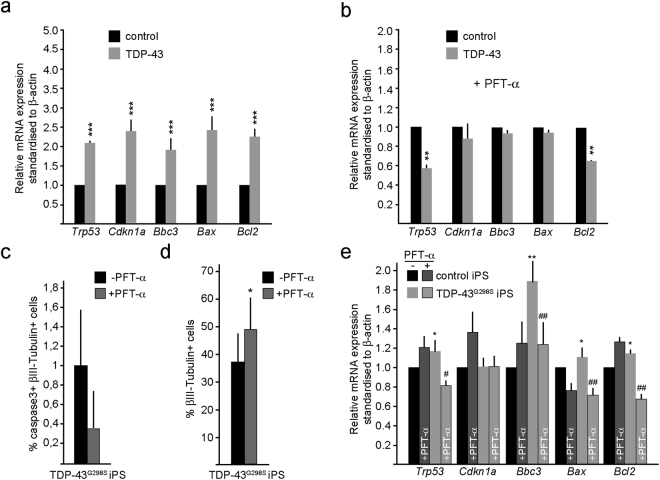
TAR DNA-binding protein 43 (TDP-43) is a key player in neurodegenerative diseases including frontotemporal lobar degeneration (FTLD) and amyotrophic lateral sclerosis (ALS). Accumulation of TDP-43 is associated with neuronal death in the brain. How increased and disease-causing mutant forms of TDP-43 induce cell death remains unclear. Here we addressed the role of TDP-43 during neural development and show that reduced TDP-43 causes defects in neural stem/progenitor cell proliferation but not cell death. However, overexpression of wild type and TDP-43A315T proteins induce p53-dependent apoptosis of neural stem/progenitors and human induced pluripotent cell (iPS)-derived immature cortical neurons. We show that TDP-43 induces expression of the proapoptotic BH3-only genes Bbc3 and Bax, and that p53 inhibition rescues TDP-43 induced cell death of embryonic mouse, and human cortical neurons, including those derived from TDP-43G298S ALS patient iPS cells. Hence, an increase in wild type and mutant TDP-43 induces p53-dependent cell death in neural progenitors developing neurons and this can be rescued. These findings may have important implications for accumulated or mutant TDP-43 induced neurodegenerative diseases.


Conflict of interest statement

The authors declare no competing interests.

Figures

Figure 1
Figure 1
TDP-43 knockdown (KD) decreases Pax6+ neural stem/progenitors and affects cell cycle. (a) TDP-43 is expressed by ventricular zone (VZ) progenitors including by cells in mitosis (arrows). (b) TDP-43 is highly expressed by neurons in the cortical plate (CP) at e14.5. (c) TDP-43 KD (shTDP-43) by in utero electroporation (IUE) of neural stem/progenitors at e13.5 and analyzed at e14.5 reduces TDP-43 mRNA levels by 70% (***P < 0.001) compared to control (shRenilla). (d) TDP-43 KD (GFP+) cells survive in the VZ and differentiate to generate Tbr2+ basal progenitors in the subventricular zone (SVZ) similar to control transfected cells (shRenilla). (e) The proportion of cells lining the ventricle that are pH3+ increases following TDP-43 KD (shTDP-43) compared to control cells (shRenilla: Ctrl.), suggesting accumulation in M-phase of cell cycle. Values are shown as the proportion of transfected cells (GFP+). (f) Scheme of the BrdU labeling procedure in e13.5 mice with a BrdU pulse 22.5 hours post IUE and 1.5 hours prior to killing. The proportion of GFP+ cells in the VZ that are BrdU labeled following TDP-43 KD (shTDP-43) increases compared to control cells (shRenilla: Ctrl.), suggesting increased S-phase entry. Values are shown as the proportion of transfected cells (GFP+). (g) The proportion of GFP+ cells that are Pax6+ following TDP-43 KD (shTDP-43) reduces compared to control cells (shRenilla: Ctrl.). Values are shown as the proportion of transfected cells (GFP+). (h) The proportion of GFP+ cells that are Tbr2+ following TDP-43 KD (shTDP-43) is unaffected compared to control cells (shRenilla: Ctrl.). Values are shown as the proportion of transfected cells (GFP+). Scale bars in a and d = 25 µm, in b = 100 µm. Dashed line marks the telencephalic vesicle lining. tTest *P < 0.05, ***< 0.001. ventricular zone (VZ), subventricular zone (SVZ), cortical plate (CP).
Figure 2
Figure 2
Expression of TDP-43 and TDP-43A315T induce p53-dependent apoptosis of neural progenitors. (a) Scheme of human TDP-43 and TDP-43A315T with a single point mutation in the glycine-rich C-terminal region, nuclear localization signal (NLS), nuclear export signal (NES), RNA recognition motif (RRM). (b) Transfection of neural progenitors results in a 2.4-fold expression of TDP-43 and 2.8-fold for TDP-43A315T compared to endogenous levels. Expression of Cdkn1 reduces endogenous TDP-43 levels suggesting a reciprocal interaction with TDP-43. (c) Expression of TDP-43 and TDP-43A315T activates caspase-3 (arrows) and drives cells in the ventricular zone into apoptosis within 24 hours. (d) TDP-43 and TDP-43A315T expression induce caspase-3 activity and apoptosis in transfected cells (GFP+). Values are shown as the proportion of transfected cells (GFP+). (e) TDP-43 and TDP-43A315T expression reduce the proportion of Pax6+GFP+ progenitors compared to control transfected cells (Ctrl.). Values are shown as the proportion of transfected cells (GFP+). (f,g) TDP-43 expression causes mislocalization of GFP+pH3+ cells away from the ventricular lining (GFP control: arrows) to more basal locations (TDP-43: arrowheads) and reduces the proportion of ventricular progenitors in M-phase (pH3+) compared to control transfected cells (Ctrl.). Values are shown as the proportion of transfected cells (GFP+). (h) TDP-43 and TDP-43A315T expression reduce differentiation to Tbr2+ basal progenitors compared to control transfected cells (Ctrl.). Values are shown as the proportion of transfected cells (GFP+). (i) TDP-43 overexpressing progenitors fail to generate Tbr1+ neurons in the cortical plate. Scale bar in c and f = 25 µm. Dashed line marks the telencephalic vesicle lining. tTest *P < 0.05, **< 0.01, ***< 0.001.
Figure 3
Figure 3
p53 deletion rescues TDP-43 overexpressing neural progenitors. (a) TDP-43 overexpression does not induce cell fragmentation or death of progenitors of p53−/− embryos. p53−/− TDP-43 expressing cells show a normal radial morphology in the ventricular zone and migrate to the subventricular zone. (b,c) Conditional deletion of floxed Trp53 alleles by expression of Cre-recombinase (GFP+), (mCherry+GFP+p53−/−, arrows) reduces caspase-3 activation following expression of TDP-43 compared to none Cre-recombined cells (mCherry+GFP-p53+/+, arrowheads). Values are shown as the proportion of TDP-43 overexpressing cells (mCherry+). (d–f) Trp53 ablated (GFP+), TDP-43 overexpressing (mCherry+) cells (mCherry+GFP+p53−/−, arrows) show rescue of Pax6+ (d), BrdU+ (e) and pH3+ expression (f) compared to none Cre-recombined Trp53 wild type cells (mCherry+GFPp53+/+). Values are shown as the proportion of transfected cells (mCherry+). Scale bar = 25 µm. Dashed line marks the telencephalic vesicle lining. tTest P = 0.06, **< 0.01, ***< 0.001.
Figure 4
Figure 4
p53 inhibition with PFT-α rescues TDP-43 mediated apoptosis and integrity but not cell cycle defects. (a) TDP-43 induced caspase-3 activity and apoptosis is rescued by blocking p53 with PFT-α. (b) Inhibition of p53 with PFT-α in utero rescues TDP-43 induced apoptosis but does not reverse cell cycle defects. Arrows indicate BrdU+ transfected cells (GFP+). (c) Inhibition of p53 with PFT-α rescues TDP-43 expressing Pax6+ progenitors in embryos. (d) The proportion of TDP-43 overexpressing cells (GFP+) at the ventricular lining and expressing pH3+ is reduced and not rescued by PFT-α compared to control transfected cells (Ctrl.). Values are shown as the proportion of transfected cells (GFP+). (e) The proportion of TDP-43 overexpressing cells (GFP+) in the VZ that are BrdU labeled is not rescued by PFT-α compared to control cells (Ctrl.). Values are shown as the proportion of transfected cells (GFP+). Scale bars = 25 µm. Dashed line marks the telencephalic vesicle lining. tTest *P < 0.05, ***< 0.001.
Figure 5
Figure 5
TDP-43 regulates proapototic BH3-only, Trp53 and Cdkn1a mRNA expression. (a) TDP-43 and TDP-43A315T expression in neural progenitors increases Trp53 and Cdkn1a mRNA levels, analyzed by quantitative RT-PCR analysis. TDP-43∆RRM1expression does not affect Trp53 and Cdkn1a mRNA levels. (b) TDP-43 and TDP-43A315T expression in neural progenitors results in increased level of activated, phosphorylated p53 protein and total p53 protein. (c) TDP-43 and TDP-43A315T expression in neural progenitors increases mRNA levels of the proapoptotic BH3-only proteins Bbc3 (PUMA) and Bax, but not the antiapoptotic factor Bcl2. TDP-43∆RRM1expression does not affect Bbc3, Bax or Bcl-2 mRNA levels. (d) Pharmacological inhibition of p53 reduces TDP-43 and TDP-43A315T induced Trp53 and Cdkn1a mRNA levels but does not affect endogenous Tardbp mRNA expression, analyzed by quantitative RT-PCR analysis. Values are shown as relative to non-treated, standardized to β-actin. (e) TDP-43 binds endogenous Tardbp and Cdkn1a but not Trp53 mRNAs. Quantitative RT-PCR analysis of Tardbp, Cdkn1a, Trp53 and β-actin transcripts CLIPed together with TDP-43 from neural progenitors. Values are fold enrichment over control CLIPed (flag-GFP) transcripts. Statistical analysis of CLIPed products corrected relative to input RNA concentrations compared to flag-GFP CLIPed samples. Agarose gel analysis of the amplicons is shown in Supplementary Fig. 6a.
Figure 6
Figure 6
TDP-43 and human mutant TDP-43A315T toxicity in human iPS-derived neurons is rescued by inhibition of p53. (a) Scheme of the human iPS cortical neuron differentiation profile and analysis of TDP-43 overexpression. Control human iPS cells were neuralized from day 0 to day 12 in N2-B27 Medium + LDN and SB and passaged on day 15 and day 25 and differentiated in N2 medium minus B27 (N2-B27) for 39 days. TDP-43 and TDP-43A315T expression constructs were transfected on day 37. (b) Transfected GFP-expressing human iPS cells have neuronal and progenitor morphologies. TDP-43 and TDP-43A315T cells are reduced and show stunted morphologies and cellular fragmentation compared to controls (arrows). (c) Expression of TDP-43 and TDP-43A315T reduces the number of iPS-derived cells within the cultures. Treatment with PFT-α for 44 hours significantly rescues the number of transfected cells to control (GFP) levels. Together with the increased expression of activated caspase-3 these findings confirm that TDP-43 and TDP-43A315T are toxic and rapidly induce apoptotic cell death that is dependent upon p53. (d,e) TDP-43 and TDP-43A315T expression result in a reduction of iPS-derived neurons (βIII-Tubulin+) and progenitors cells (βIII-Tubulin). PFT-α treatment of the cultures for 44 hours prior to analysis partially rescued the TDP-43 and TDP-43A315T induced loss of neurons and progenitors. (f) TDP-43 and TDP-43A315T expressing human neurons activate caspase-3 and die by apoptosis. Inhibition of p53 with PFT-α for 44 hours rescues cell death. Scale bar = 25 µm. tTest *P < 0.05, **< 0.01, ***< 0.001, ns not significant.
Figure 7
Figure 7
Proapoptotic gene expression is increased in human iPS-derived cortical cells and TDP-43G298S mutant iPS derived cortical cultures. (a) TDP-43/GFP expression in human iPS followed by fluorescent assisted cell sorting after 48 hours. TDP-43 expression in human iPS cortical neuron increases mRNA levels of the proapoptotic genes Trp53, Cdkn1a, Bbc3 (PUMA), Bax and Bcl2. (b) TDP-43/GFP expression in human iPS followed by sorting after 48 hours. p53 inhibition by PFT-α treatment for 44 hours prior to sorting rescues TDP-43 induced increase of proapoptotic genes in human iPS compared to control. (c) TDP-43G298S iPS-derived cells show reduced numbers of activated caspase-3+ cells upon PFT-α treatment for 44 hours. (d) TDP-43G298S iPS cells and control iPS cells show reduced numbers of βIII-Tubulin+ cells upon PFT-α treatment for 44 hours. (e) TDP-43G298S iPS cells display increases mRNA levels of proapoptotic genes p53, Bbc3 (PUMA), Bax and Bcl2 upon PFT-α treatment for 44 hours. In comparison mRNA levels of the very genes in Control iPS cells are unchanged. tTest *P < 0.05, **< 0.01, ***<0.001 relative to control cells. #P < 0.05, ##P < 0.01 relative to cells not treated with PFT-α.

Similar articles

Cited by

References

    1. Ling SC, Polymenidou M, Cleveland DW. Converging mechanisms in ALS and FTD: disrupted RNA and protein homeostasis. Neuron. 2013;79:416–438. doi: 10.1016/j.neuron.2013.07.033. - DOI - PMC - PubMed
    1. Ou SH, Wu F, Harrich D, Garcia-Martinez LF, Gaynor RB. Cloning and characterization of a novel cellular protein, TDP-43, that binds to human immunodeficiency virus type 1 TAR DNA sequence motifs. Journal of virology. 1995;69:3584–3596. - PMC - PubMed
    1. Sephton CF, et al. TDP-43 is a developmentally regulated protein essential for early embryonic development. J Biol Chem. 2010;285:6826–6834. doi: 10.1074/jbc.M109.061846. - DOI - PMC - PubMed
    1. Wu LS, et al. TDP-43, a neuro-pathosignature factor, is essential for early mouse embryogenesis. Genesis. 2010;48:56–62. - PubMed
    1. Buratti E, et al. Nuclear factor TDP-43 and SR proteins promote in vitro and in vivo CFTR exon 9 skipping. EMBO J. 2001;20:1774–1784. doi: 10.1093/emboj/20.7.1774. - DOI - PMC - PubMed

Publication types