. 2018 May 25;9(1):2064.
doi: 10.1038/s41467-018-04540-x.

Identification of rare de novo epigenetic variations in congenital disorders

Affiliations

Identification of rare de novo epigenetic variations in congenital disorders

Mafalda Barbosa et al. Nat Commun. .

Abstract

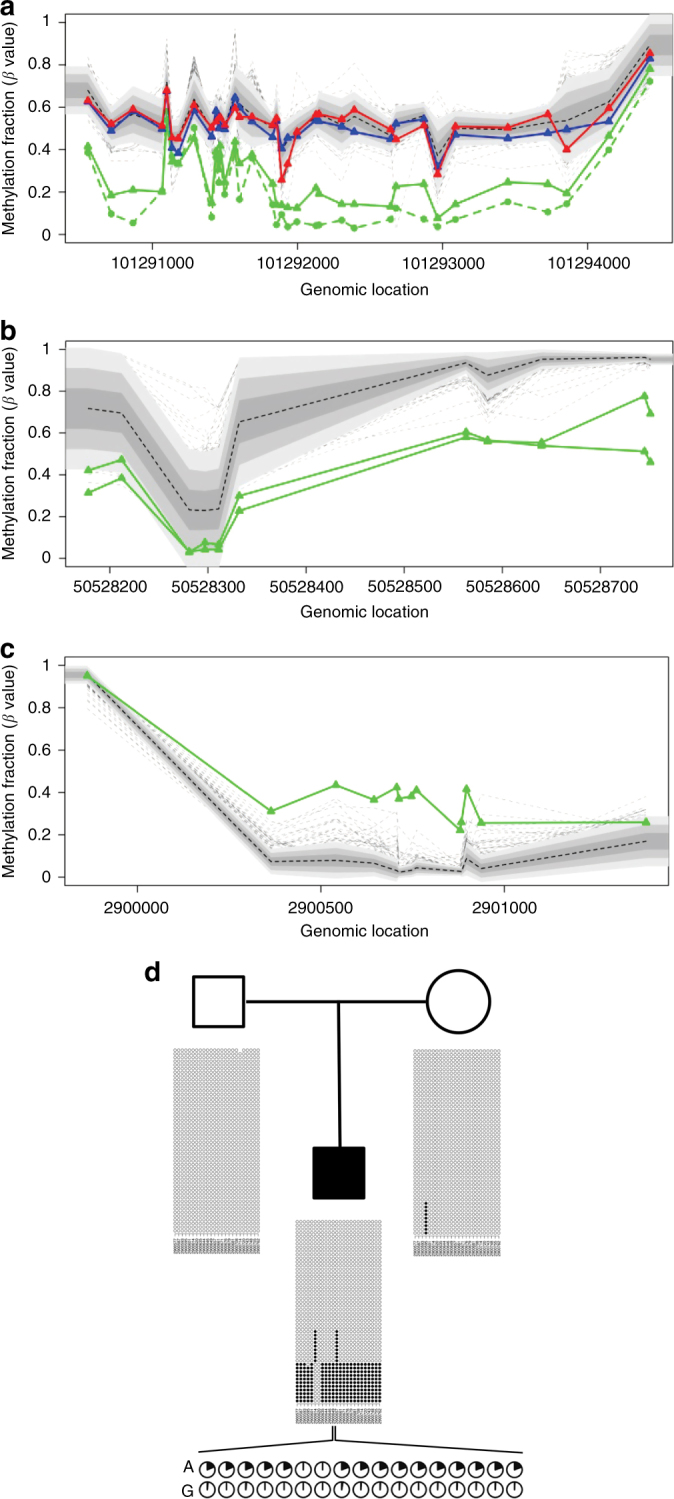
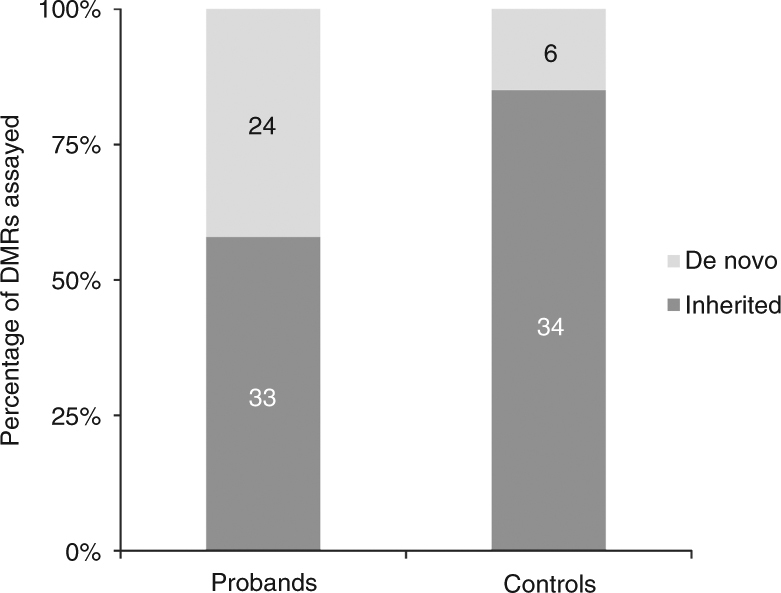
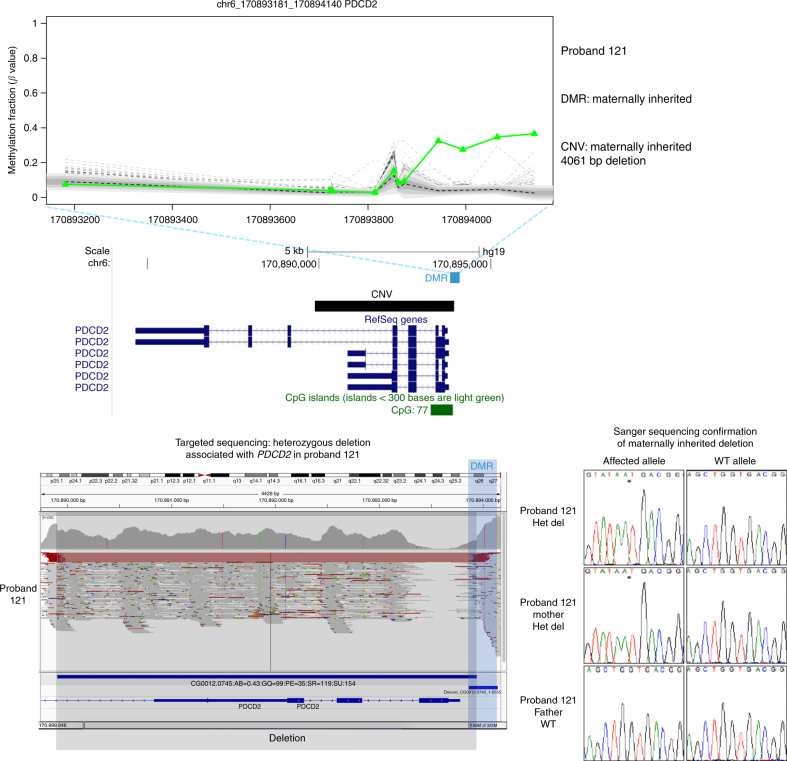
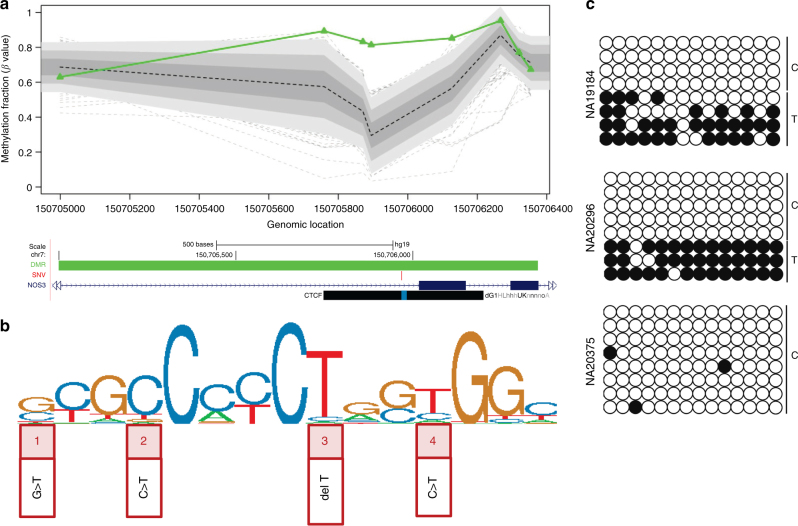
Certain human traits such as neurodevelopmental disorders (NDs) and congenital anomalies (CAs) are believed to be primarily genetic in origin. However, even after whole-genome sequencing (WGS), a substantial fraction of such disorders remain unexplained. We hypothesize that some cases of ND-CA are caused by aberrant DNA methylation leading to dysregulated genome function. Comparing DNA methylation profiles from 489 individuals with ND-CAs against 1534 controls, we identify epivariations as a frequent occurrence in the human genome. De novo epivariations are significantly enriched in cases, while RNAseq analysis shows that epivariations often have an impact on gene expression comparable to loss-of-function mutations. Additionally, we detect and replicate an enrichment of rare sequence mutations overlapping CTCF binding sites close to epivariations, providing a rationale for interpreting non-coding variation. We propose that epivariations contribute to the pathogenesis of some patients with unexplained ND-CAs, and as such likely have diagnostic relevance.


Conflict of interest statement

The authors declare no competing interests.

Figures

Fig. 1
Fig. 1
Large gains and losses of DNA methylation identified in patients with ND–CA. Plots a, b, and c show β values obtained from Illumina 450k array for probands (highlighted in green) and 1534 controls (shades of gray corresponding to ±1, ±1.5, and ±2 standard deviations from the population mean, represented by the dashed black line; dashed gray lines represent controls with outlier methylation levels). a Recurrent hypomethylation of the imprinted locus of MEG3 (hg19: chr14:101290194–101294429) in Proband 398 (solid green line) and Proband 146 (dashed green line). The epivariation in Proband 398 is de novo as both mother (red line) and father (blue line) present methylation profiles similar to controls. b Recurrent hypomethylation at the promoter, 5’ UTR, and first exon of MOV10L1 (hg19: chr22:50528178–50528751) observed in two unrelated probands: Proband 22 (de novo epivariation) and Proband 117 (inheritance unknown). c Hypermethylation of ZNF57 in Proband 381. d Pedigree and graphical representation of the methyl-seq data consistent with allele-specific nature of a de novo hypermethylation identified in ZNF57 is shown. Each plot shows the methylation pattern for an amplicon, with each row representing a single bisulfite read and each column one CpG in the amplicon. Black circles are methylated CpGs and white circles unmethylated CpGs. Based on the presence of a heterozygous SNP within the DMR (hg19: chr19:2900643), the observed gain of methylation occurs specifically on one allele: each pie chart shows the methylated fraction of reads per CpG
Fig. 2
Fig. 2
A significant excess of de novo epivariations found in patients with ND–CA. We observed a 2.8-fold enrichment for de novo epivariations in cases (n = 24 out of 57) when compared to controls (n = 6 out of 40) (p = 0.007, two-sided Fisher’s exact test)
Fig. 3
Fig. 3
Detection of rare CNVs by targeted sequencing of epivariations and their flanks. Proband 121 carries a maternally inherited DMR at the PDCD2 locus. We identified a maternally inherited heterozygous 4061 bp deletion flanking the DMR. Two other similar examples are shown in Supplementary Fig. 6
Fig. 4
Fig. 4
Targeted sequencing of epivariation loci identifies a significant enrichment of rare SNVs within the CTCF canonical binding motif. a Hypermethylation in NOS3 (chr7:150704999-150706354) in Proband 103 (outlier in green); in the lower UCSC Genome Browser view, the DMR location is shown as a green bar, and a rare SNV that lies within the CTCF binding motif (blue region within black bar) in this same individual is shown in red. b CTCF motif according to ENCODE Factorbook repository. Rare SNVs overlapping this CTCF binding motif were identified in four DMR carriers: (1) Proband 103: SNV (chr7:150705968 G>T), (2) Proband 70: SNV (chr19:295321 C>T), (3) Proband 176: 1 bp deletion (chr20:36793857 delT), (4) HapMap samples NA19239, NA19184; NA20296: rs116767319 (chr5:177707147 C>T). c 450k array analysis identified a DMR in NA19239, and a rare SNV (rs116767319) within a CTCF-binding motif in cis. We tested two other carriers of rs116767319 (NA19184 and NA20296) using allele-specific bisulfite sequencing, and found that both showed methylation on the T allele, thus confirming segregation of the epivariation with SNV. In contrast, a sample (NA20375) homozygous for the reference C allele is unmethylated
Fig. 5
Fig. 5
Epivariations are frequently associated with large changes in gene expression. We identified epivariations in 90 lymphoblastoid cell lines studied as part of the 1000 Genomes Project, and combined these with SNP genotypes and RNAseq data from a total of 462 samples to measure quantitative and allelic effects of epivariations on gene expression. a An individual with hypermethylation of the UBE2T promoter (solid green line) compared to 89 other individuals (dashed gray lines) presented b the lowest gene expression (green dot on the boxplot) of the cohort. c Using heterozygous SNPs within RNAseq reads, we observed monoallelic expression of UBE2T in the epivariation carrier (outlier highlighted in green). d An individual with hypomethylation of the GTSF1 promoter (solid green line) presents e the highest level of expression (green dot on the boxplot). f Violin plots show that individuals with hypomethylated epivariations at gene promoters show significantly increased expression of that gene, whereas individuals with hypermethylated promoter epivariations show significantly reduced expression of that gene (p = 9.2 × 10−5, Wilcoxon Rank-Sum test). In box plots (b and e), the center line shows the median; box limits indicate the 25th and 75th percentiles; whiskers extend 1.5 times the interquartile range from the 25th and 75th percentiles; outliers are shown as individual points. In the violin plot (f), the white dots show the median; box limits indicate the 25th and 75th percentiles; whiskers extend 1.5 times the interquartile range from the 25th and 75th percentiles
Fig. 6
Fig. 6
Epivariations detected in blood cells are conserved in fibroblasts from the same individual. The presence of outlier methylation changes in T cells is strongly correlated with outlier methylation in fibroblasts from the same individual (Spearman rank correlation 0.75, p = 1.2 × 10−27, Wilcoxon Rank-Sum test). White dots show the median; box limits indicate the 25th and 75th percentiles; whiskers extend 1.5 times the interquartile range from the 25th and 75th percentiles

References

    1. Horsthemke B. Epimutations in human disease. Curr. Top. Microbiol. Immunol. 2006;310:45–59. - PubMed
    1. Castillejo A, et al. Prevalence of MLH1 constitutional epimutations as a cause of Lynch syndrome in unselected versus selected consecutive series of patients with colorectal cancer. J. Med. Genet. 2015;52:498–502. doi: 10.1136/jmedgenet-2015-103076. - DOI - PubMed
    1. Willemsen R, Levenga J, Oostra B. CGG repeat in the FMR1 gene: size matters. Clin. Genet. 2011;80:214–225. doi: 10.1111/j.1399-0004.2011.01723.x. - DOI - PMC - PubMed
    1. Bamshad MJ, et al. Exome sequencing as a tool for Mendelian disease gene discovery - supplementary information. Nat. Rev. Genet. 2011;12:745–755. doi: 10.1038/nrg3031. - DOI - PubMed
    1. Miller DT, et al. Consensus statement: chromosomal microarray is a first-tier clinical diagnostic test for individuals with developmental disabilities or congenital anomalies. Am. J. Hum. Genet. 2010;86:749–764. doi: 10.1016/j.ajhg.2010.04.006. - DOI - PMC - PubMed

Publication types

MeSH terms