. 2018 May 25;8(1):8162.
doi: 10.1038/s41598-018-26546-7.

Effects of Decade Long Freezing Storage on Adipose Derived Stem Cells Functionality

Affiliations

Effects of Decade Long Freezing Storage on Adipose Derived Stem Cells Functionality

Shahensha Shaik et al. Sci Rep. .

Abstract

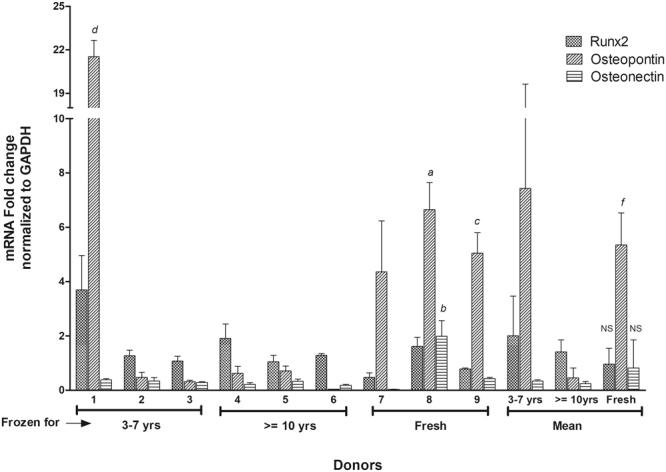
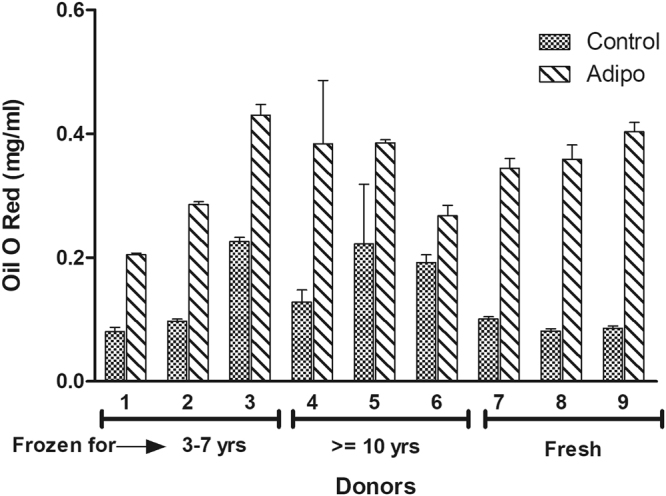
Over the last decade and half, the optimization of cryopreservation for adipose tissue derived stromal/stem cells (ASCs) especially in determining the optimal combination of cryoprotectant type, cooling rate, and thawing rate have been extensively studied. In this study, we examined the functionality of ASCs that have been frozen-stored for more than 10 years denoted as long-term freezing, frozen within the last 3 to 7 years denoted as short-term freezing and compared their response with fresh ASCs. The mean post-thaw viability for long-term frozen group was 78% whereas for short-term frozen group 79% with no significant differences between the two groups. The flow cytometry evaluation of stromal surface markers, CD29, CD90, CD105, CD44, and CD73 indicated the expression (above 95%) in passages P1-P4 in all of the frozen-thawed ASC groups and fresh ASCs whereas the hematopoietic markers CD31, CD34, CD45, and CD146 were expressed extremely low (below 2%) within both the frozen-thawed and fresh cell groups. Quantitative real time polymerase chain reaction (qPCR) analysis revealed some differences between the osteogenic gene expression of long-term frozen group in comparison to fresh ASCs. Intriguingly, one group of cells from the short-term frozen group exhibited remarkably higher expression of osteogenic genes in comparison to fresh ASCs. The adipogenic differentiation potential remained virtually unchanged between all of the frozen-thawed groups and the fresh ASCs. Long-term cryopreservation of ASCs, in general, has a somewhat negative impact on the osteogenic potential of ASCs, especially as it relates to the decrease in osteopontin gene expression but not significantly so with respect to RUNX2 and osteonectin gene expressions. However, the adipogenic potential, post thaw viability, and immunophenotype characteristics remain relatively intact between all the groups.


Conflict of interest statement

During the study period, Drs. X.W. and J.G. were employed at LaCell LLC, a for-profit biotech company cofounded and co-owned by Dr. J.G. and Dr. X.W. The remaining coauthors have no conflicts to disclose.

Figures

Figure 1
Figure 1
The post thaw viability of different ASC donors cryopreserved for short-term (3–7 years) and long-term (> = 10 years). The donor numbers (1–6) shown on the x-axis correspond to the numbers shown in Table 1. Additionally, the mean post thaw viability for each group (either the short-term or the long term is also shown in the last columns. The y-axis shows the percentage of viable cells obtained using live/dead assay with each donor measurement being made in triplicate (corresponding to the error bars shown). *Indicates P value < 0.05 as statistically significant. NS as not significant (P > 0.05).
Figure 2
Figure 2
The flow cytometry dot plots for stromal cell (CD29, CD90, CD105, CD44, and CD73) and hematopoietic markers (CD31, CD34, CD45, and CD146) from a representative donor at Passage 1 are shown. (A) shows the CD44 (x-axis) and CD146 (y-axis); (B) shows CD29 (x-axis) and CD146 (y-axis); (C) shows CD90 (x-axis) and CD31 (y-axis); (D) shows CD105 (x-axis) and CD34 (y-axis); € shows CD73 (x-axis) and CD45 (y-axis).
Figure 3
Figure 3
The mean percentage of surface marker expression on ASCs determined by flow cytometry for the passages P1-P4 are shown. (A) short-term (3–7 years) frozen-thawed cells; (B) long-term (> = 10 years) frozen-thawed cells; (C) Fresh ASCs. The figures depict passage number on the z-axis, the surface marker expression percentage on the y-axis while the x-axis shows the stromal (CD29, CD90, CD105, CD44, and CD73) and hematopoietic (CD31, CD34, CD45, and CD146) surface markers. No significant differences were found between the groups and between the various donors.
Figure 4
Figure 4
Comparison of osteogenic differentiation by Alizarin Red S between various donors. Top Row: Short-term (3–7 years) frozen-thawed ASCS; Middle Row: Long-term (> = 10 years) frozen-thawed ASCs; Bottom Row: Fresh ASCs. The donor numbers (1–9) shown on the figures correspond to the numbers shown in Table 1. Alizarin Red S staining was performed after 21 days of osteogenic induction on osteogenic differentiated samples and their controls. The images are of magnification 10x and the scale bar represents 100 µm.
Figure 5
Figure 5
Quantitation and comparison of Alizarin Red S staining from the osteogenic differentiated short-term (3–7 years) frozen-thawed ASCs, long-term (> = 10 years) frozen-thawed ASCs, and fresh ASCs. The donor numbers (1–9) shown on the x-axis correspond to the numbers shown in Table 1. The y-axis shows the concentration of alizarin red stain (mg/ml) as described in the text with each donor measurement being made in triplicate (corresponding to the error bars shown). “a” indicates P value < 0.05 relative to donors 3, 4, and 6. “b” indicates P value < 0.05 relative to donors 3 and 6. “NS” indicates no statistical significance between the means of Fresh group in relation to 3–7 years and > = 10 years group.
Figure 6
Figure 6
qPCR Osteogenesis— the expression of osteogenic genes RUNX2, Osteonectin, and Osteopontin for short-term (3–7 years) frozen-thawed ASCs, long-term (> = 10 years) frozen-thawed ASCs, and fresh ASCs. The donor numbers (1–9) shown on the x-axis correspond to the numbers shown in Table 1. The y-axis shows the mRNA fold change normalized to GAPDH as described in the text with each donor measurement being made in triplicate (corresponding to the error bars shown). The decrease in the osteogenic gene expression in relation to the fresh ASCs was found in long-term and short-term frozen groups. Notice that the ASCs from donor #1 in the short-term frozen-thawed group shows a higher expression than fresh ASCs. “a” indicates P value < 0.01 relative to donors 2, 3, 4, 5, and 6. “b” indicates P value < 0.05 relative to donors 2, 3, 4, 5, and 6. “c” indicates P value < 0.02 relative to donors 2, 3, 4, 5, and 6. “d” indicates P value < 0.005 relative to donors 7, 8, and 9. “f” indicates P value < 0.02 relative to the mean of > = 10 yrs group for the gene Osteopontin. “NS” indicates no statistical significance between the means of fresh group in relation to 3–7 yrs and > = 10 yrs groups for the genes RUNX2 and Osteonectin.
Figure 7
Figure 7
Comparison of adipogenic differentiation by Oil Red O staining between various donors. Top Row: short-term (3–7 years) frozen-thawed ASCs; Middle Row: long-term (> = 10 years) frozen-thawed ASCs; Bottom Row: Fresh ASCs. The donor numbers (1–9) shown on the figures correspond to the numbers shown in Table 1. Oil Red O staining was performed after 10 days of adipogenic induction on adipogenic differentiated samples and their controls. The images are of magnification 25x and the scale bar represents 50 µm.
Figure 8
Figure 8
Quantitation and comparison of Oil Red O staining from the adipogenic differentiated short-term (3–7 years) frozen-thawed ASCs, long-term (> = 10 years) frozen-thawed ASCs, and fresh ASCs. The donor numbers (1–9) shown on the x-axis correspond to the numbers shown in Table 1. The y-axis shows the concentration of Oil Red O staining (mg/ml) as described in the text with each donor measurement being made in triplicate (corresponding to the error bars shown). No significant differences in gene expression between long-term and short-term frozen groups in relation to the fresh ASCs is observed.
Figure 9
Figure 9
qPCR Adipogenesis— the expression of adipogenic genes Adiponectin (AN), PPARg, and Leptin (Lep) for short-term (3–7 years) frozen-thawed ASCs, long-term (> = 10 years) frozen-thawed ASCs, and fresh ASCs. The donor numbers (1–9) shown on the x-axis correspond to the numbers shown in Table 1. The y-axis shows the mRNA fold change normalized to CycB as described in the text with each donor measurement being made in triplicate (corresponding to the error bars shown). No significant differences in gene expression between long-term and short-term frozen groups in relation to the fresh ASCs is observed.

References

    1. Zuk PA, et al. Human adipose tissue is a source of multipotent stem cells. Molecular biology of the cell. 2002;13:4279–4295. doi: 10.1091/mbc.e02-02-0105. - DOI - PMC - PubMed
    1. Zuk PA, et al. Multilineage cells from human adipose tissue: implications for cell-based therapies. Tissue engineering. 2001;7:211–228. doi: 10.1089/107632701300062859. - DOI - PubMed
    1. Gimble JM, Katz AJ, Bunnell BA. Adipose-derived stem cells for regenerative medicine. Circulation research. 2007;100:1249–1260. doi: 10.1161/01.RES.0000265074.83288.09. - DOI - PMC - PubMed
    1. Estes BT, Diekman BO, Gimble JM, Guilak F. Isolation of adipose-derived stem cells and their induction to a chondrogenic phenotype. Nature protocols. 2010;5:1294. doi: 10.1038/nprot.2010.81. - DOI - PMC - PubMed
    1. Mesimäki K, et al. Novel maxillary reconstruction with ectopic bone formation by GMP adipose stem cells. International journal of oral and maxillofacial surgery. 2009;38:201–209. doi: 10.1016/j.ijom.2009.01.001. - DOI - PubMed

Publication types