. 2018 Jun;21(6):811-819.
doi: 10.1038/s41593-018-0154-9. Epub 2018 May 25.

A molecular network of the aging human brain provides insights into the pathology and cognitive decline of Alzheimer's disease

Affiliations

A molecular network of the aging human brain provides insights into the pathology and cognitive decline of Alzheimer's disease

Sara Mostafavi et al. Nat Neurosci. 2018 Jun.

Abstract

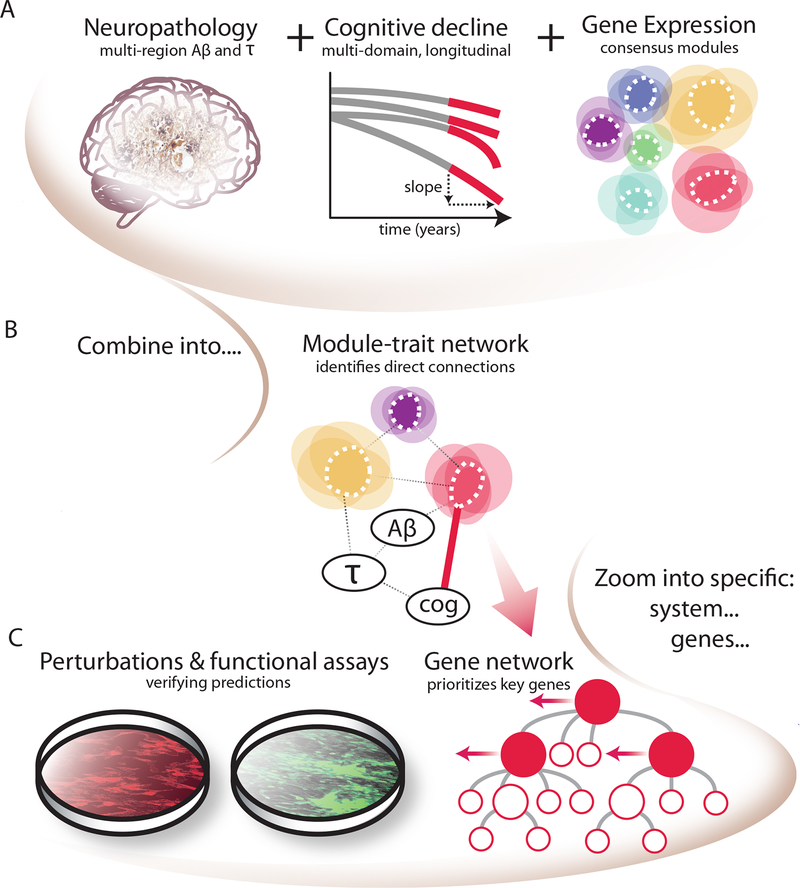
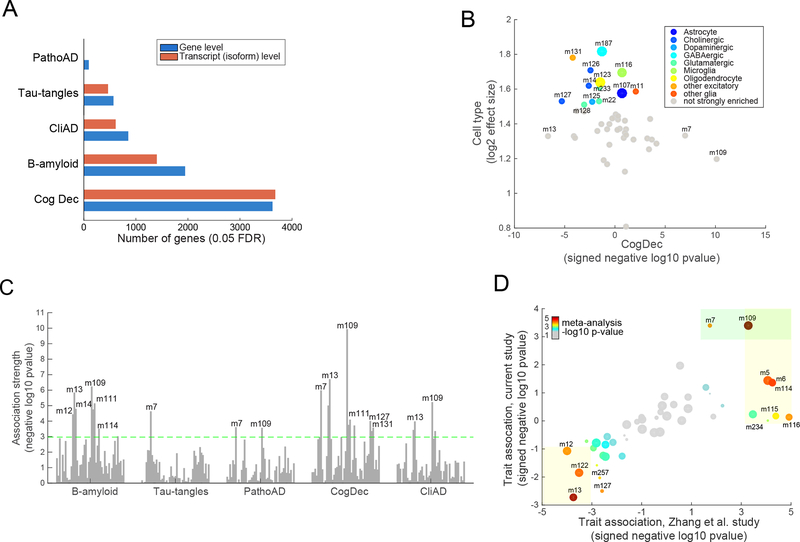
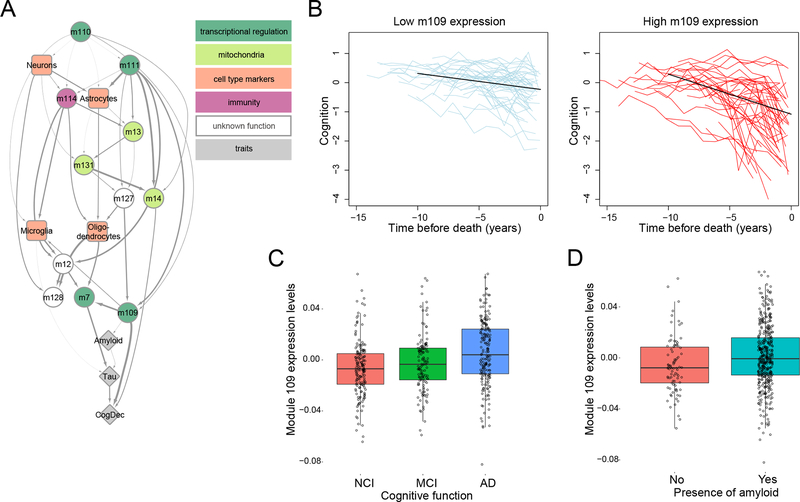
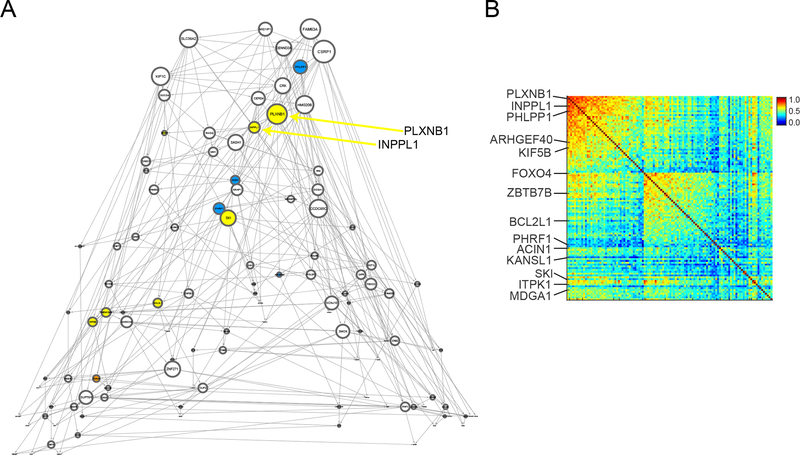
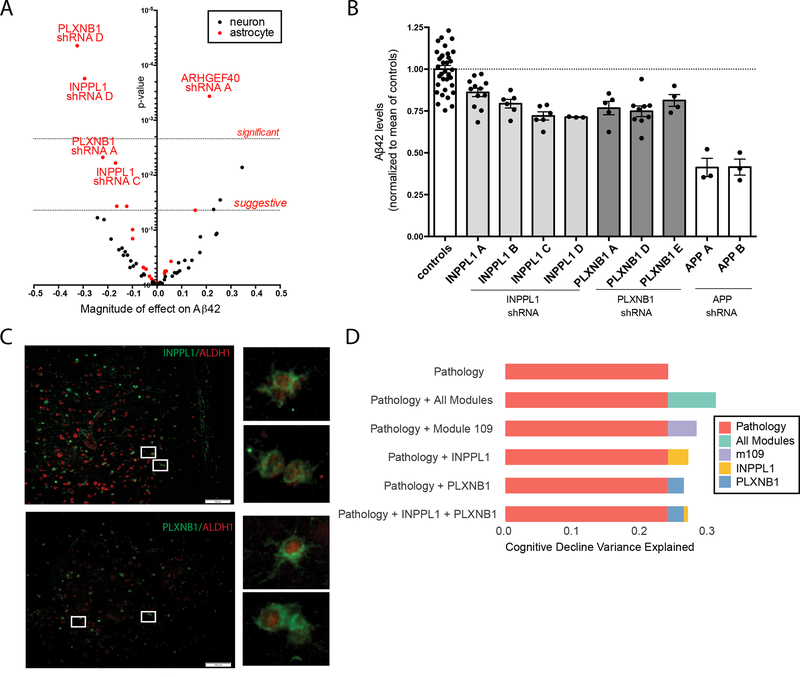
There is a need for new therapeutic targets with which to prevent Alzheimer's disease (AD), a major contributor to aging-related cognitive decline. Here we report the construction and validation of a molecular network of the aging human frontal cortex. Using RNA sequence data from 478 individuals, we first build a molecular network using modules of coexpressed genes and then relate these modules to AD and its neuropathologic and cognitive endophenotypes. We confirm these associations in two independent AD datasets. We also illustrate the use of the network in prioritizing amyloid- and cognition-associated genes for in vitro validation in human neurons and astrocytes. These analyses based on unique cohorts enable us to resolve the role of distinct cortical modules that have a direct effect on the accumulation of AD pathology from those that have a direct effect on cognitive decline, exemplifying a network approach to complex diseases.


Conflict of interest statement

Competing Financial Interest Statement

There are no competing financial interests.

Figures

Figure 1.
Figure 1.. Schematic of the implementation of the module-trait network (MTN) method to prioritize modules and genes directly related to AD-related traits in our study.
(A) Inputs to the MTN method are: 1) AD pathological traits of amyloid and tau measurements, which are aggregated over multiple brain regions; 2) slope of cognitive decline prior to death aggregated over multiple neuropsychologic tests; and 3) average expression of coexpressed gene sets (modules), detected in the same subjects using consensus clustering. (B) These three inputs are combined using conditional independence relationships (via Bayesian networks) to identify direct relationships among coexpression modules, AD traits and cognitive decline. (C) The disease relevance of top predicted genes were tested experimentally in an astrocyte and iPSC-induced neuron in vitro system.
Figure 2.
Figure 2.. Characterization of human cortical RNA-Seq data and their relation with AD traits and cellular processes.
(A) Figure shows the number of genes whose gene expression levels significantly associate with each of the five tested AD-related traits (0.05 FDR). Results are shown for association testing at the “gene level” and “transcript level” (isoform level). (B) This figure shows the enrichment of each of the 47 modules for cell-specific signature genes defined in mice (y-axis) (see Supplementary methods). The X-axis shows the signed association strength (signed -log10 pvalue) between each module and cognitive decline. Larger sized points (modules) are those that we deem to most strongly represent each of the four major brain cell types: neurons (m187), microglia (m116), oligodendrocytes (123), and astrocytes (m107) (see Supplementary methods for details). (C) Figure shows the association strength (quantified as negative log10 pvalue) between each of the 47 modules of coexpressed genes (visualized as vertical bars) and each of the five tested AD-related trait (x axis). The dashed line depicts the Bonferroni-adjusted significance threshold at the module-level (p<0.001). Only some of the modules that pass Bonferroni threshold are labeled, for visualization ease. (D) This figure shows the strength and direction of each module’s association (signed negative log10 pvalue) for association with a binary diagnosis of pathological AD (PathoAD) in our ROSMAP study on the y-axis. The x-axis shows the signed association strengths between each module and pathological AD in an existing microarray dataset (Zhang et al. dataset). Specifically, the modules are defined using the ROSMAP samples, and their definitions are projected onto the Zhang et al. study. The size of each point represents the size of each module (i.e., number of assigned genes). The color of the point is proportional to the significance of the association in a meta-analysis of the ROSMAP and Zhang modules (using the gradient shown in the upper left portion of the graph). The light orange boxes highlight those modules that are significantly associated with PathoAD diagnosis in the microarray (“Zhang”) dataset. The green box highlights the modules that are significantly associated with a PathoAD diagnosis in the ROSMAP data.
Figure 3.
Figure 3.. The AD network model prioritizes module 109 as being directly associated with cognitive decline.
(A) A directed acyclic graph (DAG), learned using Bayesian network structure learning, represents the relationships between modules (circles), cell type markers (specific modules, squares), and three relevant AD traits (B-amyloid, Tau-tangles, and CogDec)(diamonds). The thickness of the arrow is proportional to the number of times that a connection was detected (Supplementary methods). The color of the modules relates to annotations using the Gene Ontology database (see Table S5 for details); a color key is found at the upper right aspect of the image. (B) This figure shows the relation of high m109 expression level with more rapid cognitive decline. The two panels present trajectories of cognitive decline for people with low (left panel) or high (right panel) levels of m109 expression. On the left, the segmented light blue lines (“spaghetti plots”) show the annual global cognition scores for 50 randomly selected participants with low m109 expression level (1st quartile) to illustrate the nature the of the longitudinal cognitive data; the solid black line reports the trajectory of cognitive decline for a typical female participant with 85 years of age at the time of death, 15 years of education and mean expression level for the group (approximate to the 10th percentile of m109 expression). On the right panel, the red spaghetti plots show the annual global cognition scores for 50 randomly selected participants with high expression level (4th quartile), and superimposed in black is the model derived cognitive trajectory for a typical female participant with 85 years of age at the time of death, 15 years of education and mean expression level for the group (approximate to the 90th percentile). (C) This boxplot shows expression levels of module 109 (mean expression of genes assigned to m109) for individuals who have no cognitive impairment (NCI)(red), mild cognitive impairment (MCI)(green), or an AD diagnosis (AD)(blue). Each point represents one individual. (D) This boxplot shows expression level of module 109 for individuals without (red box) and with (turquoise box) amyloid deposition at autopsy. Each point represents one individual.
Figure 4.
Figure 4.. Identifying specific genes within m109 for experimental follow-up.
(A) This figure shows the estimated gene regulatory network (Bayesian Network) for 112 selected genes in module 109. Each gene is a node (circle) in the displayed graph. Colored nodes are those that are tested in our experimental systems (yellow: tested in both Astrocytes and iPSC-derived neurons (iN), blue: only tested in Astrocytes, orange: only tested in iNs). The size of each node is proportional to its node degree (total number of ingoing and outgoing edges per node). (B) This figure shows the coexpression values for the 112 genes shown in Figure 3A, highlighting the fact that there is sub-structure within the coexpression pattern of m109. Genes that are tested in our experimental systems are highlighted and are found in each subset of the correlation matrix.
Figure 5.
Figure 5.. INPPL1 and PLXNB1 knock down in human astrocytes significantly lowers Aβ42 levels.
Human primary astrocytes or iPSC-derived neurons (iNs) were transduced with a lentivirus encoding an shRNA construct targeting one of the selected m109 genes. Aβ42 levels were measured by ELISA in the conditioned media (CM) from successfully targeted cultures. The volcano plot in (A) summarizes the results of the discovery screen in which knockdown experiments were performed in both astrocytes (red dots) and iNs (black dots). Each dot is one construct, with the magnitude of its effect on Aβ42 secretion reported on the x-axis and the statistical significance of the construct’s effect on the y-axis. Dotted lines mark cut-offs for significant (after Bonferroni correction) and suggestive (defined as accepting 1 false positive in the experiment) results for the astrocyte experiments. (B) Replication study: results of INPPL1 and PLXNB1 knock down on Aβ42 secretion were measured in additional experiments using multiple shRNA constructs targeting each of these genes. Knockdown of amyloid precursor protein (APP), which yields the Aβ42 peptide, was performed in parallel for comparison. Each dot represents an individual experiment for a given construct, and the mean level of Aβ42 secretion for all of the instances of a given construct’s evaluation is presented as a solid bar with the 95% confidence interval. The dotted line denotes the mean level of secretion in all of the control experiments. (C) INPPL1 and PLXNB1 immunostaining was performed on a section of DLPFC from post-mortem human brain of a subject with AD. Co-labelling with ALDH1 (a marker specific for cortical astrocytes) was observed in a subset of cells that are labeled with either INPPL1 or PLXNB1. (D) Figure summarizes the proportion of variance in cognitive decline that is explained by different factors. First row (orange) shows the proportion of variance explained (PVE) by measures of amyloid and tau pathology that are captured by the structured post-mortem examination of each subject. The second row shows PVE where we use all 47 modules in addition to pathology (amyloid and tau): RNA data explains more of the variance in cognitive decline than is captured by the two key measures of AD pathology. The third row shows PVE by the m109 module alone (with amyloid and tau). Finally, the next three rows show PVE by INPPL1 and PLXNB1, alone and together. As shown, PLXNB1 and INPPL1 capture much but not all of the effect of m109, and they are largely redundant with each other.

References

    1. Hebert LE, Weuve J, Scherr PA & Evans DA Alzheimer disease in the United States (2010–2050) estimated using the 2010 census. Neurology 80, 1778–1783, doi:10.1212/WNL.0b013e31828726f5 (2013). - DOI - PMC - PubMed
    1. Cummings JL, Morstorf T & Zhong K Alzheimer’s disease drug-development pipeline: few candidates, frequent failures. Alzheimers Res Ther 6, 37, doi:10.1186/alzrt269 (2014). - DOI - PMC - PubMed
    1. Schneider JA, Arvanitakis Z, Leurgans SE & Bennett DA The neuropathology of probable Alzheimer disease and mild cognitive impairment. Annals of neurology 66, 200–208 (2009). - PMC - PubMed
    1. Lambert J-C et al. Meta-analysis of 74,046 individuals identifies 11 new susceptibility loci for Alzheimer’s disease. Nature genetics 45, 1452–1458 (2013). - PMC - PubMed
    1. Gaiteri C, Mostafavi S, Honey CJ, De Jager PL & Bennett DA Genetic variants in Alzheimer disease - molecular and brain network approaches. Nat Rev Neurol 12, 413–427, doi:10.1038/nrneurol.2016.84 (2016). - DOI - PMC - PubMed

Publication types

MeSH terms