. 2018 Sep;146(5):540-559.
doi: 10.1111/jnc.14466.

Synaptic activity induces input-specific rearrangements in a targeted synaptic protein interaction network

Affiliations

Synaptic activity induces input-specific rearrangements in a targeted synaptic protein interaction network

Jonathan D Lautz et al. J Neurochem. 2018 Sep.

Abstract

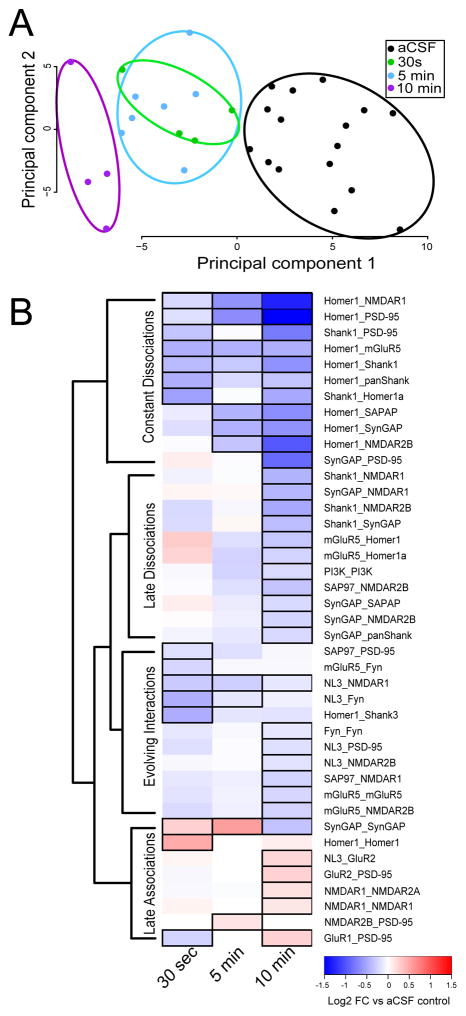
Cells utilize dynamic, network-level rearrangements in highly interconnected protein interaction networks to transmit and integrate information from distinct signaling inputs. Despite the importance of protein interaction network dynamics, the organizational logic underlying information flow through these networks is not well understood. Previously, we developed the quantitative multiplex co-immunoprecipitation platform, which allows for the simultaneous and quantitative measurement of the amount of co-association between large numbers of proteins in shared complexes. Here, we adapt quantitative multiplex co-immunoprecipitation to define the activity-dependent dynamics of an 18-member protein interaction network in order to better understand the underlying principles governing glutamatergic signal transduction. We first establish that immunoprecipitation detected by flow cytometry can detect activity-dependent changes in two known protein-protein interactions (Homer1-mGluR5 and PSD-95-SynGAP). We next demonstrate that neuronal stimulation elicits a coordinated change in our targeted protein interaction network, characterized by the initial dissociation of Homer1 and SynGAP-containing complexes followed by increased associations among glutamate receptors and PSD-95. Finally, we show that stimulation of distinct glutamate receptor types results in different modular sets of protein interaction network rearrangements, and that cells activate both modules in order to integrate complex inputs. This analysis demonstrates that cells respond to distinct types of glutamatergic input by modulating different combinations of protein co-associations among a targeted network of proteins. Our data support a model of synaptic plasticity in which synaptic stimulation elicits dissociation of pre-existing multiprotein complexes, opening binding slots in scaffold proteins and allowing for the recruitment of additional glutamatergic receptors. Open Science: This manuscript was awarded with the Open Materials Badge. For more information see: https://cos.io/our-services/open-science-badges/.

Keywords: SynGAP; glutamate signaling; homer; protein interaction network; quantitative multiplex immunoprecipitation; synapse.


Figures

Figure 1
Figure 1. Immunoprecipitation detected by flow cytometry can detect activity-dependent changes in PISCES
(A) Schematic of Homer1-mGluR5 complex immunoprecipitated by an anti-Homer1 IP antibody coupled to a latex bead, and subsequently probed with PE-conjugated anti-mGluR5 probe. (B) Primary cortical neurons were stimulated with high K+ (50 mM) aCSF for 5 minutes and activity-dependent changes in Homer1 and mGluR5 co-association were measured by immunoprecipitation detected by flow cytometry. Overlapping histograms displaying the PE fluorescence reading of each bead (N = 1000–2000 beads) indicate similar levels of total IP’d mGluR5, but the left-shifted histogram indicates less mGluR5-Homer1 co-association following KCl treatment. (C) MFI for N=3 biological replicates (mean ± SEM) mGluR5-mGluR5 and mGluR5-Homer1 co-association, normalized to total IP’d mGluR5. (D) IP-western results to confirm activity induced dissociation of Homer1 and mGluR5. Densitometry analysis was performed to quantify the relative amount of mGluR5 immunoprecipitated with Homer1. Results shown represent N=3 biological replicates (mean ± SEM), and are normalized to total IP’d Homer1,
Figure 2
Figure 2. KCL stimulation elicits network level changes in targeted PiSCES network
(A) For each experiment, primary neuron cultures plated from the same dissociated cell pool were treated, cell lysate was pooled from 3 wells for each biological replicate, and activation of ERK/MAPK signaling was confirmed by Western blotting from reserve lysate. (B) Multiprotein complexes were immunoprecipitated on Luminex microspheres coupled to IP antibodies. Unique bead/probe combos were identified by the ratio two dye of classifiers. Histograms shown are representative PE fluorescence readings of PiSCES that exhibited decreased intensity following 5-min stimulation. (C) QMI results were verified by traditional IP-western. (D) Principal component analysis showing separation of stimulated from unstimulated neurons along principal component 1 for N=8 biological replicates.
Figure 3
Figure 3. ANC analysis of QMI data following KCL stimulation
(A) Protein interactions identified by ANC analysis as statistically significant in > 70% of experiments for N=8 biolgocial replicates (mean ± SEM). (B) Comparison of the number of statistically significant ‘hits’ in 100% of experiments, versus the number of biological replicates. (C) Comparison of ANC-significant fold change values identified in two different N=4 experiments conducted over several weeks. Grey shading indicates ± 10% fold change, which is the approximate limit of detection for the QMI assay.
Figure 4
Figure 4. Activity-induced changes in the targeted PiSCES network
(A) Topological overlap matrix revealing two modules composed of PiSCES whose behavior was highly correlated with each other. Individual PiSCES comprising both modules are presented in Figure S3 (B) Module-trait relationship diagram showing the correlation value (top) and significance (bottom) of module eigenvalues with experimental number or treatment. (C) QMI map of individual fold-change differences significant by both statistical methods. Log2 fold changes in protein co-association were determined by comparing bead distributions in KCL vs. aCSF conditions for N=8 biological replicates. The thickness and color of lines connecting protein nodes indicate the direction and magnitude of the log2 fold-change.
Figure 5
Figure 5. The temporal dynamics of activity-induced changes in the targeted protein interaction network
(A) Principal component analysis of neurons stimulated for 30s, 5 or 10 minutes with high K+, showing separation from controls along principal component 1 for N=4 biological replicates. (B) Comparison of group-averaged Log2 fold change for all PISCES significant at any time point; black outline indicates interaction significant by both statistical methods.
Figure 6
Figure 6. NMDA and mGluR inputs produce distinct sets of modular rearrangements in PiSCES
(A–D). QMI maps showing network biosignatures for A. 100 μM glutamate, B. 1μM glutamate, C. 100μM NMDA+10μm Glycine, D. 100μm DHPG for N=4–8 biological replicates. (E) Principal component analysis showing separation of NMDA and mGluR treatment along opposing axes, with glutamate intermediate. (F) Topological overlap matrix with significant modules boxed as in Figure 4. (G) Module-trait matrix showing Turquoise module correlated with NMDA stimulation, and the Brown module correlated with DHPG.
Figure 7
Figure 7. Heatmap of activity dependent changes in PiSCES across input types
(A) The MFI of all PiSCES significant in any condition shown for each of N=24 experiments. Columns are ordered by treatment; PISCES are ordered by hierarchal clustering. Each box represents a single MFI value for N=24 experiments, normalized by row for visualization.

References

Works Cited

    1. Alarcon B, Swamy M, van Santen HM, Schamel WW. T-cell antigen-receptor stoichiometry: pre-clustering for sensitivity. EMBO Rep. 2006;7:490–495. - PMC - PubMed
    1. Araki Y, Zeng M, Zhang M, Huganir RL. Rapid dispersion of SynGAP from synaptic spines triggers AMPA receptor insertion and spine enlargement during LTP. Neuron. 2015;85:173–189. - PMC - PubMed
    1. Bashir ZI, Bortolotto ZA, Davies CH, et al. Induction of LTP in the hippocampus needs synaptic activation of glutamate metabotropic receptors. Nature. 1993;363:347–350. - PubMed
    1. Beattie EC, Carroll RC, Yu X, Morishita W, Yasuda H, von Zastrow M, Malenka RC. Regulation of AMPA receptor endocytosis by a signaling mechanism shared with LTD. Nat Neurosci. 2000;3:1291–1300. - PubMed
    1. Cao FF, Xu LM, Zhang X, Wang Y, Li MQ, Uzan G, Peng B, Zhang DH. IP-FCM platform detects the existence and regulator-caused dissociation of components in naturally assembled HSP90 complex. Cytometry A. 2014;85:359–367. - PubMed

In Revision

    1. Neier SC, Smith SE, Wilton KM, et al. The proximal AB TCR signalosome instructs thymic selection through a quantitative protein interaction network. Science Immunology In Revision. - PMC - PubMed

Publication types

MeSH terms

LinkOut - more resources