. 2018:144:165-184.
doi: 10.1016/bs.mcb.2018.03.007. Epub 2018 Apr 10.

Measuring mitotic forces

Affiliations

Measuring mitotic forces

Anna A Ye et al. Methods Cell Biol. 2018.

Abstract

Productive chromosome movements require that a large multiprotein complex called the kinetochore assemble on sister centromeres. The kinetochore fulfills two critical functions as (1) the physical linkage between chromosomes and spindle microtubules and (2) a mechanomolecular sensor that relays a spindle assembly checkpoint signal delaying anaphase onset until chromosomes are attached to spindle microtubules and bioriented. Given its central roles in such a vital process, the kinetochore is one of the most important force-transducing structures in cells; yet it has been technically challenging to measure kinetochore forces. Barriers to measuring cellular forces have begun to be broken by the development of fluorescence-based tension sensors. In this chapter, two methods will be described for measuring kinetochore forces in living cells and strategies for applying these sensors to other force-transducing processes and molecules will be discussed.

Keywords: Force; Kinetochore; Meiosis; Microtubules; Mitosis; Tension.


Figures

Figure 1.
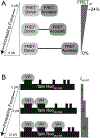
Figure 1.. Schematic of the two FRET reporters described in this chapter.
(A) The TSMod tension sensor reports on a force range between 1–6 pN. The reporter is FRET-based and works via force-dependent extension of a central linker positioning the FRET pairs such that the reporter exhibits a graded reduction in FRET efficiency from ~24% at zero force to 0% at ≥6pN. (B) The Talin Rod (TR)-Vinculin Head (VH)-based reporter incrementally increases in fluorescence intensity over a force range of 2–12 pN as the application of force exposes additional binding sites in the TR domain to which fluorescent protein (FP)-tagged VH can associate.
Figure 2.
Figure 2.. Protein disorder and sensor design strategies.
(A) Schematic of the linker protein CENP-C in which the two sensors were inserted to study kinetochore forces in D. melanogaster cells. (B) The PSIPRED protein sequence analysis workbench (Buchan, et al., 2013) predicts the central ~1200 amino acids of CENP-C are highly disordered. (C) The disorder prediction aggregator at the database of disordered protein predictions (D2P2) (Oates, et al., 2013) allows the user to type in a search term and lists results of IDR-containing proteins sorted by species. In this example, one of the hits for the search “CENP” in D. melanogaster is the protein CENP-C. The results of the search show the predictions of nine separate disorder predictors and a color-coded disorder agreement bar to highlight consensus amongst the predictors across all the amino acid positions. The example shows the D2P2 results for the span of CENP-C highlighted in the boxed region of the trace in B. (D) Outline of tension sensor (TS) design using TagRFP-T-tagged CENP-C as an example. The internal tension sensor is inserted into the intrinsically disordered region (IDR) of the force-transducing component CENP-C. The control requires placement of the tension sensor at the C-terminus although the N-terminus could also be used. (E) Two reference protein design strategies for the TR-VH-based reporter.
Figure 3.
Figure 3.. Background correction techniques.
(A) Equations for the region-in-region adapted from (Hoffman, Pearson, Yen, Howell, & Salmon, 2001) and the duplicate region background correction methods. (B) Examples of a metaphase and interphase cell expressing the CENP-C internal TSMod reporter. The asterisks denote the position of the spindle poles in the metaphase cell and the nucleus is outlined in the interphase cell. The mTurquoise2 (donor) and FRET (CFP excitation, YFP emission) channels are shown because the background corrected intensities from these two channels will be used to calculate the FRET emission ratio. Dashed boxes highlight the regions shown in the zoomed images in C and D. (C) Sample region-in-region background corrections and calculation of FRET emission ratios. The inner region (R1) should capture the entirety of the signal from the kinetochore/centromere of interest while the larger region (R2) must encompass the smaller region, but not signal from neighboring structures. While boxes are shown in these examples, we have found that freely drawn concentric regions of any shape sufficient to capture the structure (smaller region) and representative surrounding pixels (larger region) yields fine results. In this example the FRET emission ratios of metaphase (1.69) versus interphase (2.08) are indicative of the TSMod reporter experiencing lower tension in interphase and higher tension in metaphase. (D) Sample duplicate region background corrections and calculation of FRET emission ratios of the same structures analyzed in C. In this method an identical background region (R1) as the region drawn around the kinetochore/centromere of interest (R2) is placed in the cytosol/nucleoplasm in close proximity to R2 avoiding nearby structures. In these examples, the two methods yield nearly identical FRET emission ratios. Nonetheless, we favor the use of the region-in-region method for data analyses in which multiple structures are measured in a single image as this technique yields an accurate measurement of local pixel background intensities around each individual structure. If using the duplicate method a single background region should not be used to correct for structures that are microns apart as local background pixel intensities may vary throughout the cell. Thus, we typically use the duplicate region method when a small number of closely situated structures will be analyzed in an image.
Figure 4.
Figure 4.. Interpreting results from reporter ensembles.
Model ensembles are envisioned for a single microtubule (MT) with twelve CENP-C linkers containing the (A) internal TSMod or (B) internal TR-VH reporter. (A) The approximate FRET efficiencies for a TSMod under 0 pN, 1.5 pN and ≥6 pN are 24%, 20% and 0% respectively. A mean FRET efficiency of ~20% was measured for metaphase cells expressing the internal TSMod CENP-C. This result could reflect even distribution of force through all linkers such that each sensor experiences 1.5 pN. Alternatively, a comparable result could be attained from a highly asymmetric distribution of forces in which 10 linkers are under zero tension and 2 linkers experience forces ≥6 pN. While there are many combinations of force distributions between these two extremes, we favor scenarios closer to the even distribution end of the spectrum. (B) The number of FP-tagged VHs bound to the TR reporter increases, above a baseline of 1 VH-FP, incrementally over a force range of 2–12 pN. A mean VH per TR of 1.3 was measured for metaphase cells expressing the internal TR CENP-C. This value could be a consequence of one of three different scenarios: 1) four linkers under moderate force (2–7 pN), 2) two linkers under moderate force and one linker under high force (7–12 pN), or 3) two linkers under high force. Determining the true physiological condition is further complicated by the fact that each kinetochore binds an average of 11 MTs in Drosophila S2 cells (Maiato et al., 2006) meaning an ensemble of ensembles is being measured at each kinetochore. Thus, it is possible that in the same kinetochore one MT could be generating higher forces than the overall mean estimate while a neighboring MT generates comparatively low/no forces.

References

    1. Bhattacharyya B, & Wolff J (1974). Promotion of fluorescence upon binding of colchicine to tubulin. Proc Natl Acad Sci U S A, 71(7), 2627–2631. - PMC - PubMed
    1. Buchan DW, Minneci F, Nugent TC, Bryson K, & Jones DT (2013). Scalable web services for the PSIPRED Protein Analysis Workbench. Nucleic Acids Res, 41(Web Server issue), W349–357. doi: 10.1093/nar/gkt381 - DOI - PMC - PubMed
    1. Ciferri C, Pasqualato S, Screpanti E, Varetti G, Santaguida S, Dos Reis G, … Musacchio A (2008). Implications for kinetochore-microtubule attachment from the structure of an engineered Ndc80 complex. Cell, 133(3), 427–439. doi: 10.1016/j.cell.2008.03.020 - DOI - PMC - PubMed
    1. Critchley DR, & Gingras AR (2008). Talin at a glance. J Cell Sci, 121(Pt 9), 1345–1347. doi: 10.1242/jcs.018085 - DOI - PubMed
    1. del Rio A, Perez-Jimenez R, Liu R, Roca-Cusachs P, Fernandez JM, & Sheetz MP (2009). Stretching single talin rod molecules activates vinculin binding. Science, 323(5914), 638–641. doi: 10.1126/science.1162912 - DOI - PMC - PubMed

LinkOut - more resources