. 2018 Jun 4;45(5):580-594.e7.
doi: 10.1016/j.devcel.2018.04.025. Epub 2018 May 24.

Distant Insulin Signaling Regulates Vertebrate Pigmentation through the Sheddase Bace2

Affiliations

Distant Insulin Signaling Regulates Vertebrate Pigmentation through the Sheddase Bace2

Yan M Zhang et al. Dev Cell. .

Abstract

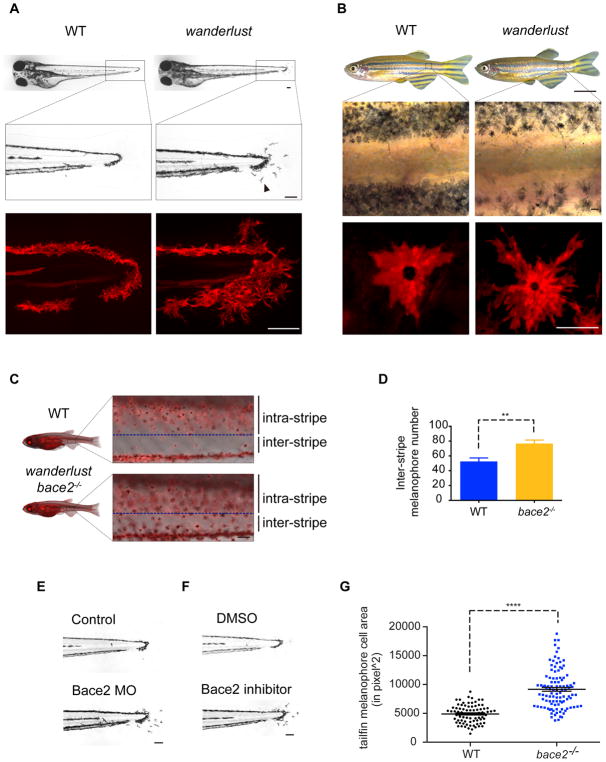
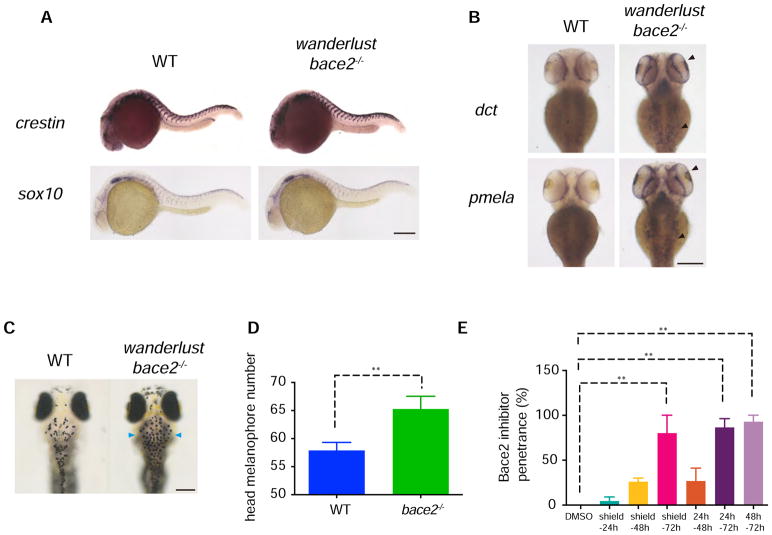
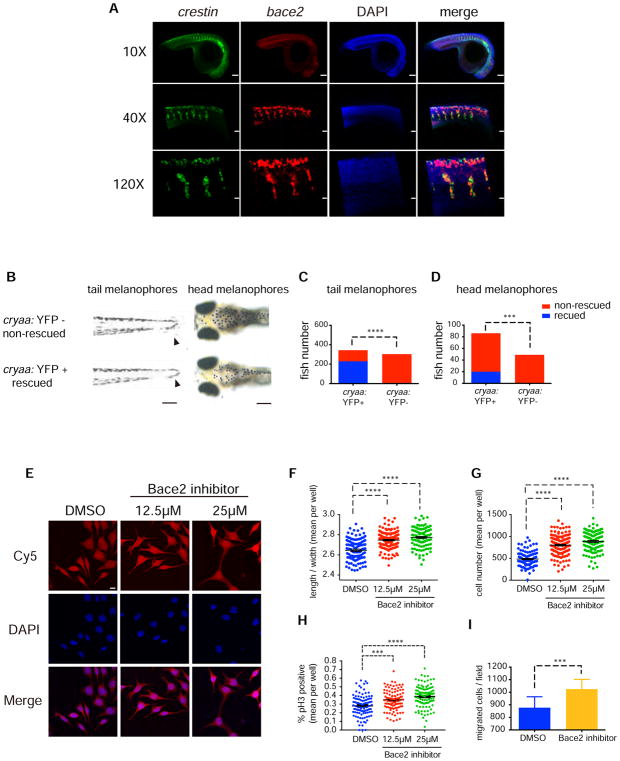
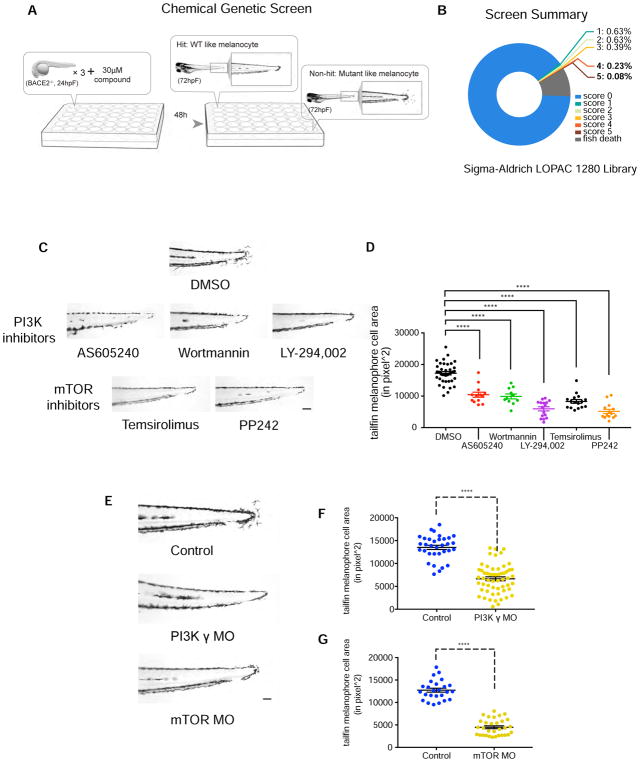
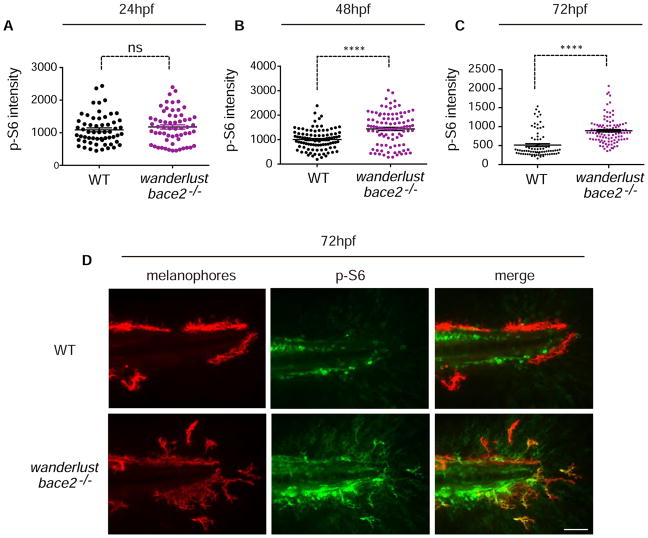
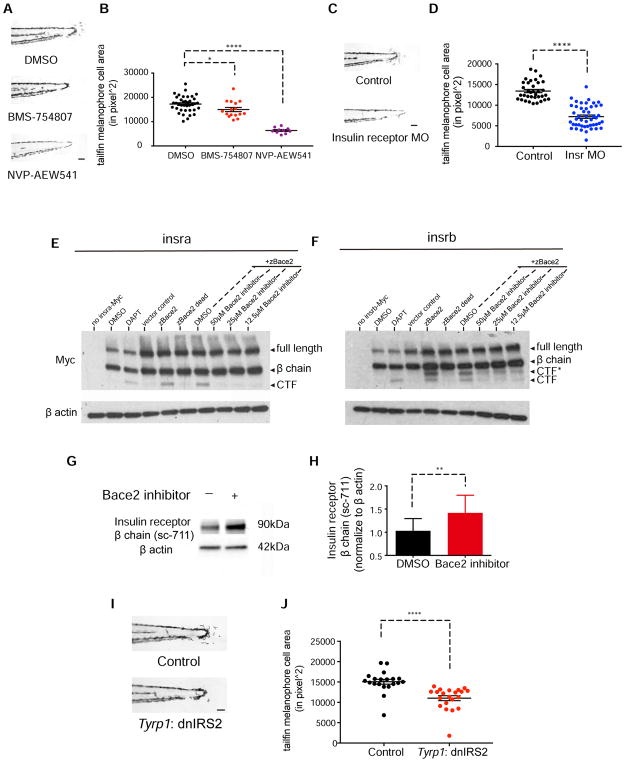
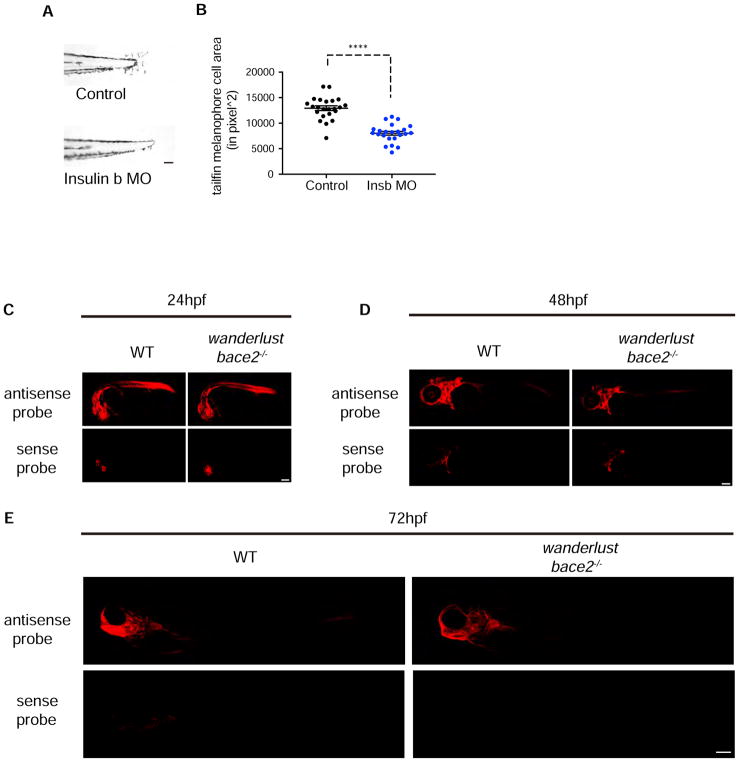
Patterning of vertebrate melanophores is essential for mate selection and protection from UV-induced damage. Patterning can be influenced by circulating long-range factors, such as hormones, but it is unclear how their activity is controlled in recipient cells to prevent excesses in cell number and migration. The zebrafish wanderlust mutant harbors a mutation in the sheddase bace2 and exhibits hyperdendritic and hyperproliferative melanophores that localize to aberrant sites. We performed a chemical screen to identify suppressors of the wanderlust phenotype and found that inhibition of insulin/PI3Kγ/mTOR signaling rescues the defect. In normal physiology, Bace2 cleaves the insulin receptor, whereas its loss results in hyperactive insulin/PI3K/mTOR signaling. Insulin B, an isoform enriched in the head, drives the melanophore defect. These results suggest that insulin signaling is negatively regulated by melanophore-specific expression of a sheddase, highlighting how long-distance factors can be regulated in a cell-type-specific manner.

Keywords: PI3K; bace2; insulin; insulin receptor; mTOR; melanocyte; melanophore; pigment patterning; zebrafish.


Conflict of interest statement

DECLARATION of INTEREST

The authors declare no competing interests.

Figures

Figure 1
Figure 1. The zebrafish wanderlust mutant has hyperdendritic melanophores due to a loss of Bace2
(A) Brightfield imaging shows that the wanderlust melanophores are hyperdendritic compared to WT fish (arrowhead) in the tail fin at 72hpf. Labeling of the melanophore cell membranes (bottom panel) using the Tg(tyrp1b: membrane-mCherry) line demonstrates that this is due to a change in cell morphology rather than a redistribution of melanin. (B) These hyperdendritic melanophores are maintained into adulthood, and yield irregular stripe boundaries (arrowhead). (C–D) wanderlust mutants develop melanophores outside of the stripe during metamorphosis at 24 days post fertilization (dpf) (arrowhead). Inter-stripe melanophores number are quantified in (D); fish number: n(WT)=5, n(wanderlust)=5, two-tailed t test, **P<0.01. (E–F) Bace2 loss of function using morpholino knockdown (E) or pharmacological inhibition (F) phenocopies the wanderlust mutant. WT embryos are treated with Bace2 inhibitor (PF-06663195, 100μM) from 48–72hpf. (G) bace2−/− melanophores have larger cell area in the tail fin at 72hpf. Melanophore cell area is defined as the surface area covered by melanophores in the tailfin. Data are from five independent experiments, with total fish numbers: n(WT)=80, n(bace2−/−)=105, two-tailed t test, ****P<0.0001. All bar graphs are presented as mean ± s.e.m. Scale bars, 100μM (A, B middle and bottom panel, C, E, F), 0.5cm (B top panel). See also Figure S1.
Figure 2
Figure 2. Bace2 acts during melanophore differentiation
(A) At 24hpf, ISH shows the bace2−/− mutants have unaffected expression for neural crest markers crestin and sox10. (B) But at 72hpf, ISH shows mRNA for the pigmentation genes dct and pmela are elevated in bace2−/− mutants, especially in the head (arrowhead). (C–D) Consistently, bace2−/− mutants have increased numbers of pigmented melanophores in the head (arrowhead). Fish number n(WT)=55, n(bace2−/−)=30, two-tailed t test, **P<0.01. (E) Treatment of WT embryos with 100μM Bace2 inhibitor (PF-0666195) from 48–72 hpf is sufficient to phenocopy bace2−/−. Data are from two independent experiments, with total fish numbers: n(DMSO)=21, n(shield-24h)=45, n(shield-48h)=56, n(shield-72h)=72, n(24h–48h)=58, n(24h–72h)=40, n(48h–72h)=49; One-way ANOVA followed by Holm-Sidak’s multiple comparisons test, **P<0.01. All bar graphs are presented as mean ± s.e.m. Scale bars, 200μM. See also Figure S1 and Figure S2.
Figure 3
Figure 3. Bace2 acts cell-intrinsically within the melanophore lineage
(A) At 24hpf in WT embryos, double fluorescent ISH against the pan neural crest marker crestin (green) and bace2 (red) shows bace2 expression overlaps with crestin, suggesting bace2 is highly enriched in the neural crest lineage from which the melanophores are derived. (B–D) Melanophore-specific transgenic rescue of the bace2−/− mutant. A stable transgenic line was created in which the dct promoter drives Bace2 in the melanophores (along with a cryaa: YFP transgene marker). Founders were identified by expression of the YFP marker in the eye. Founders were crossed into other uninjected bace2−/− adult to generate F1 embryos. F1 embryos were scored for dendritic tail melanophore rescue at 3dpF (B, arrowhead) or for rescue of the head melanophores at 5dpF. F1 were divided into four groups: rescued, non-rescued, YFP positive and YFP negative. Chi-square with Yate’s correction was performed to associate rescue phenotype with YFP positive eye (quantified in C and D). ***P<0.001, ****P<0.0001. (E–G) The zebrafish melanoma cell line ZMEL1 was treated with 12.5μM or 25μM of the Bace2 inhibitor PF-06663195 for 72 hours, and resulted in hyperdendritic cells (arrowhead) similar to what was seen in vivo. A representative field of cells is shown in (E) and dendricity is quantified as an increase in cell length to width ratio (F), along with an increase in overall cell number (G). Data are from three independent experiments, one-way ANOVA followed by Holm-Sidak’s multiple comparisons test, ****P<0.0001. (H) The increased cell number induced by Bace2 inhibitor is due to increased ZMEL1 cell proliferation, as measured by increased phospho-histone H3 (pH3) immunostaining. Data are from three independent experiments, one-way ANOVA followed by Holm-Sidak’s multiple comparisons test, ***P<0.001, ****P<0.0001. (I) ZMEL1 treated with 25μM of the Bace2 inhibitor PF-06663195 for 48 hours have increased migration in Transwell assay. Data are from five independent experiments, two-tailed t test, ***P<0.001. All bar graphs are presented as mean ± s.e.m. Scale bars, 10 μM (A 120X, E), 30uM (A 40X), 100μM (A 10X, B left panel), 200μM (B right panel).
Figure 4
Figure 4. Bace2 regulates melanophore dendricity via PI3K/mTOR signaling
(A) Scheme for chemical suppressor screen of the bace2−/− mutant. 24hpf bace2−/− embryos were treated with each compound from the Sigma LOPAC 1280 library at 30μM for 48 hours, in order to identify chemicals which could rescue the melanophore defects. (B) Compounds were scored with a range of 0 (non-rescued, mutant-like) to 5 (fully rescued, WT-like). (C) Top hits from the screen (with score of 4 and 5) converge on PI3K/mTOR signaling pathway. PI3K inhibitors AS605240 (110nM), Wortmannin (230nM), LY-294,002 (15μM), and mTOR inhibitors Temsirolimus (30μM), PP242 (15μM) all fully rescue the bace2−/− hyperdendritic melanophores. (D) Quantification of tailfin melanophore cell area at 72hpf with hits from the screen (n=each fish, one-way ANOVA followed by Holm-Sidak’s multiple comparisons test, ****P<0.0001). (E–G) Morpholinos knockdown of the PI3K γ isoform and mTOR in bace2−/− mutants rescue the phenotype analogous to what is seen with compounds from the screen, and the resulting tailfin melanophore cell area is quantified in (F) and (G). The data are from three independent experiments. Uninjected bace2−/− siblings (Control) are scored in the same manner, two-tailed t test, ****P<0.0001. All bar graphs are presented as mean ± s.e.m. Scale bar, 100μM. See also Figure S3, Figure S4 and Figure S5.
Figure 5
Figure 5. bace2−/− mutants have increased PI3K/mTOR activity
Immunostaining against phospho-S6 ribosomal protein(p-S6), a downstream readout of PI3K/mTOR activity, shows elevated p-S6 signal that overlaps with fluorophore-labelled melanophores at 48hpf (B) and 72hpf (C). A representative pictures of 72hpf is shown in (D) and overlapping signals are marked by arrowhead. The data are from three (A), five (B) and five (C) independent experiments, two-tailed t test, ****P<0.0001, ns=not significant. All bar graphs are presented as mean ± s.e.m. Scale bar, 50μM.
Figure 6
Figure 6. The insulin receptor is a substrate for Bace2 and regulates melanophore dendricity
(A–B) Inhibition of the insulin receptor in bace2−/− embryos using the insulin receptor inhibitors BMS-754807 (7.5μM) and NVP-AEW541 (60μM) rescue the hyperdendritic melanophores in the mutant, quantified in (B). bace2−/− embryos are treated from 24–72hpf, and the data are from three independent experiments. One-way ANOVA followed by Holm-Sidak’s multiple comparisons test, *P<0.1, ****P<0.0001. (C–D) Morpholino knockdown of insulin receptor (Insr) in bace2−/− embryos rescues the hyperdendritic melanophores, quantified in (D). Insra and insrb morpholinos were co-injected into bace2−/− embryos to deplete all insulin receptors. The data are from three independent experiments, two-tailed t test, ****P<0.0001. (E–F) Bace2 cleaves the insulin receptor. Expression of zebrafish Insra-Myc (E) and Insrb-Myc (F) fusion protein in HEK 293T cells give rise to full length insulin receptor and the β chain. Inhibition of γ secretase using DAPT (2μM, 24 hours treatment) prevents the CTF from being cleaved, leading to CTF accumulation. Expression of zebrafish Bace2 (zBace2) on top of the Insra-Myc fusion protein leads to production of single CTF band (E). zBace2 addition leads to the production of two fragments from Insrb-Myc, one that migrates similarly to the CTF and additional larger fragment designated as CTF* (F). This is not seen with the enzymatic dead version of Bace2 (zBace2 dead) or after Bace2 inhibition with PF-06663195 (24 hours treatment). zBace2 dead was constructed by site-mutagenesis of two conserved catalytic sites aspartic acids into alanines (D98A and D292A). (G–H) Bace2 inhibition with PF-06663195 (25μM, 24 hours treatment) in ZMEL1 cells, which normally express both Bace2 and the insulin receptor, leads to accumulation of endogenous insulin receptor β chain, quantified in (H). The data are from five independent experiments, two-tailed t test, **P<0.01. (I–J) Melanophore-specific inhibition of insulin signaling in bace2−/− mutants rescues melanophores hyperdendricity in the tail fin. A mosaic F0 transgenic line was created in which the fugu tyrp1 promoter drives dominant negative insulin receptor substrate 2 (dnIRS2) fused to EGFP in the melanophores (along with a cmlc2: mCherry transgene marker). At 72hpf, tailfin melanophore cell area was quantified in uninjected control (Control) and transgene-positive injected embryos (J). The data are from three independent experiments, two-tailed t test, ****P<0.0001. All bar graphs are presented as mean ± s.e.m. Scale bar, 100μM. See also Figure S5 and Figure S6.
Figure 7
Figure 7. Insulin b is the upstream ligand that drives melanophore dendricity in wanderlust
(A–B) Morpholino knockdown of the ligand insulin B (insb) in bace2−/− embryos rescues the hyperdendritic melanophores, quantified in (B). The data are from three independent experiments, two-tailed t test, ****P<0.0001. (C–E) Fluorescent ISH shows zebrafish insb ligand mRNA is initially expressed ubiquitously at 24hpf and then restricted to the head/brain region (arrowhead) in bace2−/− embryos at 48–72hpf, sense probe controls for background signal. All bar graphs are presented as mean ± s.e.m. Scale bar, 100μM (A), 150μM (C, D), 200 μM (E). See also Figure S5 and S7.

Comment in

Similar articles

Cited by

References

    1. Abdel-Malek Z, Swope VB, Suzuki I, Akcali C, Harriger MD, Boyce ST, Urabe K, Hearing VJ. Mitogenic and melanogenic stimulation of normal human melanocytes by melanotropic peptides. Proc Natl Acad Sci USA. 1995;92:1789–1793. - PMC - PubMed
    1. Baynash AG, Hosoda K, Giaid A, Richardson JA, Emoto N, Hammer RE, Yanagisawa M. Interaction of endothelin-3 with endothelin-B receptor is essential for development of epidermal melanocytes and enteric neurons. Cell. 1994;79:1277–1285. - PubMed
    1. van Bebber F, Hruscha A, Willem M, Schmid B, Haass C. Loss of Bace2 in zebrafish affects melanocyte migration and is distinct from Bace1 knock out phenotypes. J Neurochem. 2013;127:471–481. - PubMed
    1. Bravo DA, Gleason JB, Sanchez RI, Roth RA, Fuller RS. Accurate and efficient cleavage of the human insulin proreceptor by the human proprotein-processing protease furin. Characterization and kinetic parameters using the purified, secreted soluble protease expressed by a recombinant baculovirus. J Biol Chem. 1994;269:25830–25837. - PubMed
    1. Brou C, Logeat F, Gupta N, Bessia C, LeBail O, Doedens JR, Cumano A, Roux P, Black RA, Israël A. A novel proteolytic cleavage involved in Notch signaling: the role of the disintegrin-metalloprotease TACE. Mol Cell. 2000;5:207–216. - PubMed

Publication types

MeSH terms