. 2018 Jun 1;22(6):879-892.e6.
doi: 10.1016/j.stem.2018.05.003. Epub 2018 May 24.

An ERK-Dependent Feedback Mechanism Prevents Hematopoietic Stem Cell Exhaustion

Affiliations

An ERK-Dependent Feedback Mechanism Prevents Hematopoietic Stem Cell Exhaustion

Christian Baumgartner et al. Cell Stem Cell. .

Abstract

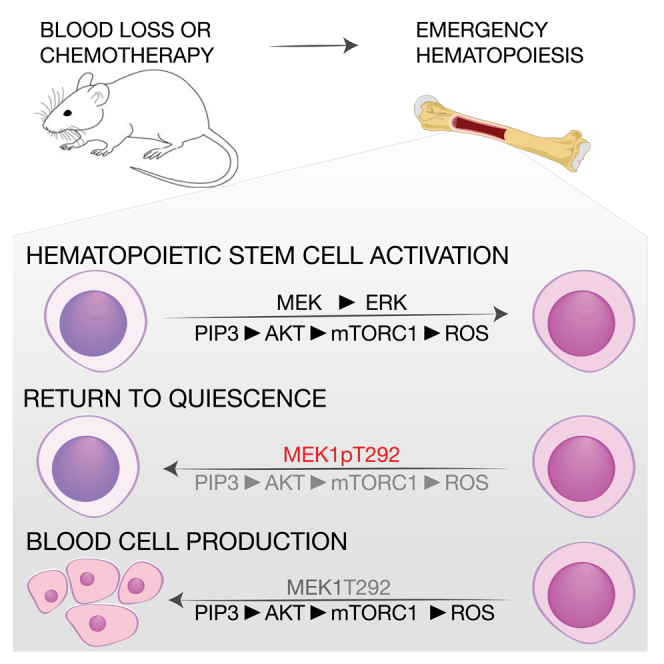
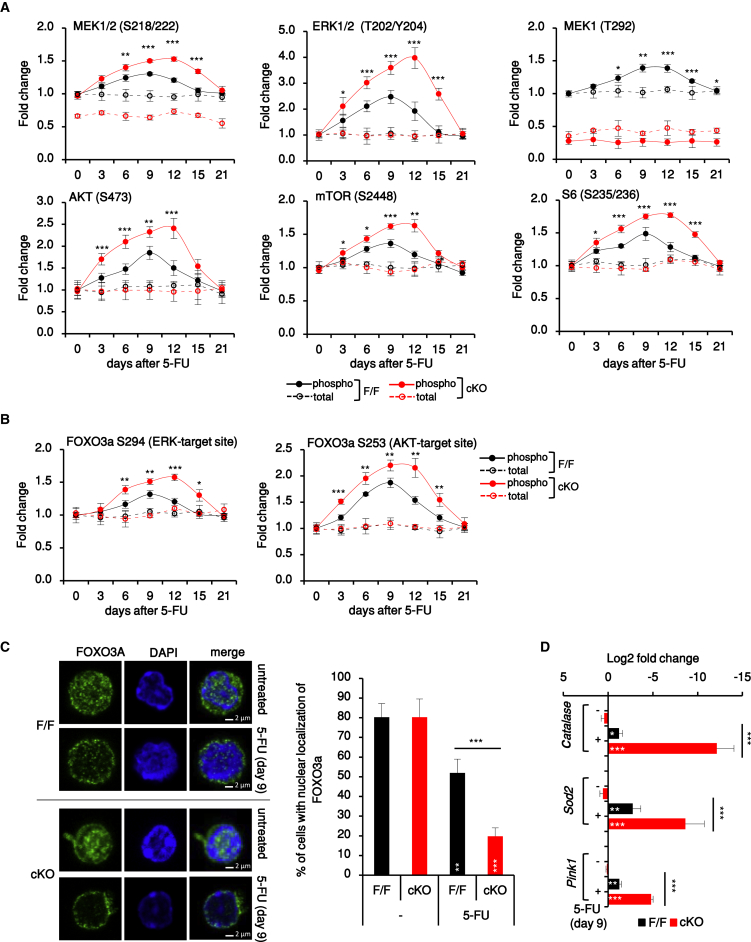
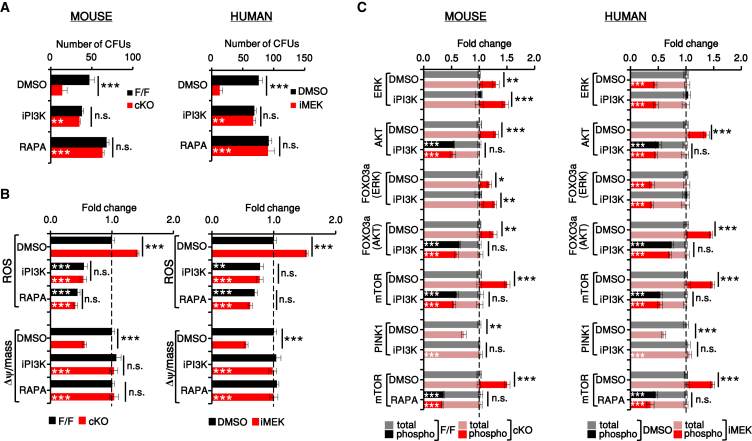
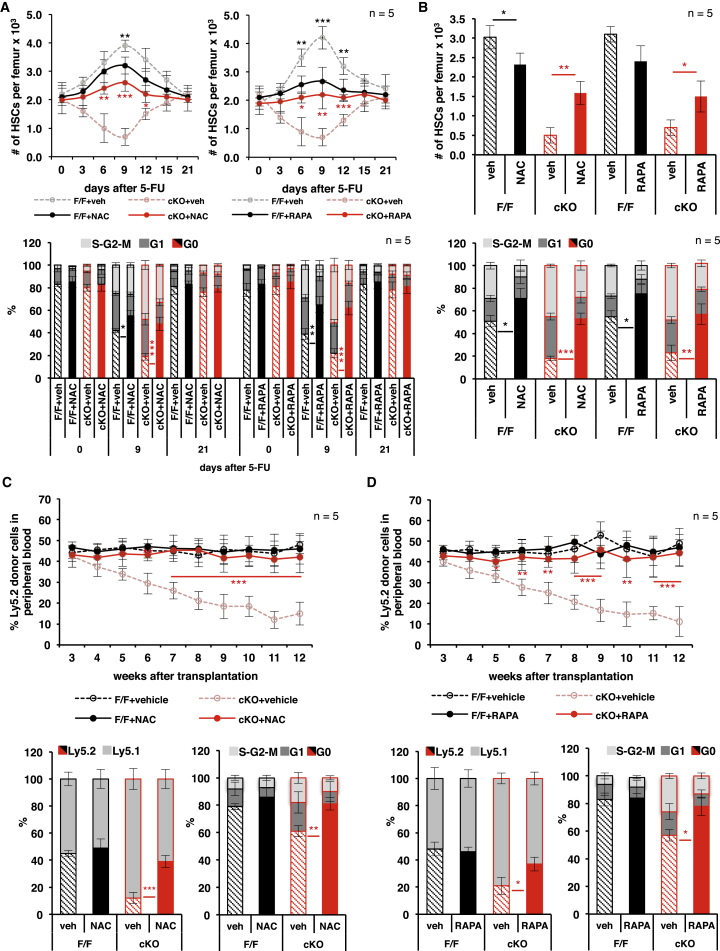
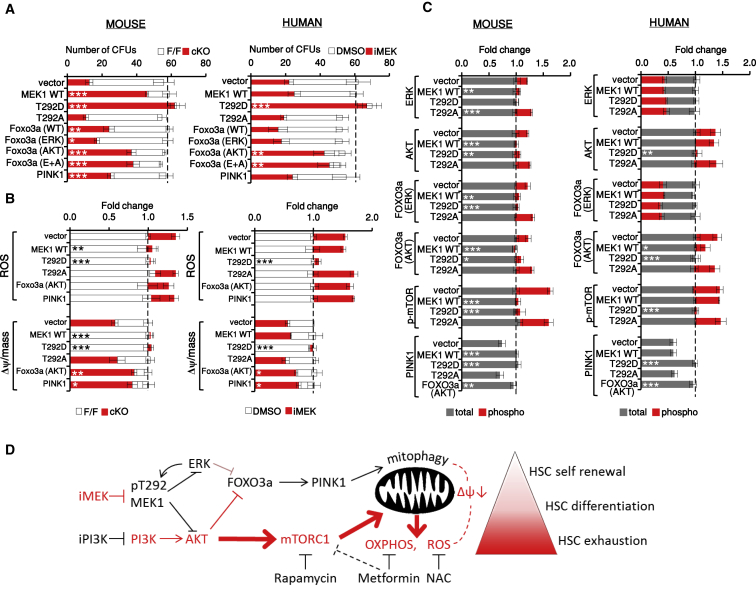
Hematopoietic stem cells (HSCs) sustain hematopoiesis throughout life. HSCs exit dormancy to restore hemostasis in response to stressful events, such as acute blood loss, and must return to a quiescent state to prevent their exhaustion and resulting bone marrow failure. HSC activation is driven in part through the phosphatidylinositol 3-kinase (PI3K)/AKT/mTORC1 signaling pathway, but less is known about the cell-intrinsic pathways that control HSC dormancy. Here, we delineate an ERK-dependent, rate-limiting feedback mechanism that controls HSC fitness and their re-entry into quiescence. We show that the MEK/ERK and PI3K pathways are synchronously activated in HSCs during emergency hematopoiesis and that feedback phosphorylation of MEK1 by activated ERK counterbalances AKT/mTORC1 activation. Genetic or chemical ablation of this feedback loop tilts the balance between HSC dormancy and activation, increasing differentiated cell output and accelerating HSC exhaustion. These results suggest that MEK inhibitors developed for cancer therapy may find additional utility in controlling HSC activation.

Keywords: AKT/mTORC1 pathway; ERK pathway; emergency hematopoiesis; feedback regulation of signaling; hematopoietic stem cell activation; hematopoietic stem cell exhaustion; hematopoietic stem cells; intracellular signaling; mitochondrial fitness; oxidative stress.


Figures

None
Graphical abstract
Figure 1
Figure 1
MEK1 Ablation Increases HSC Proliferation and Differentiation, Leading to HSC Exhaustion (A) Serial transplantation protocol. (B and C) Blood chimerism (left), lineage distribution (center) in peripheral blood, BM cellularity, and HSC chimerism in lethally irradiated recipients reconstituted with F/F, CRE+, or cKO BM analyzed during the first (B) or second (C) round of transplantation. (D) Repetitive (rep) 5-FU treatment protocol. (E) HSCs per femur, lineage+ cells per femur, and peripheral blood parameters (Hb, hemoglobin; PLT, platelets; WBC, white blood cells) during repetitive 5-FU treatment. (F) Kaplan-Meier survival curve. Median survival time (MST): F/F = 84 days; MEK1-cKO = 39 days; p < 0.001 according to the log rank (Mantel-Cox) test. (G) Colony-forming units (CFUs) and % lineage+ cells derived from HSCs in LTC. (H) Cell cycle distribution of HSCs harvested 12 weeks after transplantation (Transpl), 12 days after the third 5-FU injections (rep 5-FU), or after 6 weeks in LTC. Error bars represent the SD of the mean. p < 0.05, ∗∗p < 0.01, and ∗∗∗p < 0.001 comparing CRE+ or F/F to cKO. See also Figure S1.
Figure 2
Figure 2
MEK1 Ablation Delays Return to Quiescence during Recovery from a Single 5-FU Injection and Promotes the Expression of Cell Cycle and OXPHOS Genes (A–C) BM cellularity and HSCs per femur (A), HSC cell cycle distribution (B), and blood parameters (C) during the recovery from 5-FU injection. (D and E) Heatmap (D) and scatterplots (E) of genes differentially expressed in F/F and cKO HSCs from untreated or 5-FU-treated mice (9 days prior isolation). Blue, increased expression in F/F HSCs; red, increased expression in cKO HSCs. (F) qRT-PCR of selected cell cycle and OXPHOS genes in FAC-sorted HSCs. Data are normalized to expression levels in F/F HSCs from untreated mice (dotted line). Error bars represent the SD of the mean. p < 0.05, ∗∗p < 0.01, and ∗∗∗p < 0.001 comparing CRE+ or F/F to cKO. White asterisks, comparison of 5-FU-treated versus untreated animals of the same genotype. See also Figure S2 and Table S1 for a complete gene list.
Figure 3
Figure 3
MEK1 Ablation HSCs Promote Oxidative Stress and Decrease Mitophagy in HSCs (A) ROS levels in HSCs recovering from 5-FU injection. (B) Representative FACS histograms of ROS levels in HSCs exposed to chronic stress as in Figure 1. Values represent mean fluorescence intensity (MFI) ± SD. (C) Kaplan-Meier survival curve of mice. MST: F/F = 93 days; cKO = 39 days; F/F + NAC = 92 days; cKO + NAC = 65 days. ∗∗p < 0.01 according to the log rank (Mantle-Cox) test; n = 10. (D and E) Mitochondrial mass (Mitotracker Green, D, and Δψ per mitochondrial mass, E) in HSCs isolated from mice exposed to stress or grown in LTC. (F) FACS analysis of PINK1 protein levels in HSCs. (G) Representative confocal images and quantification of the co-localization of mitochondria (TOM20+) and lysosomes (LAMP1+) in HSCs exposed to a single 5-FU injection (9 days before isolation) and chronic stresses as defined in the legend to Figure 1. Error bars represent the SD of the mean. p < 0.05, ∗∗p < 0.01, and ∗∗∗p < 0.001. White asterisks, comparison of 5-FU-treated versus untreated animals of the same genotype. See also Figure S3.
Figure 4
Figure 4
The MEK/ERK and AKT Pathways Are Transiently Activated in HSCs Recovering from Myeloablation (A and B) Expression and phosphorylation of (A) MEK, ERK, AKT, and mTORC1 (mTOR and S6) and (B) FOXO3A (ERK and AKT target sites) in HSCs recovery from 5-FU (n = 25, 5 experiments, 5 animals each). Data represent fold change relative to untreated F/F HSCs. Phosphorylation of most molecules increased significantly in F/F HSCs from days 6 to 12 (p < 0.001; in the case of phospho-S6 from days 3 to 9 comparing treated versus untreated F/F). (C) Representative confocal images and percentage of FAC-sorted HSCs with FOXO3A nuclear localization. Scale bars, 2μm. (D) FOXO3A target gene expression in HSCs from untreated and 5-FU-treated animals. In (C) and (D), n = 4. Error bars represent the SD of the mean. p < 0.05, ∗∗p < 0.01, and ∗∗∗p < 0.001 comparing F/F versus cKO. White asterisks, treated versus untreated animals of the same genotype. See also Figure S4.
Figure 5
Figure 5
Increased AKT and mTORC1 Activity Underlie the Phenotype of MEK1-Deficient or MEK-Inhibited HSCs Mouse F/F and cKO HSCs and DMSO or iMEK-treated human HSCs were treated with LY294002 (iPI3K) or rapamycin (RAPA; mTORC1 inhibitor) in LTC. (A) After 6 weeks, cells were harvested and their ability to form colonies was determined in a 10-day CFU assay in the absence of inhibitors. (B and C) ROS levels and Δψ per mitochondrial mass (B) and intracellular signaling (C) were also determined and are shown for the HSC and multipotent progenitor (MPP) subset. Data show fold change relative to mouse F/F or human untreated cells (normalized as 1; dotted line; n = 3). Error bars represent the SD of the mean. p < 0.05, ∗∗p < 0.01, and ∗∗∗p < 0.001. White asterisks, untreated versus iP3K/RAPA-treated cultures of the same genotype. See also Figures S5 and S6.
Figure 6
Figure 6
Increased mTORC1 Activation and ROS Production Are Responsible for the Attrition of cMEK1 KO HSCs in Emergency Hematopoiesis (A and B) Impact of NAC and rapamycin (RAPA) treatment on HSC per femur (top) and HSC cell cycle distribution (bottom) in F/F and MEK1-cKO mice recovering from a single 5-FU injection (A) or subjected to chronic 5-FU treatment (B). (C and D) Regenerative potential of F/F and MEK1-cKO BM in lethally irradiated recipient mice treated with NAC (C) or rapamycin (D). Top: blood chimerism is shown; bottom: HSC chimerism and cell cycle distribution are shown. Recipients were treated with vehicle/NAC or vehicle/RAPA once per day between week 2 and week 12 after transplantation. Error bars represent the SD of the mean. p < 0.05, ∗∗p < 0.01, and ∗∗∗p < 0.001. Vehicle versus NAC or RAPA-treated mice of the same genotype is shown. See also Figure S7.
Figure 7
Figure 7
ERK-Dependent Phosphorylation of MEK1 T292 Feeds Back on AKT/mTORC1/FOXO3A Signaling to Balance HSC Quiescence and Differentiation Effect of lentiviral expression of MEK1 and FOXO3A (wild-type or phosphosite mutants) and of PINK1 on mouse F/F and cKO HSCs or on iMEK-treated human HSCs. (A–C) CFUs (A), ROS levels and Δψ per mitochondrial mass (B), and intracellular signaling (C) were determined after 6 weeks. Data show fold change relative to mouse cKO or human iMEK-treated HSCs (normalized as 1; dotted line; n = 3). Error bars represent the SD of the mean. p < 0.05, ∗∗p < 0.01, and ∗∗∗p < 0.001, comparing vector-infected HSCs with HSCs infected with the indicated constructs. (D) Model: differentiation-promoting events in red; see text for details.

Similar articles

Cited by

References

    1. Akunuru S., Geiger H. Aging, clonality, and rejuvenation of hematopoietic stem cells. Trends Mol. Med. 2016;22:701–712. - PMC - PubMed
    1. Ashburner M., Ball C.A., Blake J.A., Botstein D., Butler H., Cherry J.M., Davis A.P., Dolinski K., Dwight S.S., Eppig J.T., The Gene Ontology Consortium Gene ontology: tool for the unification of biology. Nat. Genet. 2000;25:25–29. - PMC - PubMed
    1. Baldridge M.T., King K.Y., Boles N.C., Weksberg D.C., Goodell M.A. Quiescent haematopoietic stem cells are activated by IFN-gamma in response to chronic infection. Nature. 2010;465:793–797. - PMC - PubMed
    1. Bernitz J.M., Kim H.S., MacArthur B., Sieburg H., Moore K. Hematopoietic stem cells count and remember self-renewal divisions. Cell. 2016;167:1296–1309.e10. - PMC - PubMed
    1. Bigarella C.L., Liang R., Ghaffari S. Stem cells and the impact of ROS signaling. Development. 2014;141:4206–4218. - PMC - PubMed

Substances