. 2018 Jun 13;23(6):796-808.e6.
doi: 10.1016/j.chom.2018.04.016. Epub 2018 May 24.

Daily Rhythms of TNFα Expression and Food Intake Regulate Synchrony of Plasmodium Stages with the Host Circadian Cycle

Affiliations

Daily Rhythms of TNFα Expression and Food Intake Regulate Synchrony of Plasmodium Stages with the Host Circadian Cycle

Isabella Cristina Hirako et al. Cell Host Microbe. .

Abstract

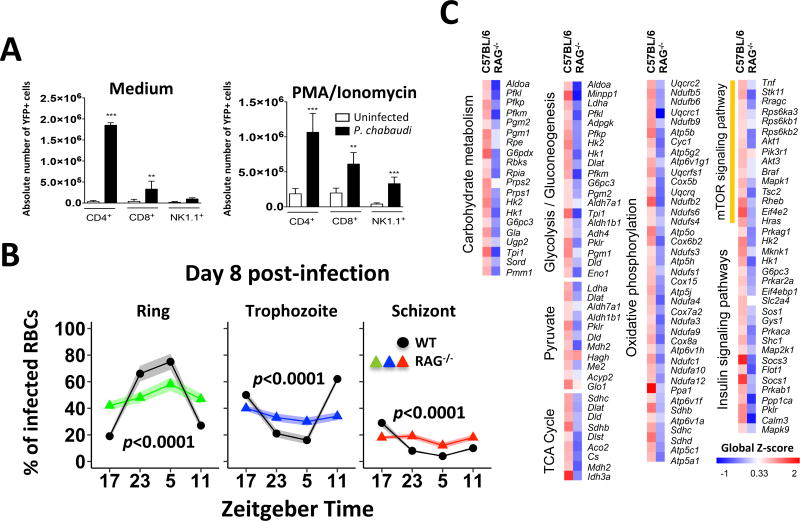
The Plasmodium cell cycle, wherein millions of parasites differentiate and proliferate, occurs in synchrony with the vertebrate host's circadian cycle. The underlying mechanisms are unknown. Here we addressed this question in a mouse model of Plasmodium chabaudi infection. Inflammatory gene expression and carbohydrate metabolism are both enhanced in interferon-γ (IFNγ)-primed leukocytes and liver cells from P. chabaudi-infected mice. Tumor necrosis factor α (TNFα) expression oscillates across the host circadian cycle, and increased TNFα correlates with hypoglycemia and a higher frequency of non-replicative ring forms of trophozoites. Conversely, parasites proliferate and acquire biomass during food intake by the host. Importantly, cyclic hypoglycemia is attenuated and synchronization of P. chabaudi stages is disrupted in IFNγ-/-, TNF receptor-/-, or diabetic mice. Hence, the daily rhythm of systemic TNFα production and host food intake set the pace for Plasmodium synchronization with the host's circadian cycle. This mechanism indicates that Plasmodium parasites take advantage of the host's feeding habits.

Keywords: IFNγ; Plasmodium; TNFα; energy metabolism; food intake; glucose; insulin; malaria and circadian cycle.


Conflict of interest statement

DECLARATION OF INTERESTS

The authors declare no competing interests.

Figures

Figure 1
Figure 1. Energy metabolism gene signature and pro-inflammatory response in P. falciparum malaria patients
(A) Cytokine levels in PBMCs from malaria patients and healthy donors, cultured in the absence or presence of LPS (100 ng/mL) or R848 (2 µM). Data are the average of PBMCs from 5 healthy donors and 5–6 malaria patients. Student’s unpaired t test with Welch’s correction was used for data analysis with parametric distribution. Statistically significant differences are indicated by *p<0.05, **p<0.01, or ***p<0.001. (B) Heatmap illustrating the differential expression of genes involved in carbohydrate metabolism (glucose metabolism as well as glucose 6-phosphate processes and galactose catabolism), canonical glycolysis pathway, reduction-oxidation reactions (cell redox homeostasis and respiratory burst), and response to oxidative stress by PBMCs of malaria patients before and after treatment. (C) GSE Reactome analysis indicates inflammatory and metabolic pathways induced in patients undergoing acute malaria episodes. Red and blue dots indicate that the named pathways are enriched for enhanced gene expression in individuals with malaria, before and after therapy and parasitological cure, respectively. The color scheme represents the global Z-score. See also Figure S1 and Table S1.
Figure 2
Figure 2. Energy metabolism gene signature and parasite synchronization is disrupted in Pc-infected IFNγ−/− mice
(A) Heatmap of microarray results illustrating differential expression of genes involved in carbohydrate metabolism (pentose phosphate pathway, galactose, fructose, and mannose metabolism), glycolysis and gluconeogenesis pathways, pyruvate metabolism, citrate (TCA) cycle, oxidative phosphorylation, and insulin response including the mTOR signaling pathway by splenocytes from C57BL/6 mice (3 uninfected and 3 Pc-infected). (B) Radar illustration of: (i) the number of genes (fold change >1.5) from different inflammatory or metabolic pathways induced in spleen from Pc-infected C57BL/6 (WT) mice (blue line); (ii) the percentage of these genes with a >1.5-fold change in infected IFNγ−/− mice (red line); and (iii) the percentage of these genes for which the expression was higher in infected WT than in infected IFNγ−/− mice (green line). (C) Cytokine levels produced by splenocytes cultured in the absence or presence of CpG ODN (3 µM) or R848 (2 µM). Data are the average of 5–8 uninfected controls and 7–10 infected mice at 8 days p.i. and results are a pool of two independent experiments. Analyses of cytokine results were performed using Mann-Whitney test for data with non-parametric distribution. (D) The three-way interaction was significant (p=0.02); for Day 8 there was a significant difference in trends over time between infected IFNγ−/− (n=17) and infected WT mice (n=24) (p=0.0056). Differences in means of blood glucose levels are statistically significant, when comparing infected IFNγ−/− and infected WT mice at the same time point, as indicated by * (p<0.05), ** (p<0.01) and ***(p<0.001) indicate. There was a significant difference in trends at Day 0 (p=0.02) with slightly higher level in IFNγ−/− (n=16) at 12 hours, when compared to WT (n=34). Data are a pool of 5 experiments with similar results. (E) Concavity measurements, confidence intervals (within brackets) and p values (in each graph) indicate that the different Pc stages are evenly distributed in IFNγ−/− mice (n=7) at different time points, when compared to WT mice (n=13). Ring: WT C=−1.41 [−1.55, −1.26] versus IFNγ−/− C=−0.18 [−0.38, 0.02]; Trophozoite: WT C=1.01 [0.88, 1.15] versus IFNγ−/− 0.20 [0.02, 0.38]; and Schizont: WT C=0.39 [0.33, 0.046] versus IFNγ−/− −0.03 [−0.12, 0.06]. Data are pool of 3 experiments Estimates and testing based on mixed effect model (glucose) or multivariate mixed effect model (parasitemia) with mouse as a random effect as described in the methods section. See also Figure S2 and Table S2.
Figure 3
Figure 3. IFNγR expression by hematopoietic cells is essential for Pc cell cycle synchronization
Concavity (C), confidence intervals (within brackets) and p values (in each figure) indicate that (A) opposed to WT->WT (n=8) (top graphs) and WT-> IFNγR−/− (n=8), the different Pc stages are evenly distributed in IFNγR−/−->WT (n=8) and IFNγR−/−->IFNγR−/− (n=8) chimera mice at different time points. Ring: WT->WT C=−1.28 [−1.44, − 1.12] versus IFNγR−/−->WT C=−0.3 [−0.45, −0.14] or WT->IFNγR−/− C=−1.04 [−1.18, −0.91] versus IFNγR−/−-> IFNγR−/− C=−0.14 [−0.28,0.01]; Trophozoite: WT->WT C=0.97 [,0.81,1.12] versus IFNγR−/−->WT C=−0.33 [0.17,0.49] or WT->IFNγR−/− C=−0.85 [0.72,0.98] versus IFNγR−/−-> IFNγR−/− C=0.12 [−.0.01,0.26]; and Schizont: WT->WT C=0.31 [0.23,0.39] versus IFNγR−/−->WT C=−0.03 [−0.11,0.04] or WT->IFNγR−/− C=0.19 [0.13,0.26] versus IFNγR−/−-> IFNγR−/− C=−0.02 [−0.05,0.08]. p values in each figure indicate that there is no difference in parasite synchronization when comparing (B) WT (n=13) versus 3D (UNC93B1 mutant) (n=6), IFNAR−/− (IFNα/β receptor deficient) (n=7), Ig μ-chain−/− (B cell and antibody deficient) (n=6) or ββββ2m−/− (CD8+ T cell deficient) (n=7), respectively; as well as (C) WT mice treated with control isotype (n=8) versus anti-Ly6G (n=8) to deplete neutrophils. Chimera, knockout and depletion experiments are pool of 2 experiments that yielded similar results. Estimates and testing based on multivariate mixed effect model with mouse as a random effect are described in the methods section. Chimeric mice were reconstituted with bone marrow cells from congenic C57BL/6 (CD45.1) or IFNγR−/− (CD45.2) strains and validated by flow cytometric analysis using labeled anti-CD45.1 and anti-CD45.2 antibodies. Neutrophil depletion was validated by flow cytometry using anti-CD11b, anti-Ly6c and anti-Ly6G. Counting of different parasite stages, at day 8 p.i. with Pc, is presented as the average and SEM indicated by shaded areas along the lines. See also Figure S3.
Figure 4
Figure 4. Disrupted energy metabolism gene signature and parasite synchronization in Pc-infected RAG-1−/− mice infected
(A) Splenocytes from uninfected and infected GREAT mice were left unstimulated or stimulated with PMA (50 ng/mL) plus ionomycin (500 ng/mL) and analyzed by flow cytometry. YFP+ cells were considered as IFNγ producers and data presented as total number of positive cells per spleen. YFP+ CD4+ T, CD8+ T or NK cells from uninfected and Pc-infected mice were analyzed by Student’s unpaired t test with Welch’s correction for analysis of data with parametric distribution. (B) Percentage of infected RBCs containing the ring-form trophozoites (green), mature trophozoites (blue), or schizonts (red) in 13 C57BL/6 (black line) and 7 RAG−/− mice. Concavity measurements, confidence intervals (within brackets) and p values (in each graph) indicate that the different Pc stages are evenly distributed in RAG−/− mice at different time points. Ring: WT C=−1.41 [−1.55, −1.26] versus RAG−/− C=−0.18 [−0.37,0.01]; Trophozoite: WT C=1.01 [0.88, 1.15] versus RAG−/− 0.13 [−0.04, 0.3]; and Schizont: WT C=0.39 [0.32, 0.047] versus RAG−/− 0.05 [−0.05, 0.16]. RAG experiments are pool of 2 experiments that yielded similar results. Estimates and testing based on multivariate mixed effect model (parasitemia) with mouse as a random effect as described in the methods section. (C) Heatmap illustrating differential expression of genes involved in carbohydrate metabolism in spleen cells from infected C57BL/6 or RAG−/− mice. The fold increase of each group was calculated by averaging the value of 3 individual infected mice divided by the average value of 3 uninfected control mice. The color scheme represents the global Z-score (A and B). See also Table S2.
Figure 5
Figure 5. TNF receptor mediates hypoglycemia and synchronization of the Pc cell cycle
(A) Number of genes from carbohydrate metabolism and inflammatory pathways that demonstrate differential expression in the liver of Pc-infected mice over a 24 h period. (B) Heatmap illustrates oscillating expression of genes from AMPK, PPAR and insulin resistance pathways in liver from uninfected (day 0) and Pc-infected (day 8) C57BL/6 (WT) mice at ZT 17, 23, 5 and 11. Arrows indicate key genes [i.e., 6-phosphofructo-2-kinase/fructose-2,6-biphosphatase 3 (Pkfb3), PPARγ, and TNFα] involved in regulating glucose metabolism. Data are the average of individual gene expression from 3 infected and 3 uninfected WT mice. (C) Levels of TNFα in sera from mice collected at ZT 17, 23, 5 and 11 on days 0 (uninfected controls), 6 and 8 p.i. with Pc (left panel); and in sera collected at ZT 1 from WT, IFNγR−/−, and IFNγ−/− mice at 0 and 8 days p.i. (right panel). The results are an average of 3–4 mice per group. The mean TNFα levels from uninfected and infected C57BL/6 to IFNγ and IFNγR were compared using the Student’s unpaired t test with Welch’s correction for analysis of data with parametric distribution. (D) The three-way interaction was significant (p=0.04); for Day 8 there was a significant difference in trends over time between infected TNFR−/− (n=14) and infected WT mice (n=23) (p=0.0028). Differences in means of blood glucose levels are statistically significant, when comparing infected IFNγ−/− and infected WT mice at the same time point, as indicated by * (p<0.05), ** (p<0.01) and ***(p<0.001) indicate. There was no significant difference in trends at Day 0 (p=0.02), when comparing TNFR−/− (n=23) versus WT (n=31). Experiments are pool of 4 experiments that yielded similar results. (E) The percentage of RBCs containing the ring-form trophozoites (green), mature trophozoites (blue), or schizonts (red) in Pc-infected TNFR−/− (n=10) and C57BL6 (n=13, black lines) mice. Concavity measurements, confidence intervals (within brackets) and p values (in each graph) indicate that the different Pc stages are evenly distributed in TNFR−/− mice at different time points. Ring: WT C=−1.41 [−1.55, −1.26] versus TNFR−/− C=−0.13 [−0.26,0.01]; Trophozoite: WT C=1.01 [0.88, 1.15] versus TNFR−/− 0.13 [−0.06, 0.21]; and Schizont: WT C=0.39 [0.32, 0.047] versus TNFR−/− 0.05 [−0.03, 0.13]. Experiments are pool of 3 experiments that yielded similar results. Estimates and testing based on multivariate mixed effect model (parasitemia) with mouse as a random effect as described in the methods section. See also Figure S4, and Tables S3 and S4.
Figure 6
Figure 6. Inverted light schedule and nighttime diet restriction inverts timing of Pc stages synchronization
Mice were maintained on a regular light cycle, lights on from 7:00 am (ZT 0) to 7:00 pm (ZT 12), with food access either at nighttime (ZT 12 to 24), daytime access (ZT 0 to 12) or ad libitum. Alternatively, mice were kept on inverted light cycle, lights on from 7:00 pm (ZT 0) to 7:00 am (ZT 12) and food ad libitum. After three weeks, mice were infected with Pc and maintained in the same light/diet regimen. (A) The three-way interaction was significant (p=0.0038); for Day 8 there was a significant difference in trends over time between infected regular light schedule and daytime diet (p<0.001). Differences in means of blood glucose levels are statistically significant, when comparing infected regular light schedule and daytime diet at the same time point, as indicated by ** (p<0.01). The data are from 8–12 mice per group. B) Concavity measurements, confidence intervals (within brackets) and p values (in each graph) indicate that the different Pc stages inverted in WT mice kept in regular light schedule and fed at daytime (n=8) versus mice that received food ad libitum (n=13). Ring: ad libitum C=−1.41 [−1.58, −1.23] versus daytime C=0.94 [0.72,1.17]; Trophozoite: ad libitum C=1.01 [0.85, 1.18] versus daytime −0.66[−0.88, −0.45]; and Schizont: ad libitum C=0.39 [0.27,0.52] versus daytime −0.28 [−0.44, 0.12]. Inverted light schedule and diet restriction are pool of 2 experiments that yielded similar results. Estimates and testing based on multivariate mixed effect model (parasitemia) with mouse as a random effect as described in the methods section. There is no difference in parasite stage distribution, in mice kept in regular light schedule and inverted light schedule receiving food ad libitum (top panel) or regular light schedule with food access only at nighttime. See also Figure S5.
Figure 7
Figure 7. Synchronization of Pc with host circadian rhythm is disrupted in diabetic mice
(A) Wild-type mice were treated with streptozotocin to induce diabetes and then infected with Pc. Glucose levels (top panels) as well as parasite counts (bottom panels) were evaluated at 8 days p.i. Data are from 7 to 8 mice per group. In parallel experiments, mice were given food access only from ZT 0 to 6 for 10 days, infected with Pc, and kept under the same diet schedule. On day 8 p.i., one group of mice received (B) food and another group received (C) glucose in the water from ZT 0 to 6. The three-way interaction difference in trends over time were significant for (A) diabetic mice (p<0.0001 and not significant p>0.05), (B) mice that received diet (p=0.0088 and p<0.0001), or (C) glucose (p<0.0001and p<0.0001) in the day 8 post-infection. Differences in means of blood glucose levels are statistically significant, when comparing infected diabetic mice, as well as mice that receive diet or glucose to the WT that received food ad libitum at the same time point, as indicated by *** (p<0.001). The data are from 8–12 mice per group. (B) Red and (C) blue arrows indicate the time that diet and glucose access was initiated. Concavity measurements, confidence intervals (within brackets) and p values (in each graph) indicate that the different Pc stages are no longer synchronized in diabetic mice (n=7). Ring: non-diabetic C=−1.41 [−1.53, −1.28] versus diabetic C=0.05 [−0.14,0.23]; Trophozoite: ad libitum C=1.01 [0.89, 1.14] versus daytime −0.07[−0.25, 0.11]; and Schizont: ad libitum C=0.39 [0.32,0.46] versus daytime −0.02 [−0.8, −0.25]. Food restriction for 18 h followed by diet or glucose ingestion from ZT 0 to ZT 6 on day 8 post-infection inverted parasite cell cycle. Schizont: ad libitum C=0.39 [0.27,0.52] versus food access −0.18 [−0.32, 0.04] or glucose access −0.19 [−0.29, −0.09]. Diabetic mice and diet restriction are pool of 2 experiments that yielded similar results. Estimates and testing based on mixed effect model (glucose) or multivariate mixed effect model (parasitemia) with mouse as a random effect are described in the methods section. Individual levels of glucose are shown in Figure S6.

Comment in

  • Malaria Makes the Most of Mealtimes.
    Reece SE, Prior KF. Reece SE, et al. Cell Host Microbe. 2018 Jun 13;23(6):695-697. doi: 10.1016/j.chom.2018.05.015. Cell Host Microbe. 2018. PMID: 29902432

References

    1. Antonelli LR, Leoratti FM, Costa PA, Rocha BC, Diniz SQ, Tada MS, Pereira DB, Teixeira-Carvalho A, Golenbock DT, Goncalves R, et al. The CD14+CD16+ inflammatory monocyte subset displays increased mitochondrial activity and effector function during acute Plasmodium vivax malaria. PLoS pathogens. 2014;10:e1004393. - PMC - PubMed
    1. Ataide MA, Andrade WA, Zamboni DS, Wang D, Souza Mdo C, Franklin BS, Elian S, Martins FS, Pereira D, Reed G, et al. Malaria-Induced NLRP12/NLRP3-Dependent Caspase-1 Activation Mediates Inflammation and Hypersensitivity to Bacterial Superinfection. PLoS pathogens. 2014;10:e1003885. - PMC - PubMed
    1. Bartholomeu DC, Ropert C, Melo MB, Parroche P, Junqueira CF, Teixeira SM, Sirois C, Kasperkovitz P, Knetter CF, Lien E, Latz E, et al. Recruitment and endo-lysosomal activation of TLR9 in dendritic cells Infected with Trypanosoma cruzi. Journal of immunology. 2008;181:1333–1344. - PubMed
    1. Bolger AM, Lohse M, Usadel B. Trimmomatic: a flexible trimmer for Illumina sequence data. Bioinformatics. 2014;30:2114–2120. - PMC - PubMed
    1. Curtis AM, Bellet MM, Sassone-Corsi P, O'Neill LA. Circadian clock proteins and immunity. Immunity. 2014;40:178–186. - PubMed

Publication types

MeSH terms