. 2018 Jul 3;28(1):118-129.e5.
doi: 10.1016/j.cmet.2018.04.021. Epub 2018 May 24.

A Role for Hypocretin/Orexin in Metabolic and Sleep Abnormalities in a Mouse Model of Non-metastatic Breast Cancer

Affiliations

A Role for Hypocretin/Orexin in Metabolic and Sleep Abnormalities in a Mouse Model of Non-metastatic Breast Cancer

Jeremy C Borniger et al. Cell Metab. .

Abstract

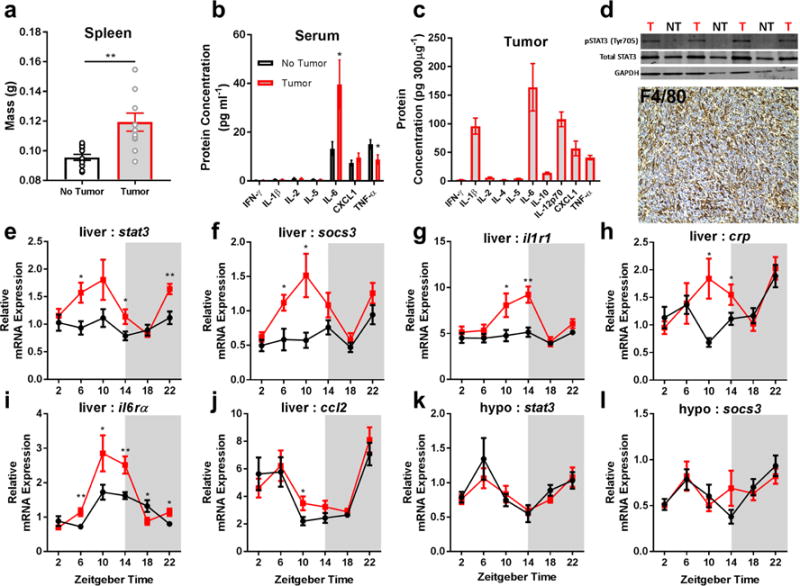
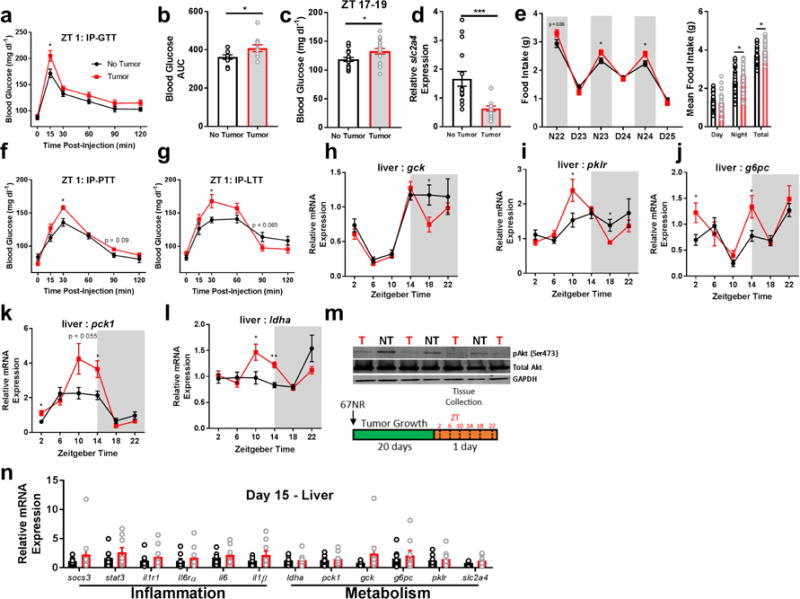
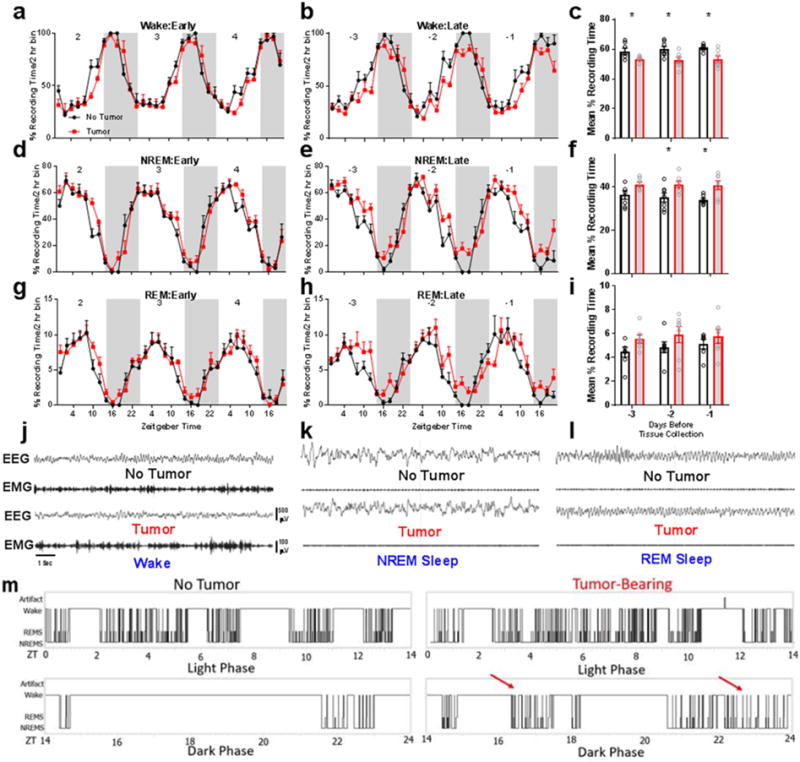
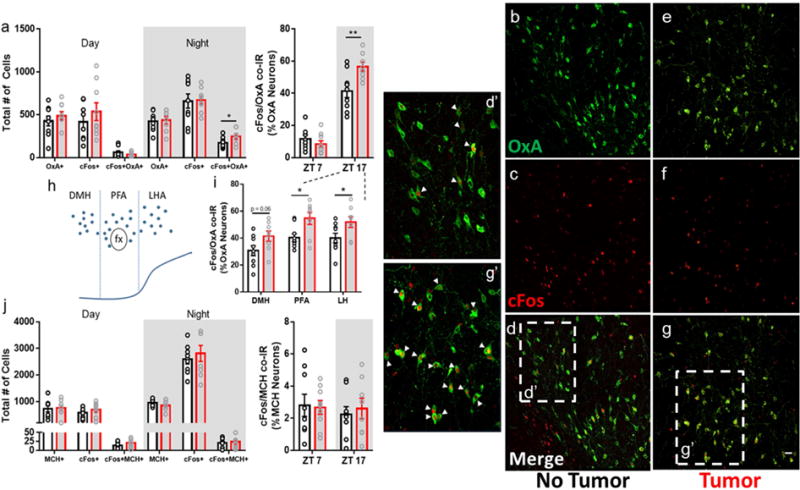
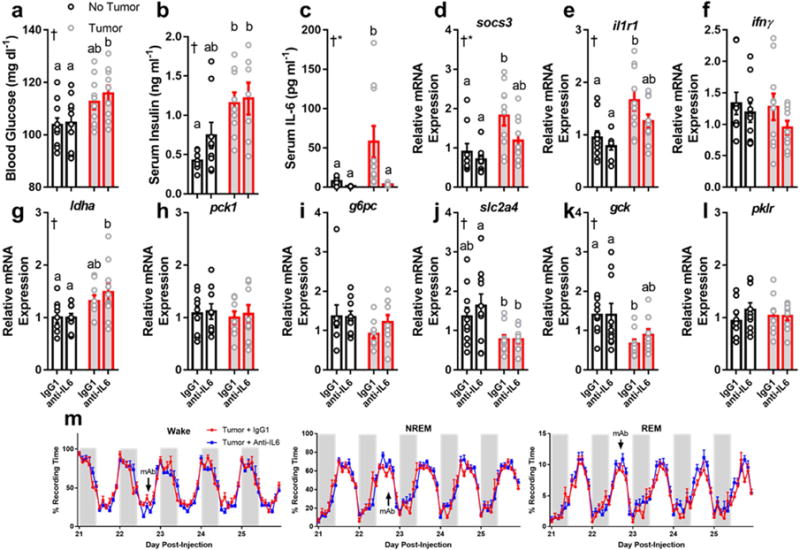
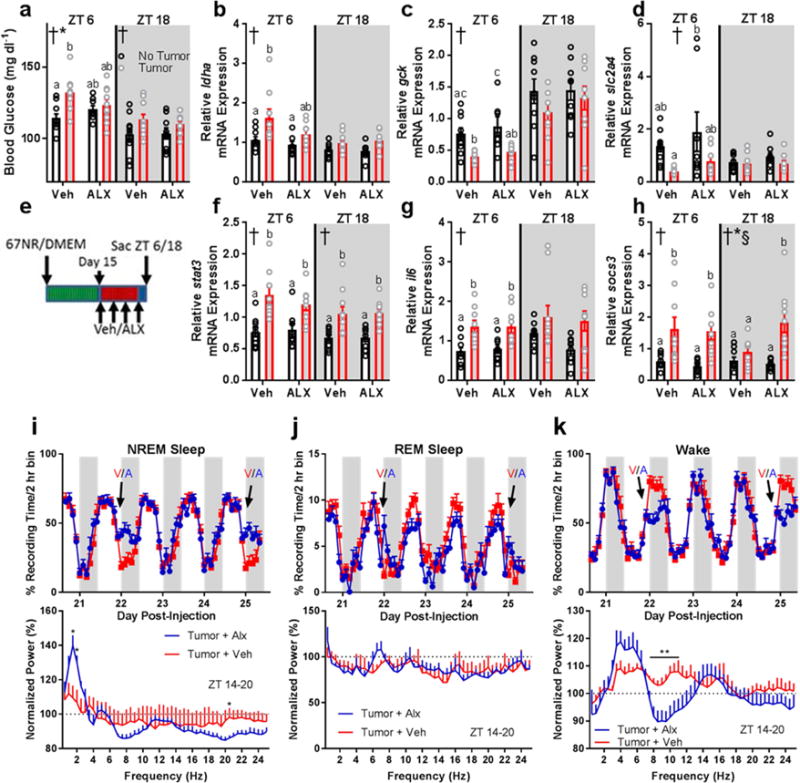
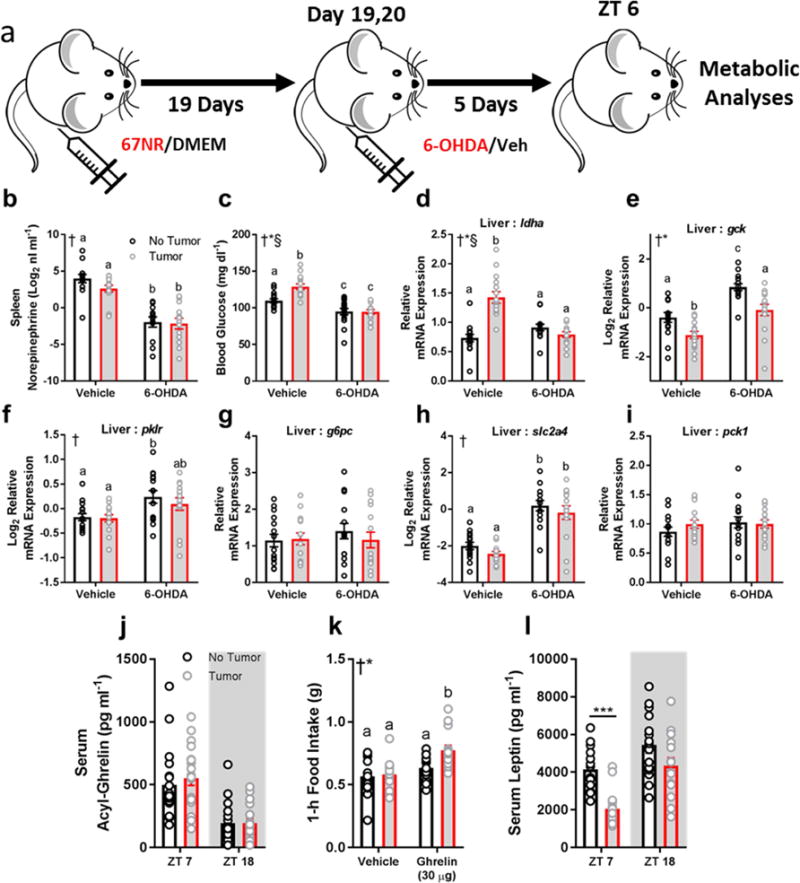
We investigated relationships among immune, metabolic, and sleep abnormalities in mice with non-metastatic mammary cancer. Tumor-bearing mice displayed interleukin-6 (IL-6)-mediated peripheral inflammation, coincident with altered hepatic glucose processing and sleep. Tumor-bearing mice were hyperphagic, had reduced serum leptin concentrations, and enhanced sensitivity to exogenous ghrelin. We tested whether these phenotypes were driven by inflammation using neutralizing monoclonal antibodies against IL-6; despite the reduction in IL-6 signaling, metabolic and sleep abnormalities persisted. We next investigated neural populations coupling metabolism and sleep, and observed altered activity within lateral-hypothalamic hypocretin/orexin (HO) neurons. We used a dual HO-receptor antagonist to test whether increased HO signaling was causing metabolic abnormalities. This approach rescued metabolic abnormalities and enhanced sleep quality in tumor-bearing mice. Peripheral sympathetic denervation prevented tumor-induced increases in serum glucose. Our results link metabolic and sleep abnormalities via the HO system, and provide evidence that central neuromodulators contribute to tumor-induced changes in metabolism.

Keywords: IL-6; breast cancer; ghrelin; glucose; hypocretin/orexin; leptin; sleep.


Conflict of interest statement

Declaration of Interest

The authors declare no competing interests.

Figures

Figure 1
Figure 1
Non-metastatic tumors induce peripheral IL-6 signaling. Tumor bearing mice have increased (a) spleen mass (N = 12/group; t = 3.702, p = 0.0012), (b) high serum levels of IL-6 (N = 13 no tumor, N = 14 tumor for IL-6; t = 2.449, p = 0.022, N = 14/group for TNF-α, t = 2.322, p = 0.028), and (c) their tumors contain high levels of IL-6 protein. (d) This is associated with increased pSTAT3 activation (western blot, ZT 10) in the liver of tumor-bearing mice (T) compared to non-tumor bearing (NT) mice (only relevant lanes of the western blot are shown), and marked macrophage (F4/80+) infiltration into tumors. Tumor bearing mice have increased expression of downstream targets of IL-6 signaling in the liver including (e) stat3 (N = 9/group for ZT 6, t = 2.937, p = 0.0097; 10/group for ZT 14, t = 2.241, p = 0.038; 9 no tumor, 10 tumor for ZT 22, t = 3.571, p = 0.0024), (f) socs3 (N = 9 and 8/group for no tumor and tumor groups ZT 6, t = 2.692, p = 0.0167; N = 9 and 10 for ZT 10, t = 2.683, p = 0.0157), (g) il1r1 (N = 10 no tumor, 9 tumor for ZT 10, t = 2.379, p = 0.029; 8 and 10 for ZT 14, t = 3.725, p = 0.0018), (h) crp (N = 8 no tumor 10 tumor for ZT 10, t = 2.79, p = 0.013; 9 and 8 for ZT 14, t = 2.087, p = 0.054) (i) il6rα (N = 9/group for ZT 6, t = 3.237, p = 0.0052; 10 no tumor and 8 tumor for ZT 10, t= 2.144, p = 0.0478; 9 and 10 for ZT 14, t= 3.139, p = 0.00599; 10 and 9 for ZT 18, t = 2.137, p = .0474; and 9/group for ZT 22, t = 2.642, p = 0.0177), and (j) ccl2 (N = 10 no tumor and 9 tumor for ZT 10, t = 2.247, p = 0.038), but not the hypothalamus (k,l). (Error bars represent ±SEM; *p < 0.05, **p < 0.01, Student’s t-test)
Figure 2
Figure 2
Non-metastatic tumors alter hepatic glucose metabolism. Tumor-bearing mice had impaired (a,b) glucose processing during a glucose tolerance test following an overnight fast (N = 10 no tumor, 9 tumor mice at 15 min post-injection, t = 2.599, p = 0.0187; N = 10/group for AUC, t = 2.134, p = 0.047), as well as (c) spontaneously higher glucose during the active phase (N = 19 no tumor, 18 tumor mice, t = 2.398, p = 0.0219). This was accompanied by (d) reduced expression of the insulin-dependent glucose transporter (slc2a4) (ZT 10, N = 15/group, t = 3.78, p = 0.0008), and (e) increased food intake (N23 N = 40/group, t = 2.251, p = 0.027; N24 t = 2.497, p = 0.0146), night average intake t = 2.542, p = 0.013; total intake t = 2.359, p = 0.021) and altered expression of gluconeogenesis and glycolysis pathway genes ‘around the clock’. (f) Tumor bearing mice enhanced gluconeogenesis in response to pyruvate (N = 15/group, 30 min post-injection, t = 3.43, p = 0.0019) and (g) lactate (N = 15/group, 30 min time point t = 2.534, p = 0.0174) challenges, (h) altered gck (N = 10/group for ZT 18, t = 2.365, p = 0.029), (i) pklr (N = 10 no tumor and 11 tumor for ZT 10, t = 2.23, p = 0.038; 9/group for ZT 18, t = 2.764, p = 0.014), (j) g6pc (N = 8 no tumor and 10 tumor at ZT 2, t = 2.258, p = 0.038; and 10 and 9 at ZT 14, t = 2.428, p = 0.0266), (k) pck1 (N = 10/group for ZT 2, t = 2.694, p = 0.015; 9/group for ZT 14, t = 2.792, p = 0.013), and (l) ldha (N = 9 no tumor and 12 tumor mice for ZT 10, t = 2.38, p = 0.028 ; 8/group for ZT 14, t= 5.105, p = 0.00016) as well as (m) reduced pAkt expression in the liver, indicating impaired insulin receptor signaling (ZT 10) (only relevant lanes of the western blot are shown). These changes in inflammation and metabolism were not evident until after day 15 following 67NR inoculation, as expression of all genes was equivalent between groups at this time (ZT 16) (n). (error bars represent S.E.M; *p < 0.05, **p < 0.01, ***p < 0.001; Student’s t-test).
Figure 3
Figure 3
Peripheral tumors disrupt sleep-wake states in mice. Early during tumor development (i.e., 2-4 days postinduction, sleep is not different from non-tumor bearing controls (panels a,d,g). However, late during tumor development (3 days prior to euthanasia at endpoint criteria), mice with tumors spend less time awake (panels b,c) (N = 7/group for days −3, t = 2.401, p = 0.033, and −2, t = 2.595, p = 0.0234, and 6 no tumor and 7 tumor for −1, t = 2.984, p = 0.0124, days prior to tissue collection) and more time in NREM sleep (panels e,f) (N = same as panel (c), −2 days t = 2.317, p = .039; −1 days, t = 2.925, p = 0.0138). Smaller changes are evident in REM sleep, although the total amount of REM sleep remained similar between groups (panels h, i). Representative band-passed EEG/EMG signals from tumor and non-tumor bearing mice in the (j) wake, (k) NREM, and (l) REM sleep vigilance states. Tumor-induced sleep was fragmented, as evidenced in (m), which shows representative hypnograms during the light and dark phases during final day of tumor growth. Aberrant periods of sleep during the normal active phase are marked with red arrows. Error bars represent ±SEM, *p < 0.05, Student’s t-test.
Figure 4
Figure 4
Non-metastatic tumors alter hypocretin/orexin neuron activity. (a) Tumor-bearing mice showed increased cFos immunoreactivity within hypocretin neurons during the active phase (ZT 17) (N = 9 no tumor and 8 tumor mice, t = 2.158, p = 0.047 for total cell numbers and t = 3.016, p = 0.0087 for % OxA neuron co-labeling at ZT 17). (b-g’) representative confocal images of hypocretin/orexin (AlexaFluor-488, green) and cFos (AlexaFluor-594, red) immunofluorescence in the hypothalamus. d’ and g’ show zoomed in sections of ‘d’ and ‘g’, respectively. Double-labeled cells are denoted by arrowheads. (h) schematic of the location of hypocretin/orexin neurons in the hypothalamus, and (i) quantification of double-labeling observed in each sub-region during the active phase (ZT 17) (N = 9 no tumor and 8 tumor mice, PFA t = 2.722, p = 0.016; LH t = 2.237, p = 0.041). (j) no changes were observed in co-distributed melanin concentrating hormone (MCH) neurons. (DMH = dorsomedial hypothalamus, PFA = perifornical area, LH = lateral hypothalamus). (Error bars represent SEM, *p < 0.05, **p < 0.01, Student’s t-test). Merged images (d,d’,g,g’) are composites of b,c, and e,f, respectively, scale bar = 50 μm
Figure 5
Figure 5
Neutralizing antibodies against IL-6 do not rescue metabolic or sleep phenotypes in tumor-bearing mice. Tumor-bearing mice increased (a) blood glucose (N = 10/group, main effect of tumor, F1,36 = 11.67, p = 0.0016) and (b) serum insulin (N = 8 no tumor IgG, 9 no tumor anti-IL-6, 9 tumor IgG, 7 tumor anti-IL-6, main effect of tumor, F1,29 = 16.46, p = 0.0003) regardless of whether they received anti-IL6 or the IgG1 isotype control (a total of three injections on days 15, 19, and 23). Despite successfully knocking down IL-6 (c) (N = 9 no tumor IgG, 7 no tumor anti-IL6, 10 tumor IgG and tumor anti-IL6; main effect of tumor F1,32 = 5.344, p = 0.027, main effect of antibody F1,32 = 7.016, p = 0.012, and an interaction among the two F1,32 = 4.391, p = 0.044) and IL-6 mediated socs3 expression (d) (N = 9 no tumor IgG and anti-IL6, 10 tumor IgG and anti-IL6, main effect of tumor, F1,34 = 12.34, p = 0.0013, main effect of antibody, F1,34 = 4.431, p = 0.043), but not il1r1 (N = 10/group except no tumor anti-IL6, main effect of tumor, F1,35 = 17.54, p = 0.0002) tumor bearing mice still showed deregulated expression of ldha (g) (N = 9 no tumor IgG and anti-IL6, 9 tumor IgG and 10 tumor anti-IL6, main effect of tumor, F1,33 = 10.3, p = 0.003), slc2a4 (j) (N = 10/group except 9 for tumor anti-IL6, main effect of tumor, F1,35= 11.79, p = 0.0015), and gck (k) (N = 10/group except 9 for tumor IgG, main effect of tumor, F1,35= 11, p = 0.0021), suggesting that IL-6 is not required for tumors to alter hepatic metabolism. Additionally, Anti-IL6 mAb treatment (single injection at day 22, denoted by “mAb” in figure) did not alter sleep in tumor bearing mice (m), demonstrating that IL-6 is not required for tumorinduced sleep disruption. (tissue collected at ZT 16) (Error bars represent S.E.M, † = main effect of tumor, * = main effect of antibody treatment, different letter headings represent multiple comparisons at p < 0.05, 2-way ANOVA; Tukey’s multiple comparisons test) (see Figure S8, 9).
Figure 6
Figure 6
Dual HO-receptor antagonism attenuates tumor-induced impairments in glucose processing and improves sleep quality without affecting peripheral inflammation. (a) Blood glucose (ZT 6 2-way ANOVA main effect of tumor: F1,33 = 8.903, p = 0.0053; interaction: F1,33 = 4.381, p = 0.0441)(ZT 18 2-way ANOVA main effect of tumor: F1,35 = 5.149, p = 0.03), (b) liver ldha expression (ZT 6 2-way ANOVA main effect of tumor: F1,32 = 9.194, p = 0.0048), (c) liver gck expression (ZT 6 main effect of tumor: F1,30 = 19.25, p = 0.0001), and (d) liver slc2a4 expression (ZT 6 main effect of tumor: F1,31 = 8.089, p = 0.0078) were altered by tumor-status and attenuated by administration of ALX. (e) Experimental design for ALX administration. Changes in hepatic inflammatory gene expression were not observed in response to ALX treatment. (f) Liver stat3 (ZT 6 main effect of tumor: F1,32 = 24.41, p < 0.0001; ZT 18 main effect of tumor: F1,33 = 22.79, p < 0.0001), (g) liver il6 (ZT 6 main effect of tumor: F1,32 = 21.43, p < 0.0001), and (h) liver socs3 (ZT 6 main effect of tumor: F1,30 = 17.37, p = 0.0002; ZT 18 main effect of tumor: F1,34 = 17.4, p = 0.0002; main effect of ALX F1,34 = 4.778, p = 0.0358; interaction F1,34 = 7.874, p = 0.0082) showed enhanced expression in tumor-bearing mice regardless of ALX treatment (n = 8-10/group/timepoint). (i) ALX treatment (V = vehicle, A = ALX) increased NREM sleep time during the first 6 hours following injections (day 22 ZT 14 t = 3.755, p = 0.0032; ZT 16 t = 3.126, p = 0.0096; ZT 18 t = 2.925, p = 0.014; day 25 ZT 14 t = 3.574, p = 0.0044; ZT 16 t = 3.995, p = 0.0021; ZT 18 t = 2.301, p = 0.042). This sleep was characterized by more restorative delta (0.5-4 Hz) frequencies in the EEG on day 25 normalized to the same time-frame (ZT14-20) on a non-treatment day (day 24) (1.5 Hz t = 3.361, p = 0.0063; 2 Hz t = 2.825, p = 0.0165, 20.5 Hz t = 2.354, p = 0.0382). (j) ALX had negligible effects on REM sleep time (day 20 ZT 12 t = 2.234, p =0.047, day 21 ZT 18 t = 3.464, p = 0.00529; ZT 0 t = 2.889, p = 0.015; day 22 ZT 14 t = 3.973, p = 0.0022, ZT 8 t = 3.177, p = 0.0088; day 23 ZT 18 t = 3.141, p = 0.0094; day 24 ZT 12 t = 3.095, p = 0.01; day 25 ZT 14 t = 2.685, p = 0.021). No effects of ALX on normalized REM EEG spectra were observed. (k) ALX treatment decreased wakefulness during the first 6 hours following injections (day 22 ZT 14 t = 4.139, p = 0.0016; ZT 16 t = 2.974, p = 0.013; ZT 18 t = 2.831, p = 0.016; day 23 ZT 22 t = 2.213, p = 0.049; day 25 ZT 14 t = 3.625, p = 0.004; ZT 16 t = 3.828, p = 0.003; ZT 18 t = 2.421, p = 0.034). ALX decreased wakefulness theta/alpha EEG frequencies following treatment (7.5 Hz: t = 2.298, p = 0.042; 8 Hz: t = 2.888, p = 0.015; 8.5 Hz: t = 2.799, p = 0.017; 9 Hz: t = 2.737, p = 0.019; 9.5 Hz: t = 3.335, p = 0.0067; 10 Hz: t = 3.129, p = 0.0096; 10.5 Hz: t = 2.612, p = 0.024; 11 Hz: t = 2.346, p = 0.039). (n = 6 tumor + veh, 7 tumor + alx). Error bars represent S.E.M, † = main effect of tumor, * = interaction, § = main effect of ALX treatment; different letter headings represent multiple comparisons at p < 0.05, 2-way ANOVA; Tukey’s multiple comparisons test).
Figure 7
Figure 7
Peripheral sympathetic denervation rescues metabolic abnormalities in tumor-bearing mice. (a) Experimental design. (b) Norepinephrine content in the spleen was reduced in mice that received 6-OHDA, suggesting successful sympathetic nervous system (SNS) ablation (n = 12-14/group, main effect of 6-OHDA F1,49 = 75.61, p < 0.0001). (c) 6-OHDA treatment normalized blood glucose concentrations in tumor-bearing mice (n = 14- 15/group; main effect of tumor F1,55 = 6.923, p = 0.011; main effect of 6-OHDA F1,55 = 47.86 p < 0.0001; interaction F1,55 = 7.58, p = 0.008). 6-OHDA normalized (d) liver ldha expression (n = 14-15/group; main effect of tumor F1,54 = 16.73, p = 0.0001; main effect of 6-OHDA F1,54 = 10.51, p = 0.002; interaction F1,54 = 33.48, p < 0.0001) (e) liver gck (15/group; main effect of tumor: F1,56 = 19.97, p < 0.0001; main effect of 6-OHDA F1,56 = 37.54, p < 0.0001), (f) pklr (n = 15/group; main effect of 6-OHDA F1,56 = 11.2, p = 0.0014). (g) g6pc (no change), (h) slc2a4 (n = 14- 15/group; main effect of 6-OHDA F1,53 = 70.04, p < 0.0001), (i) pck1 (no change) (all 6-OHDA data collected at ZT 6) (2-way ANOVA † = main effect of 6-OHDA, * = main effect of tumor, § = interaction; different letters indicate p < 0.05 difference with Tukey’s post-hoc test). Data that did not meet requirements for ANOVA were log2- transformed. In a separate cohort, tumor-bearing mice had altered satiety hormonal signaling. (j) serum acyl-ghrelin concentrations were unchanged between groups (n = 18-19/group), (k) however tumor-bearing mice increased feeding responses to exogenous ghrelin after a 14 hour fast (n = 14-15/group) ZT 14 injection; main effect of ghrelin F1,55 = 15.67, p = 0.0002; main effect of tumor status F1,55 = 5.738, p = 0.02; † = main effect of tumor, * = main effect of ghrelin). Tumor bearing mice showed reduced serum leptin concentrations during the day (n = 15/group; ZT 7 t = 5.54, p < 0.0001)

Comment in

References

    1. Adamantidis A, de Lecea L. The hypocretins as sensors for metabolism and arousal. J Physiol. 2009;587:33–40. - PMC - PubMed
    1. Aslakson CJ, Miller FR. Selective Events in the Metastatic Process Defined by Analysis of the Sequential Dissemination of Subpopulations of a Mouse Mammary Tumor. Cancer Res. 1992;52:1399–1405. - PubMed
    1. Bedrosian TA, Fonken LK, Walton JC, Haim A, Nelson RJ. Dim light at night provokes depression-like behaviors and reduces CA1 dendritic spine density in female hamsters. Psychoneuroendocrinology. 2011;36:1062–1069. - PubMed
    1. Ben-Shaanan TL, Azulay-Debby H, Dubovik T, Starosvetsky E, Korin B, Schiller M, Green NL, Admon Y, Hakim F, Shen-Orr SS, et al. Activation of the reward system boosts innate and adaptive immunity. Nat Med. 2016;22:940–944. - PubMed
    1. Black SW, Morairty SR, Fisher SP, Chen TM, Warrier DR, Kilduff TS. Almorexant Promotes Sleep and Exacerbates Cataplexy in a Murine Model of Narcolepsy. Sleep. 2013;36:325–336. - PMC - PubMed

MeSH terms