Review
. 2018 Aug:64:1-11.
doi: 10.1016/j.exphem.2018.05.005. Epub 2018 May 25.

Hematopoietic stem cell fate through metabolic control

Affiliations
Review

Hematopoietic stem cell fate through metabolic control

Kyoko Ito et al. Exp Hematol. 2018 Aug.

Abstract

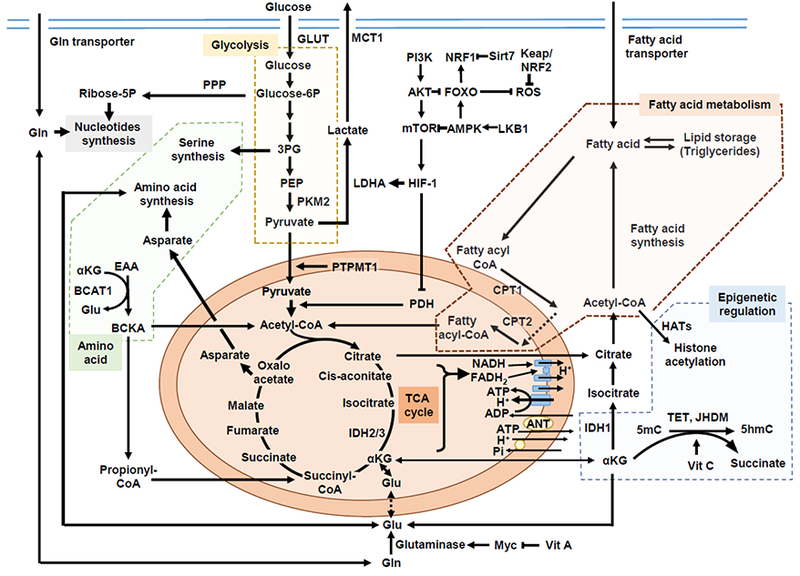
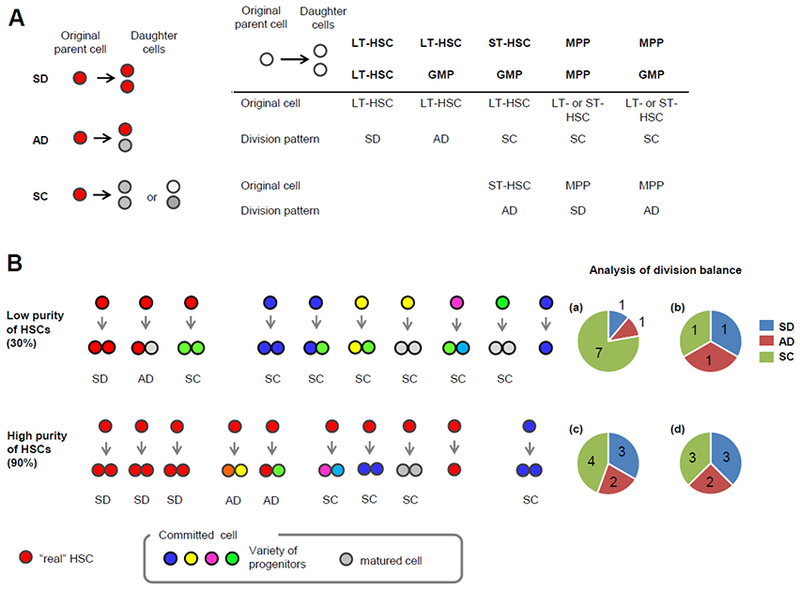
Hematopoietic stem cells maintain a quiescent state in the bone marrow to preserve their self-renewal capacity, but also undergo cell divisions as required. Organelles such as the mitochondria sustain cumulative damage during these cell divisions and this damage may eventually compromise the cells' self-renewal capacity. Hematopoietic stem cell divisions result in either self-renewal or differentiation, with the balance between the two affecting hematopoietic homeostasis directly; however, the heterogeneity of available hematopoietic stem cell-enriched fractions, together with the technical challenges of observing hematopoietic stem cell behavior, has long hindered the analysis of individual hematopoietic stem cells and prevented the elucidation of this process. Recent advances in genetic models, metabolomics analyses, and single-cell approaches have revealed the contributions made to hematopoietic stem cell self-renewal by metabolic cues, mitochondrial biogenesis, and autophagy/mitophagy, which have highlighted mitochondrial quality control as a key factor in the equilibrium of hematopoietic stem cells. A deeper understanding of precisely how specific modes of metabolism control hematopoietic stem cells fate at the single-cell level is therefore not only of great biological interest, but will also have clear clinical implications for the development of therapies for hematological diseases.


Figures

Figure 1.
Figure 1.. Overview of metabolic pathways contributing to HSC self-renewal and differentiation.
Hematopoietic stem cells (HSCs) rely on glycolysis (indicated by orange background). HIF-1α both promotes glycolysis and prevents pyruvate oxidation by suppressing the PDH complex. The PI3K-AKT pathway promotes ROS production by repressing FOXO. Fatty acid oxidation (brown background) is required for HSC selfrenewal by controlling cell fate decisions. HSCs are dependent on dietary valine and vitamin A, and Gln is converted to Glu by glutaminase, which is partly under the control of MYC. Important contributions from BCAA metabolisms regulated by BCAT1 to myeloid leukemia have been suggested (green background). The intact mitochondrial function for HSC maintenance may include metabolism-driven epigenetic changes or code. Acetyl-CoA can be a source for histone acetylation, and IDHs are a family of enzymes catalyzing the oxidative decarboxylation of isocitrate into αKG, which is a cofactor for dioxigenase enzymes, TET2 and JHDM. Vitamin C is a co-factor for the enzymatic activity of the TET family of DNA hydroxylases (blue background). Abbreviations: ΗIF-1α, hypoxia-inducible factor 1α; Glut, glucose transporter; Glucose-6P, glucose 6-phosphate; PDH, pyruvate dehydrogenase; 3PG, 3-phosphoglyceric acid; PPP, pentose phosphate pathway; PEP, phosphoenolpyruvic acid; PKM2, pyruvate kinase M2; LDHA, lactate dehydrogenase A; MCT1, monocarboxylate transporter 1; PTPMT1, PTEN-like mitochondrial phosphatase, or PTP localized to the Mitochondrion 1; TCA, tricarboxylic acid cycle; NADH, nicotinamide adenine dinucleotide; FADH, the reduced form of flavin adenine dinucleotide; ANT, adenine nucleotide translocases; Pi, inorganic phosphate; ROS, reactive oxygen species; FOXO, forkhead box Ο; PI3K, phosphoinositide 3-kinase; AKT, protein kinase B, or PKB; NRF, nuclear respiratory factor; Sirt7, sirtuin 7; LKB1, liver kinase B1; AMPK, AMP-activated protein kinase; mTOR, mammalian target of rapamycin; CoA, coenzyme A; CPT, carnitine-O-palmitoyltransferase; IDH, isocitrate dehydrogenases; Gln, glutamine; Glu, glutamate; EAA, essential amino acid (valine, leucine and isoleucine); BCAA, branched chain amino acid; BCAT1, BCAA transaminase 1; BCKA, branched chain keto acid; αKG, α-chetoglutarate; TET, ten-eleven translocation; JHDM, jmjC domain-containing histone demethylase; 5mC, 5-methylcytosine; 5hmC, 5-hydroxymethylcytosine; Vit C, vitamin C or ascorbic acid; hAT, Histone acetyltransferases;
Figure 2.
Figure 2.. Division patterns by paired daughter cell assays.
(A) Original cell function affects its division pattern. Schematic model of 3 division patterns; after SD, both daughter cells have the same function and differentiation stage as the parent cell (red), while both daughter cells appear as more committed cells (grey or pale grey) than the parent cells after SC (left). After initial division of the parent cell from the HSC-enriched fraction, the repopulation capacity and/or differentiation potential of the paired daughter cells is individually determined (e.g. by in vivo repopulation capacity, retrospectively). As the HSC-enriched fraction is a heterogeneous population, the immunophenotypically isolated single cells from this fraction can be hematopoietic progenitors or mature cells. Some examples of the combinations of the parent cells, their daughter cells and their division patterns are shown at right bottom. (B) Analysis of division patterns in homogenous and heterogeneous populations. When 10 single cells are isolated from the population with 30% purity of HSCs, 3 are generally “real” HSCs (top). In this example, each of these three HSCs undergoes SD, AD and SC, respectively (b), and 1 cell does not undergo cell division during the assay period. Because committed cells are not able to produce HSCs, the division patterns of those cells are assessed as SC. Thus, the resulting division balance of the whole compartment will be 1 SD, 1 AD and 7 SC (a), and it is difficult to extract the phenotypes of real HSCs from this low purity of HSCs. However, in the case of 90% HSC purity (bottom), the division balance of HSCs (d) can be accurately estimated from the resulting division symmetry of the isolated whole population (c). SD, symmetric division; AD, asymmetric division; SC, symmetric commitment; LT-HSC, long-term hematopoietic stem cell; ST-HSC, short-term HSC; MPP, multi-potent progenitor; GMP, granulocyte-monocyte progenitors.
Figure 3.
Figure 3.. Quality control machineries in HSC division balance and hematopoietic homeostasis.
(A) In SD, mitochondria are equally segregated into two daughter cells, although their metabolic processes may differ from those of the mother cell. Upon cell division, organelles such as mitochondria are damaged, which activates mitochondrial autophagy. This activation of mitophagy promotes mitochondrial quality control, and subsequent self-renewing HSC expansion. (B) In some mammary stem-like-cell divisions, mitochondria are split unevenly between the two daughter cells, and old mitochondria are apportioned primarily to the tissue-progenitor daughter, whereas newly synthesized mitochondria are apportioned to the stem cell-like daughter. It has yet to be formally demonstrated, but asymmetric HSC division by unequal apportionment of older or damaged mitochondria could be a potential strategy for removing damaged cell components. (C) HSC activation is accompanied by mitochondria activation and a shift in metabolic activity to Oxphos (right). Healthy but active mitochondria are unselectively removed by autophagy, and these active HSCs return to replicative quiescence (left). The majority (two thirds) of HSCs from aged mice as well as some autophagy-deficient HSCs (e.g. Atg12-deficient HSCs) were not able to efficiently limit the number of active mitochondria, which drives aging phenotypes in the blood (far left). Hyperactivated mitophagy (e.g. loss of Atad3a) results in blocked hematopoietic lineage commitment at the progenitor stage and enlarged HSPC pools (far right). HSPC, hematopoietic stem and progenitor cell.

References

    1. McCulloch EA & Till JE The radiation sensitivity of normal mouse bone marrow cells, determined by quantitative marrow transplantation into irradiated mice. Radiat Res 13, 115–125 (1960). - PubMed
    1. Weissman IL, Anderson DJ & Gage F Stem and progenitor cells: origins, phenotypes, lineage commitments, and transdifferentiations. Annu Rev Cell Dev Biol 17, 387–403, doi: 10.1146/annurev.cellbio.17.1.387 (2001). - DOI - PubMed
    1. Visvader JE & Clevers H Tissue-specific designs of stem cell hierarchies. Nat Cell Biol 18, 349–355, doi: 10.1038/ncb3332 (2016). - DOI - PubMed
    1. Morrison SJ, Shah NM & Anderson DJ Regulatory mechanisms in stem cell biology. Cell 88, 287–298 (1997). - PubMed
    1. Ramalho-Santos M & Willenbring H On the origin of the term “stem cell”. Cell Stem Cell 1, 35–38, doi: 10.1016/j.stem.2007.05.013 (2007). - DOI - PubMed

Publication types