. 2018 May 29:7:e33392.
doi: 10.7554/eLife.33392.

Prediction error induced motor contagions in human behaviors

Affiliations

Prediction error induced motor contagions in human behaviors

Tsuyoshi Ikegami et al. Elife. .

Abstract

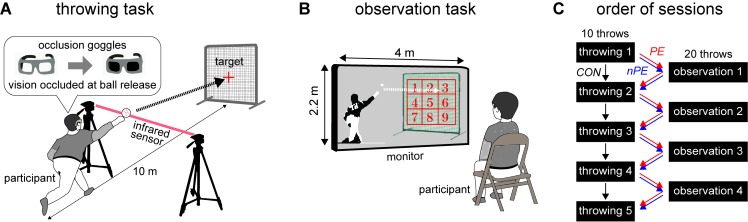
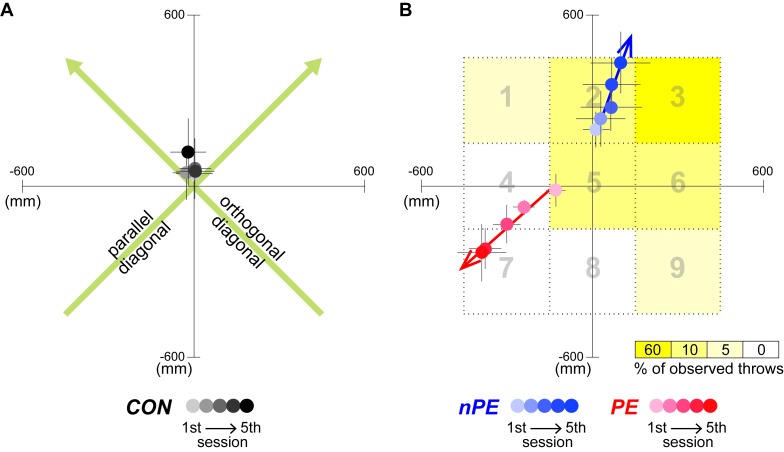
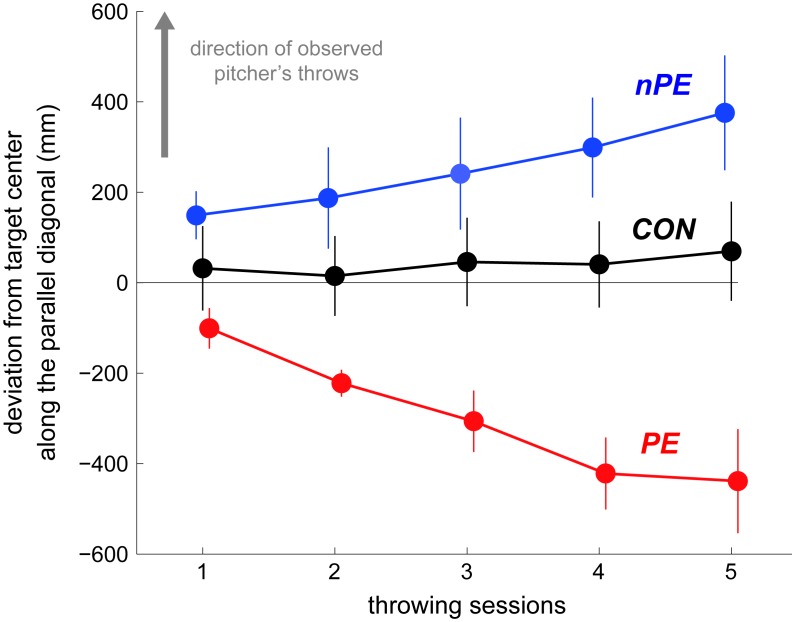
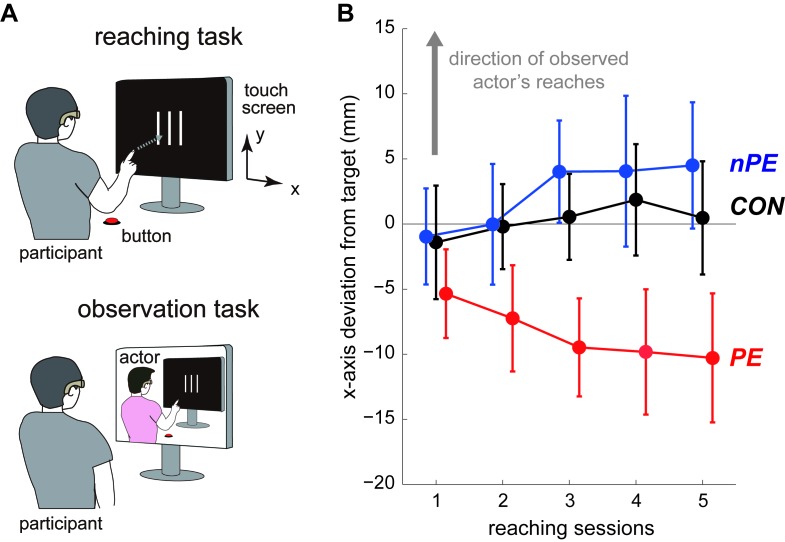
Motor contagions refer to implicit effects on one's actions induced by observed actions. Motor contagions are believed to be induced simply by action observation and cause an observer's action to become similar to the action observed. In contrast, here we report a new motor contagion that is induced only when the observation is accompanied by prediction errors - differences between actions one observes and those he/she predicts or expects. In two experiments, one on whole-body baseball pitching and another on simple arm reaching, we show that the observation of the same action induces distinct motor contagions, depending on whether prediction errors are present or not. In the absence of prediction errors, as in previous reports, participants' actions changed to become similar to the observed action, while in the presence of prediction errors, their actions changed to diverge away from it, suggesting distinct effects of action observation and action prediction on human actions.

Keywords: action execution; action observation; human; motor contagion; neuroscience; prediction error.


Conflict of interest statement

TI, GG, TT, HN No competing interests declared

Figures

Figure 1.
Figure 1.. Experiment-1 consisted of two tasks.
(A) In the throwing task, the participants threw balls aimed for the center of a target while wearing ‘occlusion’ goggles, that turned opaque when the participant's arm crossed the infrared beam. This prevented them from seeing where their throw hit the target. (B) In the observation task, the participants were asked to observe the video of throws made by a baseball pitcher and vocally report a number on a nine part grid corresponding to where the throw hit the target. (C) Five throwing sessions were interspersed with four observation sessions for the participants in the nPE group (blue arrow) and PE group (red arrow), while the participants in the CON group (black arrow) performed only the throwing sessions, but took a break (equivalent to the length of an observation session) between the throwing sessions.
Figure 2.
Figure 2.. Throw hit locations of participants in Experiment-1.
(A) The across participant average (and s.e.) of hit locations in the CON group shown in gradients of gray, with a darker color representing a later throwing session. The green arrows show the ‘parallel’ and ‘orthogonal’ diagonals, which are used as the reference coordinates for the data plotting and quantification analysis for the nPE and PE groups. (B) The across participant average (and s.e.) of hit locations in the nPE group (blue data) and the PE group (red data). The grid area markings shown to the participants after each observed throw, are shown in gray. The yellow gradient indicates the percentage of the observed throws hitting each grid area in the observation sessions for the upper-right observing participants, who were shown the pitcher’s throws biased to the upper-right corner of the target. Note that the hit locations were plotted by flipping the data from the lower-left observing participants along the parallel and orthogonal diagonals, such that the predominant direction of pitcher’s throws observed by all participants in both the PE and nPE groups were toward the upper-right corner of the target. The nPE groups tend to progressively deviate towards the observed throws, while the PE groups tend to deviate away from the observed throws. The colored arrows indicate the linear fit of the participant-averaged hit locations across the throwing sessions.
Figure 3.
Figure 3.. Changes in the hit locations of the participants’ throws across the throwing sessions in Experiment-1.
The participant-averaged deviations from the target center along the parallel diagonal were plotted by flipping the data from the lower-left observing participants, such that the directions of pitcher’s throws observed by all participants in both the nPE and PE groups were in the positive ordinate (indicated by gray arrow). The data from the CON, nPE, and PE groups are plotted in black, blue, and red, respectively. The throws by the nPE group progressively deviated towards where the pitcher in the video threw the ball most frequently. In contrast, the throws by the nPE group progressively deviated away from where the pitcher in the video threw the ball most frequently. The throws by the CON group did not change across sessions. Error bars indicate standard error.
Figure 4.
Figure 4.. Experiment-2 consisted of two tasks similar to Experiment-1.
(A) In the reaching task, the participants made reaching movements to touch the center line (among the three vertical lines) on a touch screen with their index fingers. They wore ‘occlusion’ goggles that turned opaque when the participant started to reach. This prevented them from seeing where their index finger touched the screen. In the observation task, with their occlusion goggles open, the participants were asked to observe the video of reaches made by an actor and report where the actor touched the screen. (B) Changes in the participants’ touch locations across the throwing sessions. The participant-averaged deviations from the center line along the x-axis were plotted by flipping the data from the left observing participants, such that the directions of the actor’s reaches observed by all participants in both the nPE and PE groups were in the positive ordinate (indicated by gray arrow). The data from the CON, nPE, and PE groups are plotted in black, blue, and red, respectively. The touch locations by the nPE group progressively deviated towards where the actor touched most frequently on the screen. In contrast, the touch locations by the PE group progressively deviated away from where the actor touched most frequently on the screen. The touch locations by the CON group did not change across sessions. Error bars indicate standard error.
Figure 4—figure supplement 1.
Figure 4—figure supplement 1.. Touch location in Experiment-2.
The x-axis position distributions of the actor’s touch locations for the left observing participants (gray bars in the upper panel) and the right observing participants (black bars in the lower panel) across the observation sessions in Experiment-2. The three gray dashed lines indicate the positions of the left, center, and right vertical lines presented on the touch screen, respectively. The 20 touch locations are binned into 10 bins of 5 mm width between the left and right vertical lines. The order of presentation of video clips during the observation task was randomized among sessions.
Author response image 1.
Author response image 1.. All trial data from all participants in Experiment-1.
Different colors and shapes indicate different groups and participants, respectively. Each data point shows a single trial data of a single participant. Error bars show 95% confidence interval of the mean.
Author response image 2.
Author response image 2.. The ten throw trials by each of all the thirty participants in the first throwing session of Experiment-1.
As in Author response image 1, different colors and shapes indicate different groups and participants, respectively.
Author response image 3.
Author response image 3.. The ten throw trials by each of all the thirty participants in the first reaching session of Experiment-2.
As in Author response image 1, different colors and shapes indicate different groups and participants, respectively.

Similar articles

Cited by

References

    1. Adams JA. Use of the model’s knowledge of results to increase the observer’s performance. Journal of Human Movement Studies. 1986;12:89–98.
    1. Becchio C, Pierno A, Mari M, Lusher D, Castiello U. Motor contagion from gaze: the case of autism. Brain. 2007;130:2401–2411. doi: 10.1093/brain/awm171. - DOI - PubMed
    1. Blakemore SJ, Frith C. The role of motor contagion in the prediction of action. Neuropsychologia. 2005;43:260–267. doi: 10.1016/j.neuropsychologia.2004.11.012. - DOI - PubMed
    1. Brass M, Bekkering H, Prinz W. Movement observation affects movement execution in a simple response task. Acta Psychologica. 2001;106:3–22. doi: 10.1016/S0001-6918(00)00024-X. - DOI - PubMed
    1. Brown LE, Wilson ET, Obhi SS, Gribble PL. Effect of trial order and error magnitude on motor learning by observing. Journal of Neurophysiology. 2010;104:1409–1416. doi: 10.1152/jn.01047.2009. - DOI - PMC - PubMed

Publication types