Review
. 2018 Jun:5:6-20.
doi: 10.1016/j.pvr.2017.10.001. Epub 2017 Oct 19.

Murine HPV16 E7-expressing transgenic skin effectively emulates the cellular and molecular features of human high-grade squamous intraepithelial lesions

Affiliations
Review

Murine HPV16 E7-expressing transgenic skin effectively emulates the cellular and molecular features of human high-grade squamous intraepithelial lesions

Z K Tuong et al. Papillomavirus Res. 2018 Jun.

Abstract

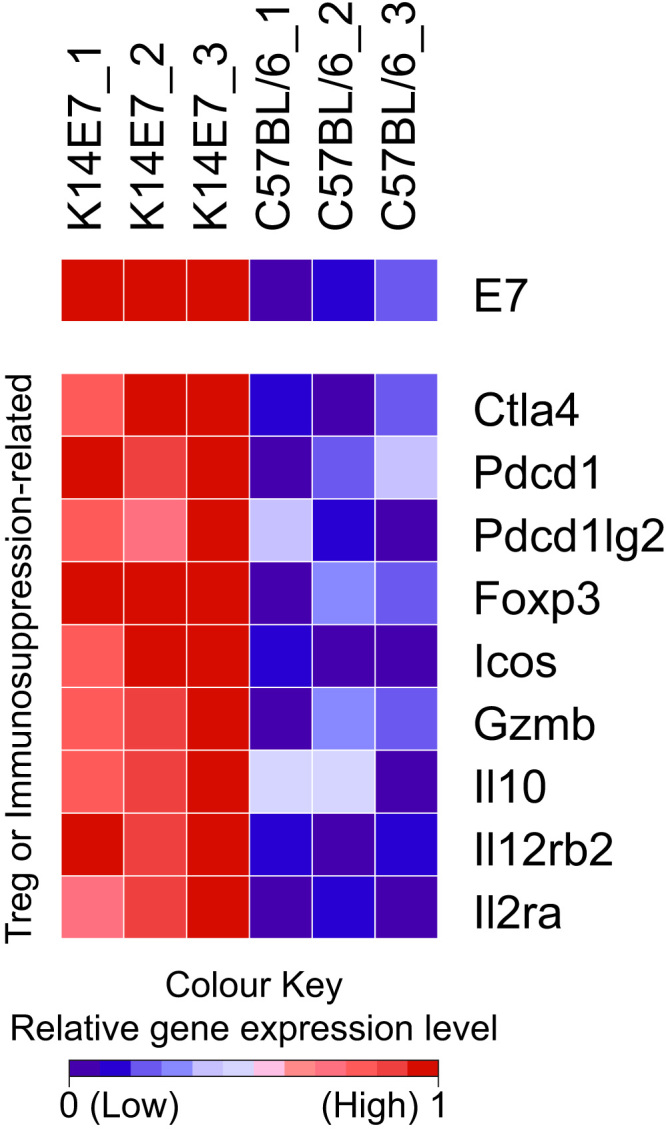
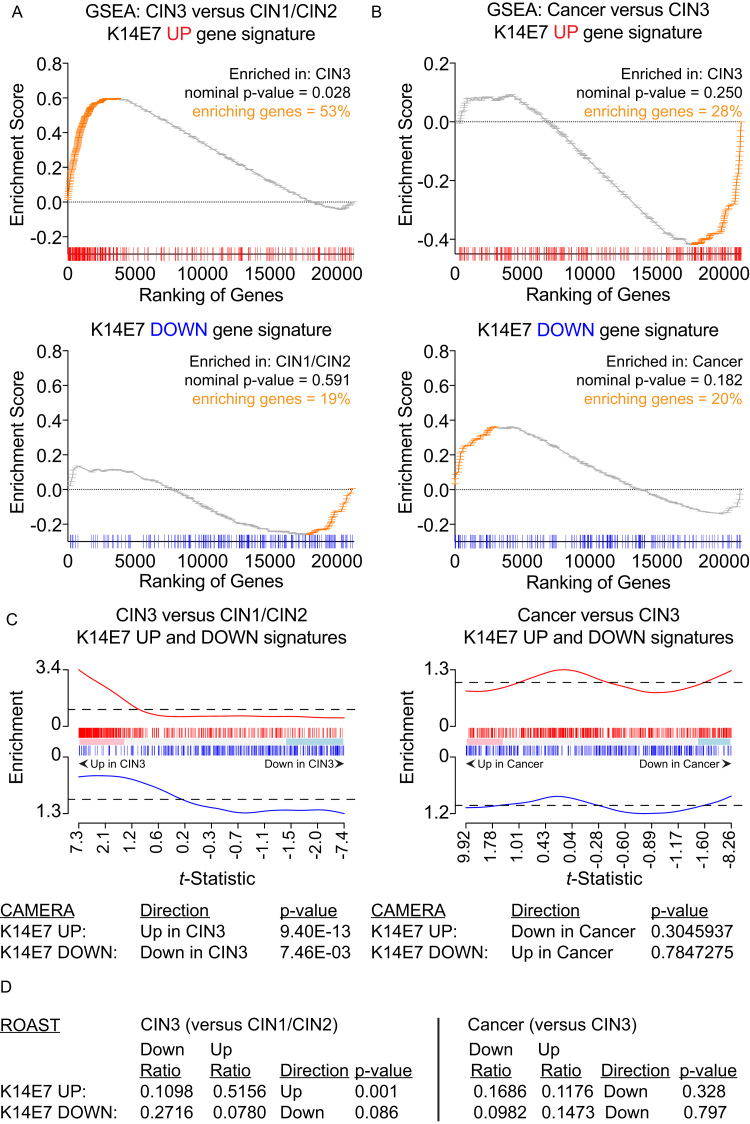
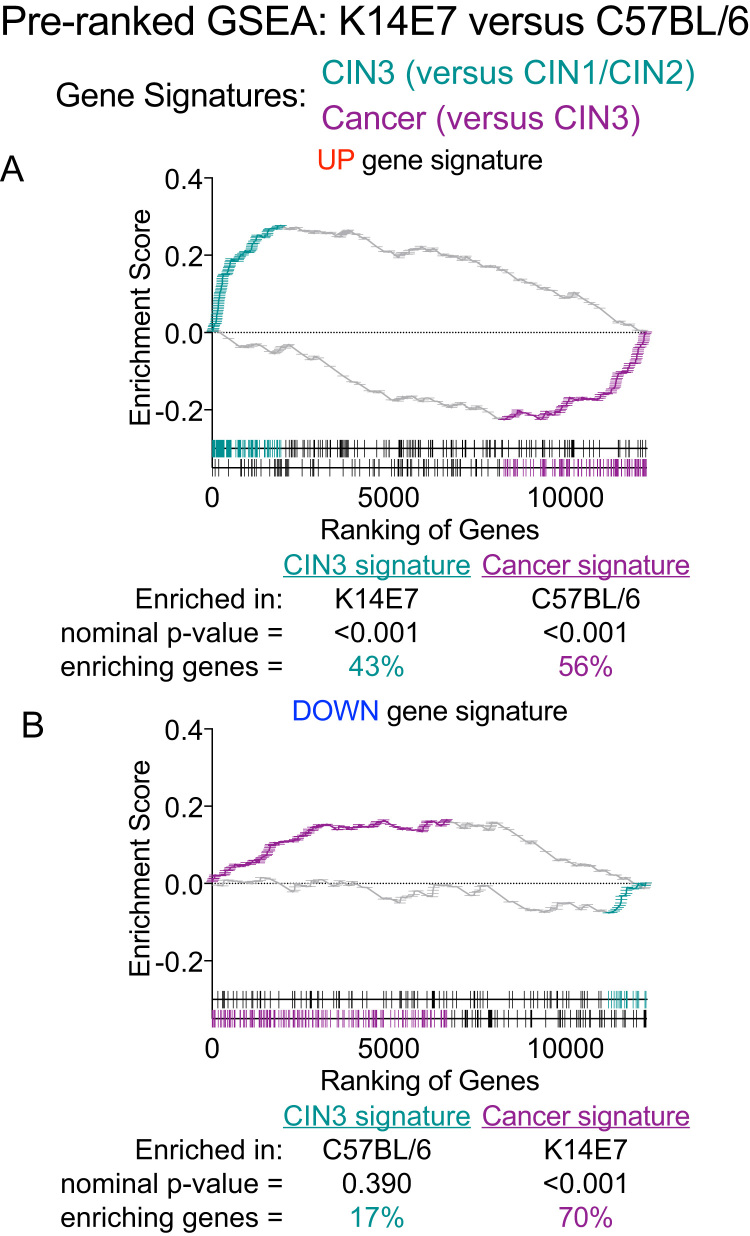
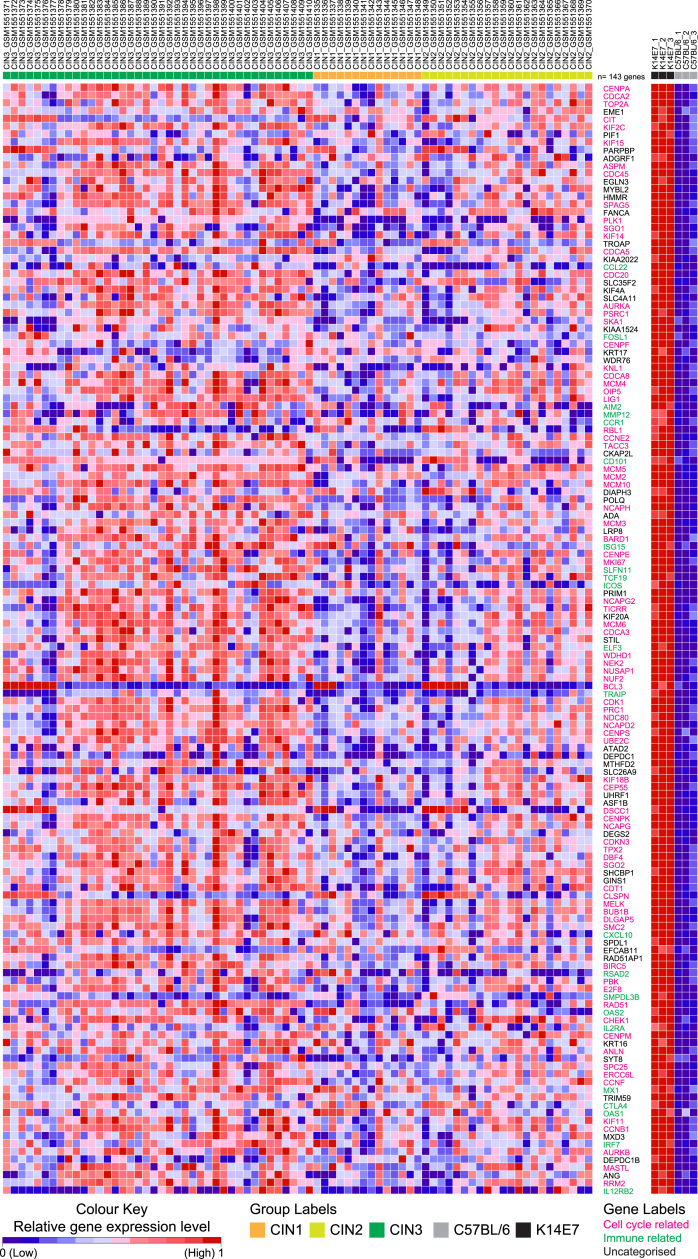
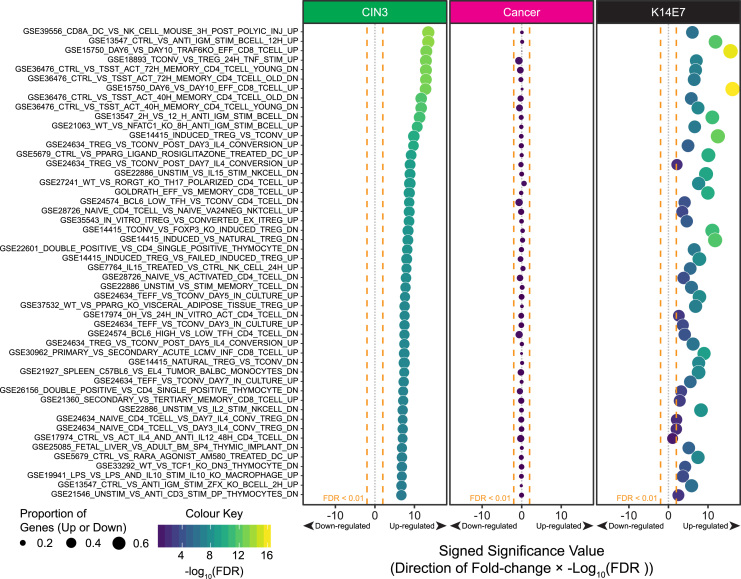
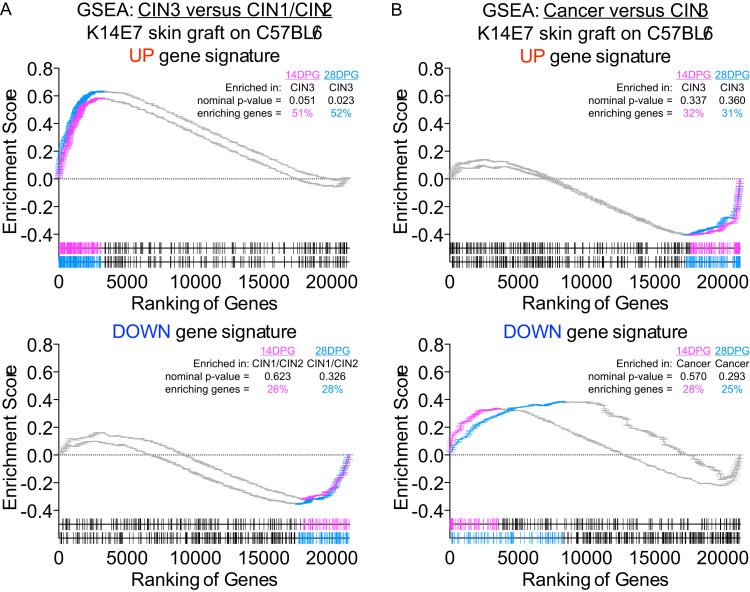
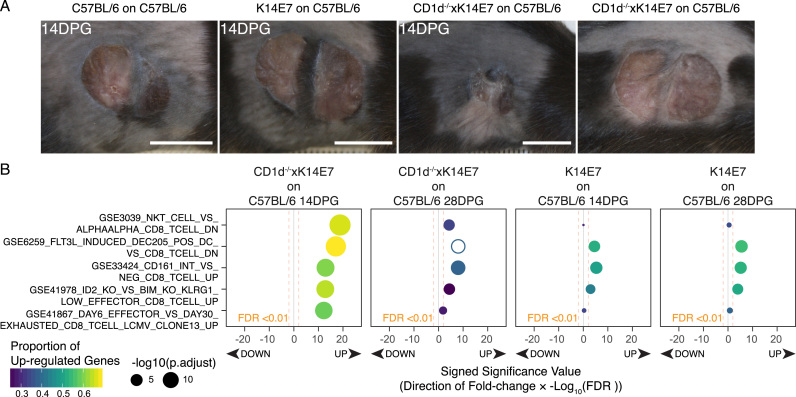
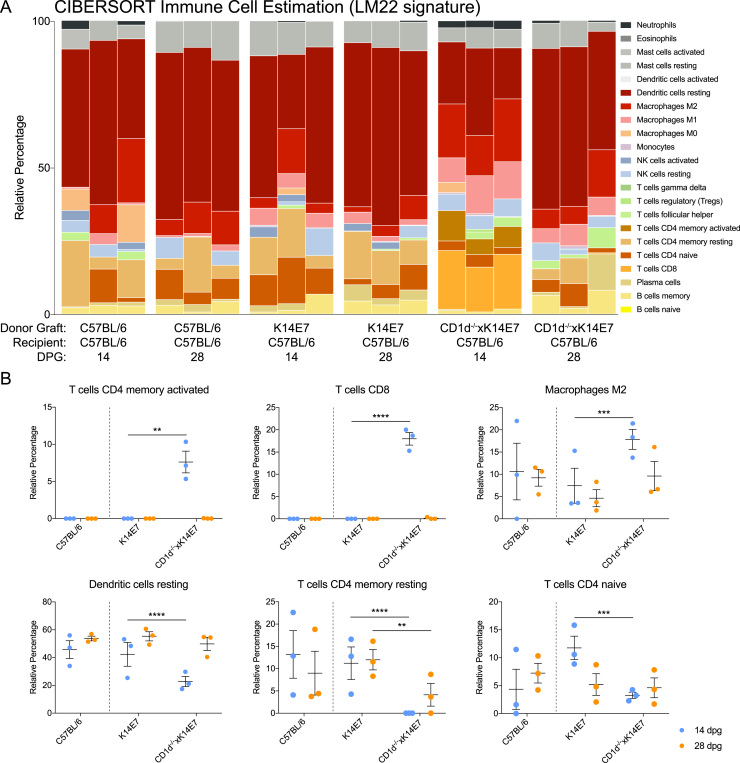
Currently available vaccines prevent HPV infection and development of HPV-associated malignancies, but do not cure existing HPV infections and dysplastic lesions. Persistence of infection(s) in immunocompetent patients may reflect induction of local immunosuppressive mechanisms by HPV, providing a target for therapeutic intervention. We have proposed that a mouse, expressing HPV16 E7 oncoprotein under a Keratin 14 promoter (K14E7 mice), and which develops epithelial hyperplasia, may assist with understanding local immune suppression mechanisms that support persistence of HPV oncogene-induced epithelial hyperplasia. K14E7 skin grafts recruit immune cells from immunocompetent hosts, but consistently fail to be rejected. Here, we review the literature on HPV-associated local immunoregulation, and compare the findings with published observations on the K14E7 transgenic murine model, including comparison of the transcriptome of human HPV-infected pre-malignancies with that of murine K14E7 transgenic skin. We argue from the similarity of i) the literature findings and ii) the transcriptome profiles that murine K14E7 transgenic skin recapitulates the cellular and secreted protein profiles of high-grade HPV-associated lesions in human subjects. We propose that the K14E7 mouse may be an appropriate model to further study the immunoregulatory effects of HPV E7 expression, and can facilitate development and testing of therapeutic vaccines.


Figures

Fig. 1
Fig. 1
Relative gene expression heat map of selected genes associated with immune cell dysfunction and Treg markers. The colour scheme of the heat map corresponds to the relative expression level normalised to a range from 0 to 1 using the minimum and maximum values within each row/gene and represented as a colour gradient from blue to red. (For interpretation of the references to color in this figure legend, the reader is referred to the web version of this article.)
Fig. 2
Fig. 2
Gene set testing of K14E7 ‘UP’ and ‘DOWN’ gene signatures in human CIN3 versus CIN1/CIN2 and cervical cancer versus CIN3. (A-B) GSEA analysis of (A) CIN3 versus CIN1/CIN2 or (B) cancer versus CIN3 of K14E7 ‘UP’ or ‘DOWN’ signatures. Ranking of genes in the ‘UP’ gene signatures (red) or ‘DOWN’ gene signatures (blue) are shown at the bottom of each GSEA plot. Position and frequency of genes contributing the most to each enrichment are highlighted in orange. (C) Barcode enrichment plot of t-statistic ranked genes from LIMMA for CAMERA gene set testing. The enrichment value corresponds to the relative ‘weight’ value in LIMMA. (D) ROAST gene set testing of CIN3 versus CIN1/CIN2 or cancer versus CIN3. Proportion of genes corresponding to up or down regulated and assigned direction and p-value are shown. Genes are assigned to the up or down bins according to the probability formula specified in ROAST. (For interpretation of the references to color in this figure legend, the reader is referred to the web version of this article.)
Fig. 3
Fig. 3
Pre-ranked GSEA of CIN3 or Cancer ‘UP’ and ‘DOWN’ gene signatures in K14E7 versus C57Bl/6. Ranking of genes in the ‘UP’ gene signatures or ‘DOWN’ gene signatures in the K14E7 ranked list are shown at the bottom of each pre-ranked GSEA plot. Position and frequency of genes contributing the most to each enrichment are highlighted in teal for genes in CIN3 signatures or purple for genes in Cancer signatures. (For interpretation of the references to color in this figure legend, the reader is referred to the web version of this article.)
Fig. 4
Fig. 4
Heat map of relative gene expression of genes that contribute the most to the enrichment of K14E7 ‘UP’ gene set in CIN3 versus CIN1/CIN2. Relative gene expression in K14E7 mice and C57BL/6 mice are provided in the right panel. The colour scheme for both heat maps correspond to the relative expression level normalised to a range from 0 to 1 using the minimum and maximum values within each row/gene and represented as a colour gradient from blue to red. Sample groups for each are additionally provided with coloured annotations. Gene symbols that correspond to cell cycle-related genes are annotated in pink and gene symbols that correspond to immune-related genes are annotated in green. Uncategorised gene symbols are in black. (For interpretation of the references to color in this figure legend, the reader is referred to the web version of this article.)
Fig. 5
Fig. 5
CAMERA gene set testing of immunologic gene sets in MSigDB C7. Differential gene expression testing for CIN3 versus CIN1/CIN2 (green column), cancer versus CIN3 (pink column) and K14E7 versus C57BL/6 (black column) were performed using LIMMA. The Empirical Bayesian t-statistics from the analysis was used for the ranking of genes in each comparison for CAMERA gene set testing. The significance value of the CAMERA gene set test, Log10 transformed false discovery rate (FDR) adjusted p-values, for each gene set are plotted along the viridis colour scale (purple, blue, green to yellow) in each bubble as well as on the x-axis where the direction regulation of the of the gene set (up or down; +1 or −1) is multiplied to the significance value. The size of the bubbles correspond to the proportion of genes that are up or down-regulated in each gene set calculated by ROAST where up-regulated pathways were plotted with proportion of up-regulated genes and vice versa. (For interpretation of the references to color in this figure legend, the reader is referred to the web version of this article.)
Fig. 6
Fig. 6
Gene set testing of K14E7 on C57BL/6 14DPG and 28DPG ‘UP’ and ‘DOWN’ gene signatures in human CIN3 versus CIN1/CIN2 and cervical cancer versus CIN3. (A-B) GSEA analysis of (A) CIN3 versus CIN1/CIN2 or (B) cancer versus CIN3 of K14E7 on C57BL/6 14DPG and 28DPG ‘UP’ or ‘DOWN’ signatures. Ranking of genes in the ‘UP’ gene signatures or ‘DOWN’ gene signatures are shown at the bottom of each GSEA plot. Position and frequency of genes contributing the most to each enrichment are highlighted (14DPG, pink; 28DPG, blue). (For interpretation of the references to color in this figure legend, the reader is referred to the web version of this article.)
Fig. 7
Fig. 7
CAMERA gene set testing of CD8 T cell immunologic gene sets from MSigDB C7 in grafting comparisons. (A) Photographs of representative grafts from the various donors and recipients prior to sample collection at 14DPG or 28DPG. (B) Top 5 CD8 T cell related immunological gene sets from CAMERA gene set testing. The significance value of the CAMERA gene set test, Log10 transformed false discovery rate (FDR) adjusted p-values, for each gene set are plotted along the viridis colour scale (purple, blue, green to yellow) in each bubble as well as on the x-axis where the direction regulation of the of the gene set (up or down; +1 or −1) is multiplied to the significance value. The size of the bubbles correspond to the proportion of genes that are up-regulated in each gene set calculated by ROAST. (For interpretation of the references to color in this figure legend, the reader is referred to the web version of this article.)
Fig. 8
Fig. 8
CIBERSORT analysis of immune cell composition in grafting groups. (A) Relative percentage of the estimated immune cells in the various grafting groups. Each of the 22 immune cell types are assigned a different colour on the plot. (B) Relative fractions from (A) are plotted as a dot plot and two-way ANOVA analysis with Bonferonni's post-test was performed, specifically comparing CD1d-/-xK14E7 on C57BL/6 skin grafts versus K14E7 on C57BL/6 skin grafts at 14DPG or 28DPG separately. Significance is denoted by *P<0.05; **P<0.01; ***P<0.001; ****P<0.0001. (For interpretation of the references to color in this figure legend, the reader is referred to the web version of this article.)

Similar articles

Cited by

References

    1. Torre L.A., Bray F., Siegel R.L., Ferlay J., Lortet-Tieulent J., Jemal A. Global cancer statistics, 2012. CA: Cancer J. Clin. 2015;65:87–108. - PubMed
    1. Song D., Li H., Li H., Dai J. Effect of human papillomavirus infection on the immune system and its role in the course of cervical cancer. Oncol. Lett. 2015;10:600–606. - PMC - PubMed
    1. Walhart T. Human papillomavirus biology, pathogenesis, and potential for drug discovery: a literature review for HIV nurse clinical scientists. J. Assoc. Nurses AIDS Care: Janac. 2015;26:693–702. - PMC - PubMed
    1. Frazer I.H., Leggatt G.R., Mattarollo S.R. Prevention and treatment of papillomavirus-related cancers through immunization. Annu. Rev. Immunol. 2011;29:111–138. - PubMed
    1. Frazer I. Correlating immunity with protection for HPV infection. Int. J. Infect. Dis.: IJID: Off. Publ. Int. Soc. Infect. Dis. 2007;11(Suppl 2):S10–S16. - PubMed

MeSH terms

Substances

LinkOut - more resources