

Mapping DNA damage-dependent genetic interactions in yeast via party mating and barcode fusion genetics
- PMID: 29807908
- PMCID: PMC5974512
- DOI: 10.15252/msb.20177985
Mapping DNA damage-dependent genetic interactions in yeast via party mating and barcode fusion genetics
Abstract
Condition-dependent genetic interactions can reveal functional relationships between genes that are not evident under standard culture conditions. State-of-the-art yeast genetic interaction mapping, which relies on robotic manipulation of arrays of double-mutant strains, does not scale readily to multi-condition studies. Here, we describe barcode fusion genetics to map genetic interactions (BFG-GI), by which double-mutant strains generated via en masse "party" mating can also be monitored en masse for growth to detect genetic interactions. By using site-specific recombination to fuse two DNA barcodes, each representing a specific gene deletion, BFG-GI enables multiplexed quantitative tracking of double mutants via next-generation sequencing. We applied BFG-GI to a matrix of DNA repair genes under nine different conditions, including methyl methanesulfonate (MMS), 4-nitroquinoline 1-oxide (4NQO), bleomycin, zeocin, and three other DNA-damaging environments. BFG-GI recapitulated known genetic interactions and yielded new condition-dependent genetic interactions. We validated and further explored a subnetwork of condition-dependent genetic interactions involving MAG1, SLX4, and genes encoding the Shu complex, and inferred that loss of the Shu complex leads to an increase in the activation of the checkpoint protein kinase Rad53.
Keywords: en masse; DNA barcode; condition‐dependent; genetic interaction; sequencing.
© 2018 The Authors. Published under the terms of the CC BY 4.0 license.
Figures
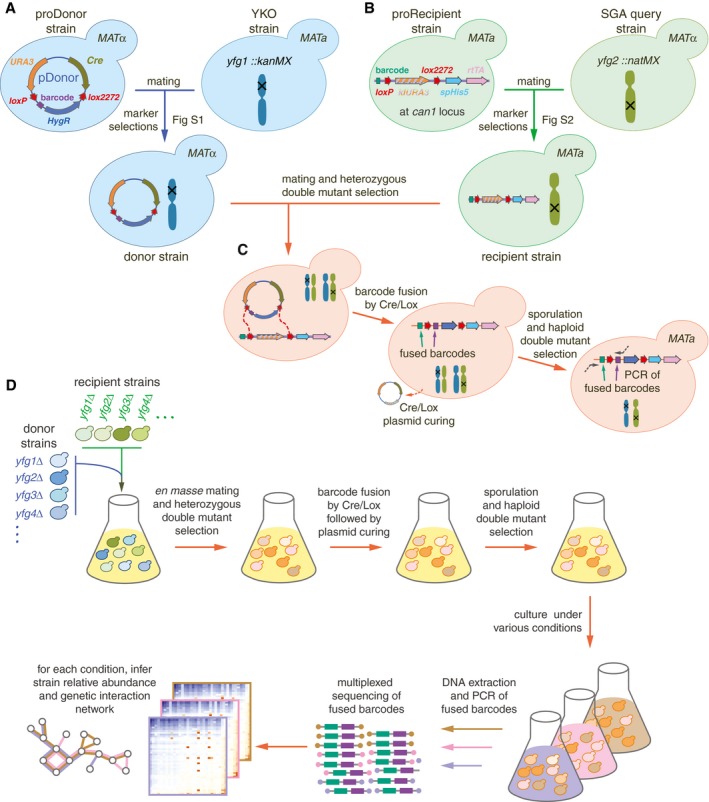
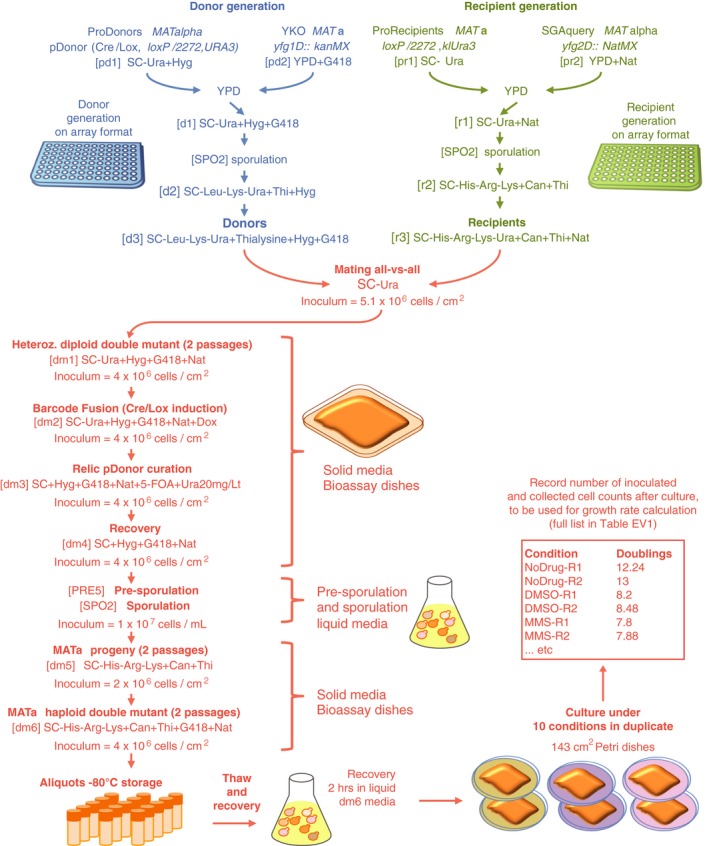
Construction of donors with unique barcodes representing each gene deletion in parental strains from the YKO collection.
Construction of recipients also with unique barcodes representing genes of interest in parental strains from the SGA query collection. Pairs of recombination sites (loxP and lox2272) were located at the barcode loci of donor and recipient strains to enable in vivo intracellular fusion of barcode pairs at the recipient barcode locus.
Donors and recipients were mated with each other to generate heterozygous diploid double mutants, and barcodes were fused in vivo by the Cre/Lox system. The relic plasmid remaining in donors after Cre/Lox recombination was counter‐selected after barcode fusion. Sporulation was induced to select for the MAT a progeny and haploid double mutants.
BFG‐GI was conducted en masse to generate “many‐by‐many” pools for a set of 26 DNA repair and 14 neutral genes. The resulting pool of haploid double mutants was stored as aliquots of glycerol stock. Thawed aliquots were used to inoculate media containing different chemical agents (“drugs”). Genomic DNA was extracted and fused barcodes were amplified and sequenced to monitor double‐mutant abundance and to infer genetic interactions. Details of donor and recipient strain construction are shown in Figs EV1 and EV2, respectively. Media details are shown in Fig EV3.
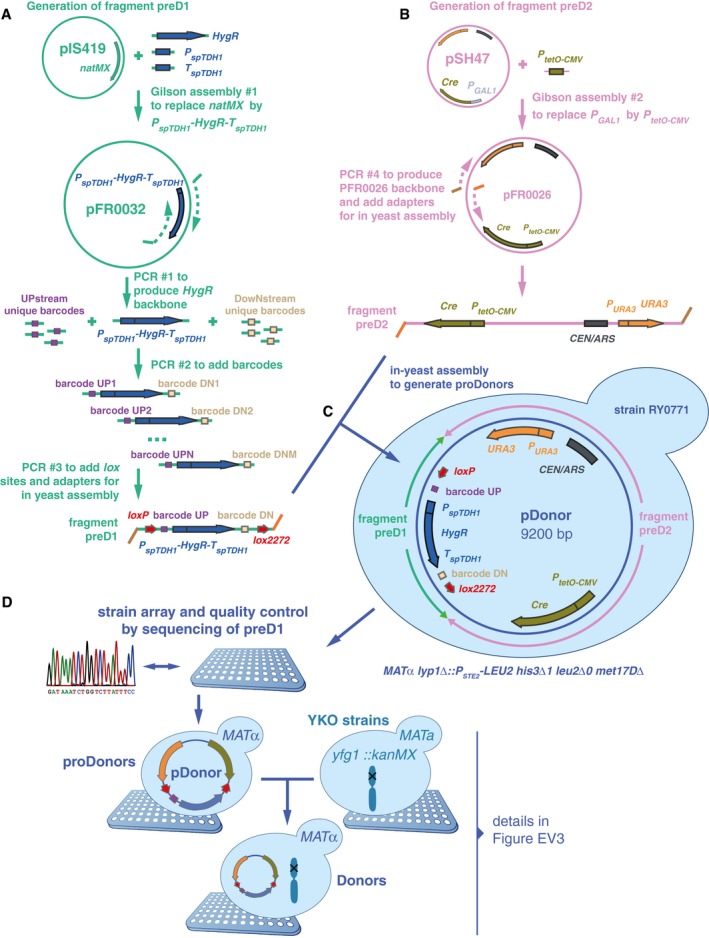
Two fragments were built to generate proDonor plasmids. The first, preD1, contained loxP/lox2272 sites flanking two 20‐bp unique barcodes and a hygromycin resistance marker. In this study, only the upstream barcode was used for further steps, and for simplification, the downstream barcode was omitted from Fig 1.
The second, preD2, contained the Cre recombinase driven by the doxycycline‐inducible tetO‐CMV, and a URA3 marker.
The two fragments were assembled in vivo in yeast to generate pDonors.
pDonors were arrayed and Sanger‐sequenced to confirm the integrity of the preD1 fragment. ProDonors with confirmed preD1 fragments were mated with YKO strains to generate strains carrying both a uniquely barcoded pDonor and a gene deletion of interest. Then, they were sporulated and the haploid MATalpha progeny were selected using the mating type maker indicated in panel (C). Details on selective media are shown in Fig EV3.
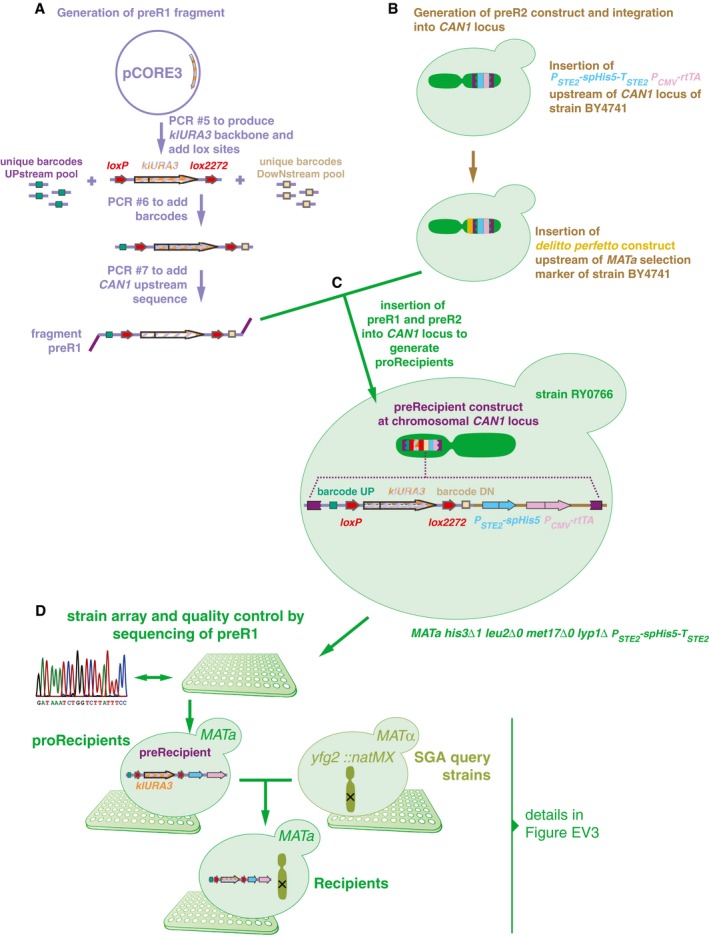
Two constructs were built to generate recipients. The first fragment, preR1, contained loxP/lox2272 sites flanking a klURA3 marker and two 20‐bp unique barcodes flanking these loci. In this study, only the upstream barcode was used for further steps, and for simplification, the downstream barcode was omitted from Fig 1.
The second construct, preR2, contained the can1Δ::P STE2 ‐spHis5‐T STE2 mating type marker.
The two fragments were assembled in vivo using a derivative of the delitto perfetto construct.
Resulting proRecipients were arrayed and Sanger‐sequenced to confirm integrity of preR1 loci. ProRecipients with confirmed preR1 loci were mated with SGA query strains to generate strains carrying both a uniquely barcoded recipient construct and a gene deletion of interest. Then, they were sporulated and the haploid MAT a progeny were selected using the mating type maker indicated in panel (C). Details on selective media are shown in Fig EV3.
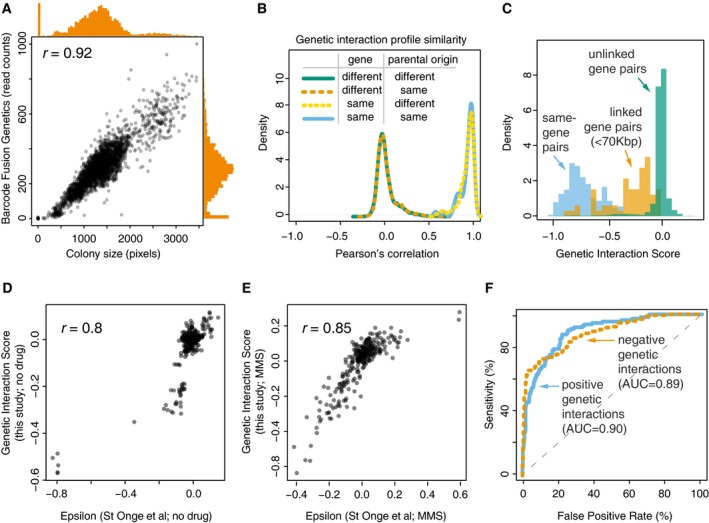
Correlation between two measures of cell abundance (colony size and next‐generation‐sequencing‐based quantification of fused barcodes) for BFG‐GI double‐mutant strains. Histograms show distribution of abundance in the two measurements. Peaks in the histograms representing data points in the bottom‐left corner of the scatter plot indicate that absent and very small colonies produced few or no sequencing reads.
Density plots for BFG‐GI genetic interaction score (GIS) correlation between replicates of the same gene, with same or different parental origin, or pairs of different genes. Only replicates with a GIS correlation > 0.5 were retained for further analyses.
Histograms comparing the GIS distribution for “same‐gene pairs” (which are expected to behave like synthetic lethals given the SGA double‐mutant selection process) with that for linked‐ and unlinked‐gene pairs.
Comparison of BFG‐GI‐inferred genetic interactions in haploid double‐mutant media without MMS with genetic interactions identified using similar media (St Onge et al, 2007).
Comparison of BFG‐GI‐inferred genetic interactions in haploid double‐mutant media containing MMS with genetic interactions previously identified in similar media (St Onge et al, 2007).
Benchmarking of BFG‐GI genetic interactions against the St. Onge et al (2007) dataset. Note that “false positives” may be real interactions that were not found in the benchmark study.
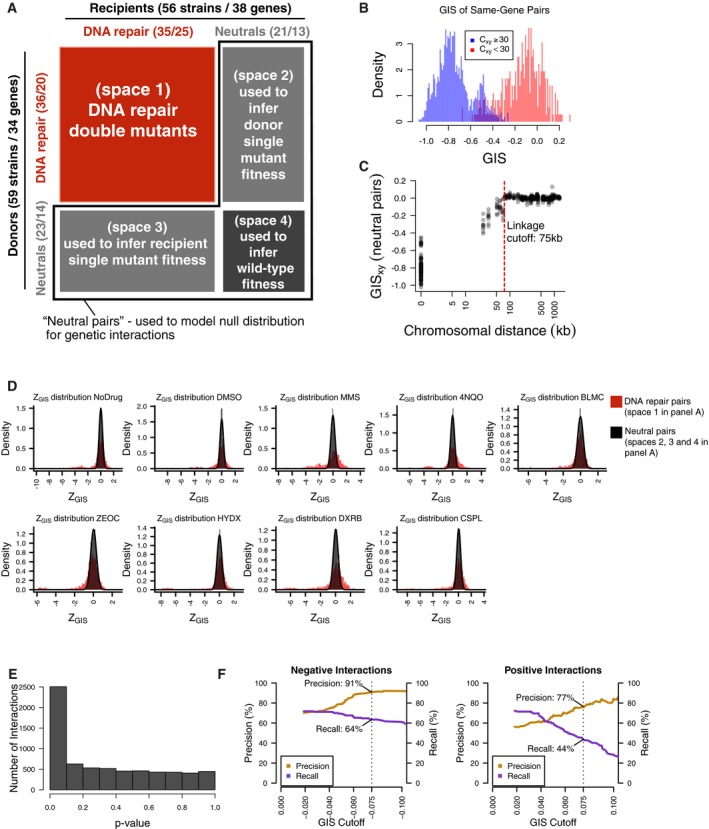
Two collections of 59 donor strains (containing 34 unique knockouts) and 56 recipient strains (containing 38 unique gene knockouts) were crossed against each other in an all‐by‐all pooled format. Each strain contains a knockout at either a DNA repair gene or neutral locus. Double‐knockout strains were divided into four spaces based on the types of genes knocked out. Numbers in parentheses represent the number of strains and unique gene knockouts, respectively.
Distribution of GIS amongst strain pairs containing the same gene, split by those which were well‐measured from the heterozygous diploid stage (C xy ≥ 30) and not well‐measured from the same stage (C xy < 30). Non‐well‐measured strains (72 out of 3,305) were excluded from analysis, and GIS was re‐calculated after their exclusion.
Distribution of GIS in strains representing linked neutral pairs. Using the GIS profiles, an empirical cutoff of 75 kbp (red dashed line) was chosen to classify strains with knockout pairs on the same chromosome as either linked or unlinked. GIS was then re‐calculated based on this linkage criterion.
Distribution of Z GIS calculated for DNA repair pairs (space 1 in panel A, red) and pairs involving well‐measured and unlinked neutral genes (spaces 2, 3, and 4 in panel A, black). Z GIS for pairs involving neutral genes were used to calculate a P‐value.
Distribution of P‐values calculated by the null distribution in (D). P‐values were combined for multiple barcode replicates of each gene–gene pair and converted to FDR scores (see Materials and Methods). Barcode‐level P‐values are available in Table EV3, and gene‐level FDR scores are available in Table EV4.
Benchmarks of BFG‐GI with data from St Onge et al (2007) for strains containing a significant genetic interaction (FDR < 0.01). Each graph shows precision and recall using the benchmark of St Onge et al (2007) as a function of an additional GIS effect‐size cutoff (left = negative interaction performance; right = positive interaction performance). Overlay text indicates performance at |GIS| = 0.075 (dashed lines), which was chosen as the effect‐size threshold.
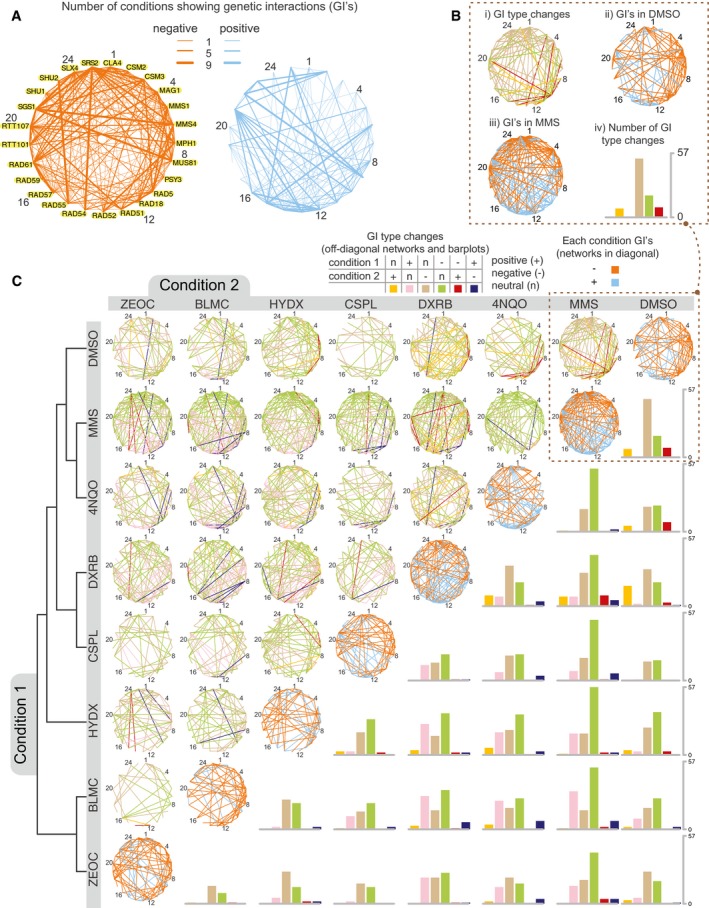
Networks showing the number of conditions with a genetic interaction for each gene pair (using FDR < 0.01 and |GIS| > 0.075 as cutoffs). Numbers besides gene names are guides for the reader to locate nodes in networks of panels (B) and (C). Data for individual interactions are available in Tables EV3 and EV4.
Networks in the diagonal (subpanels ii and iii) show genetic interactions for DMSO or MMS after applying the same criteria as in (A). The network in subpanel i shows significant genetic interaction changes (FDR < 0.01, |∆GIS| > 0.1) when comparing the DMSO and MMS treatments. Interaction types are positive (+), negative (−), or neutral (n). The barplot in subpanel iv summarizes the number of changes between interaction type in subpanel i.
The networks are the same as described in (B) with additional drug conditions: cisplatin (CSPL), doxorubicin (DXRB), hydroxyurea (HYDX), zeocin (ZEOC), bleomycin (BLMC), and 4NQO. The no‐drug condition was omitted from this figure as it showed no significant condition‐dependent genetic interactions with DMSO. GIS profiles were hierarchically clustered using maximum distance and complete linkage, with the resulting dendrogram shown on the left. Data for individual differential interactions are available in Tables EV5 and EV6. This figure was generated with Cytoscape (Shannon et al, 2009) and R scripts (R Core Team, 2017).
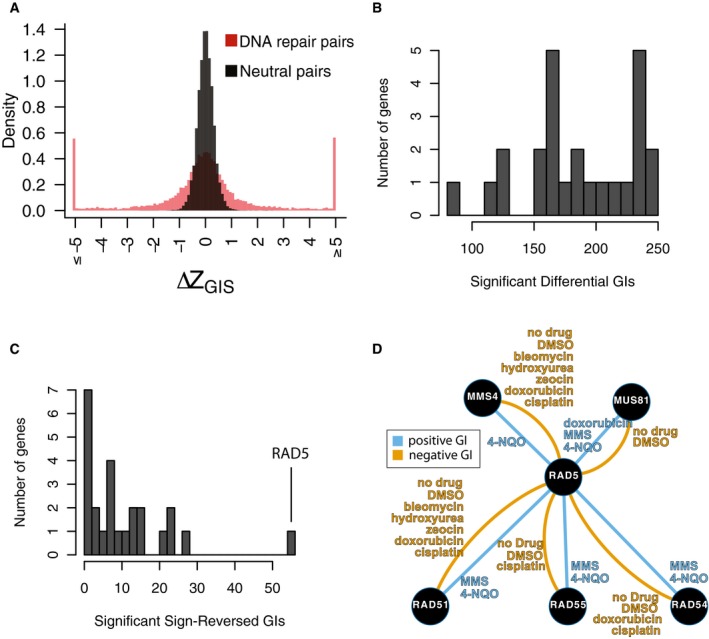
Distribution of ∆Z GIS for neutral pairs compared to DNA repair pairs. The distribution amongst neutral pairs was used to calculate a P‐value for ∆Z GIS amongst DNA repair pairs, which was then converted to an FDR for each differential interaction (see Materials and Methods; Table EV6). An additional effect‐size cutoff of |∆GIS| > 0.1 was added to call differential genetic interactions in Fig 3 and Table EV5.
Distribution of significant differential genetic interaction calls per gene.
Distribution of significant differential genetic interaction calls involving a reversal of direction (i.e., from positive to negative or vice versa) by gene. RAD5 is involved in 47 differential genetic interactions with a reversal of direction.
Summary of significant genetic interactions of RAD5 with MUS81, MMS4, RAD51, RAD54, or RAD55 in different conditions. Edges represent genetic interaction type and are labeled by conditions in which significant genetic interactions were found for the corresponding pair and direction.
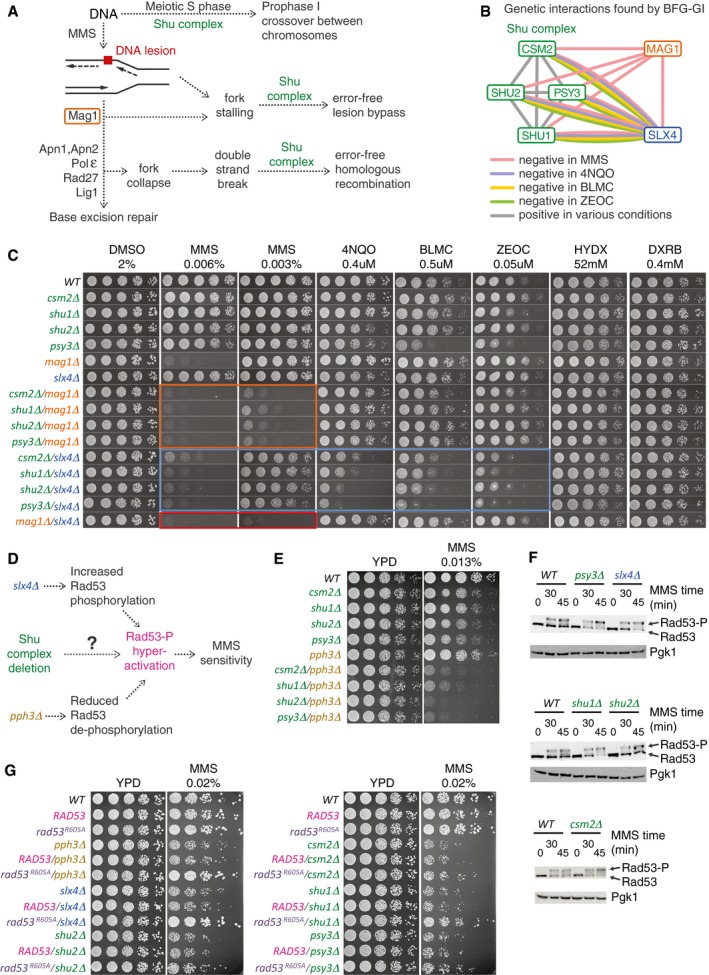
Pleiotropic participation of the Shu complex in DNA replication and repair pathways.
Network showing condition‐dependent genetic interactions inferred from BFG‐GI for the indicated conditions.
Confirmation of interactions between the Shu complex, MAG1, and SLX4 using spot dilution assays including single and double mutants exposed to the indicated drugs for 48 h. Orange, blue, and red boxes indicate genetic interactions of Shu complex members with MAG1 and SLX4, and of MAG1 with SLX4, respectively.
Schematic of potential functional connections between the Shu complex and SLX4. As with deletion of SLX4 or PPH3, deletion of Shu complex members may lead to hyperphosphorylation and hyperactivation of Rad53, resulting in increased sensitivity to MMS.
Spot dilution assays showing genetic interactions of Shu complex genes/pph3Δ double mutants and corresponding single mutants exposed to MMS at the indicated concentration for 48 h.
Western blot assays showing hyperphosphorylation of Rad53 in csm2Δ, psy3Δ, shu1Δ, and slx4Δ strains following treatment with 0.03% MMS. Note increased intensity of Rad53‐P bands compared with the Rad53 bands.
Spot dilution assays of Shu complex mutants expressing a hypomorphic rad53‐R605A allele (rad53‐R605A‐6xHis‐3xFLAG‐kanMX6) compared with a wild‐type RAD53 allele (RAD53‐6xHis‐3xFLAG‐kanMX6). Cells were exposed to MMS at the indicated concentration for 60 h.
References
-
- Ball LG, Zhang K, Cobb JA, Boone C, Xiao W (2009) The yeast Shu complex couples error‐free post‐replication repair to homologous recombination. Mol Microbiol 73: 89–102 - PubMed
-
- Bandyopadhyay S, Mehta M, Kuo D, Sung M‐K, Chuang R, Jaehnig EJ, Bodenmiller B, Licon K, Copeland W, Shales M, Fiedler D, Dutkowski J, Guénolé A, van Attikum H, Shokat KM, Kolodner RD, Huh W‐K, Aebersold R, Keogh M‐C, Krogan NJ et al (2010) Rewiring of genetic networks in response to DNA damage. Science 330: 1385–1389 - PMC - PubMed
-
- Baryshnikova A, Costanzo M, Kim Y, Ding H, Koh J, Toufighi K, Youn J‐Y, Ou J, San Luis B‐J, Bandyopadhyay S, Hibbs M, Hess D, Gingras A‐C, Bader GD, Troyanskaya OG, Brown GW, Andrews B, Boone C, Myers CL (2010) Quantitative analysis of fitness and genetic interactions in yeast on a genome scale. Nat Methods 7: 1017–1024 - PMC - PubMed
Publication types
MeSH terms
Substances
Grants and funding
LinkOut - more resources
Full Text Sources
Other Literature Sources
Molecular Biology Databases
Research Materials
