. 2018 Jun;4(6):365-375.
doi: 10.1038/s41477-018-0160-7. Epub 2018 May 28.

KIRA1 and ORESARA1 terminate flower receptivity by promoting cell death in the stigma of Arabidopsis

Affiliations

KIRA1 and ORESARA1 terminate flower receptivity by promoting cell death in the stigma of Arabidopsis

Zhen Gao et al. Nat Plants. 2018 Jun.

Abstract

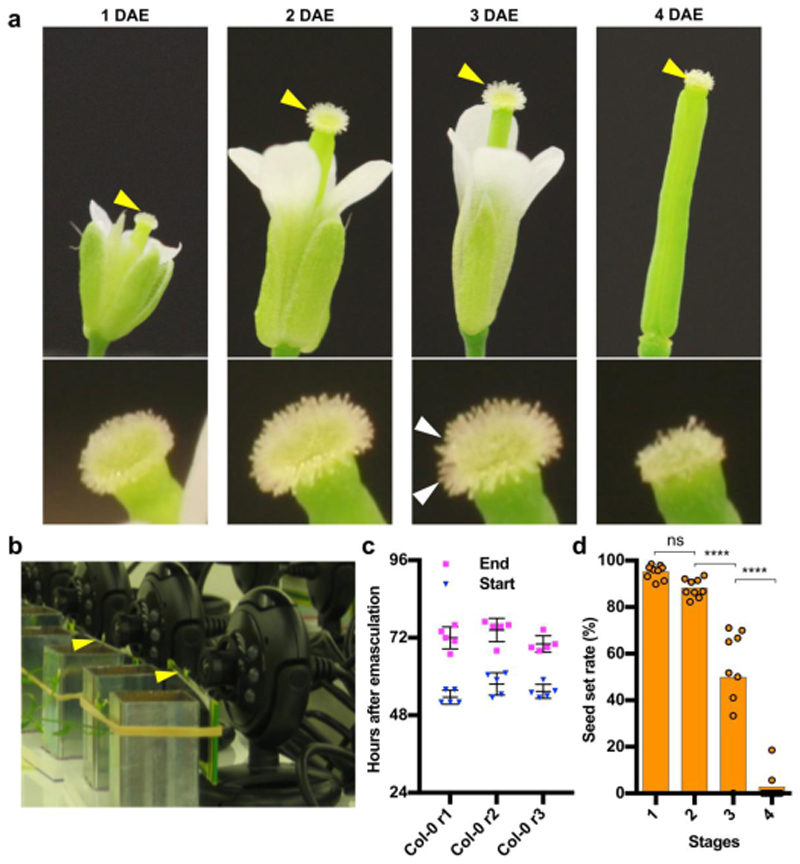
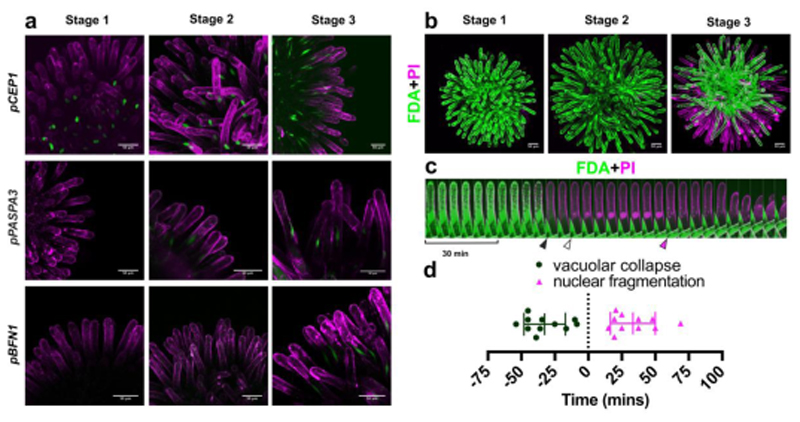
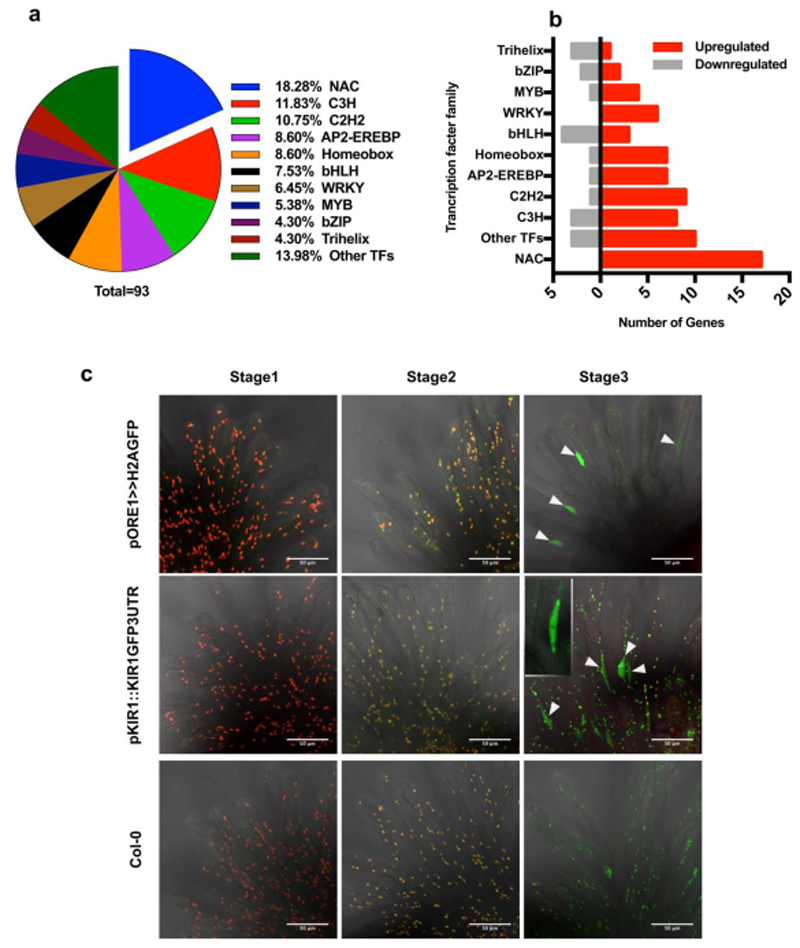
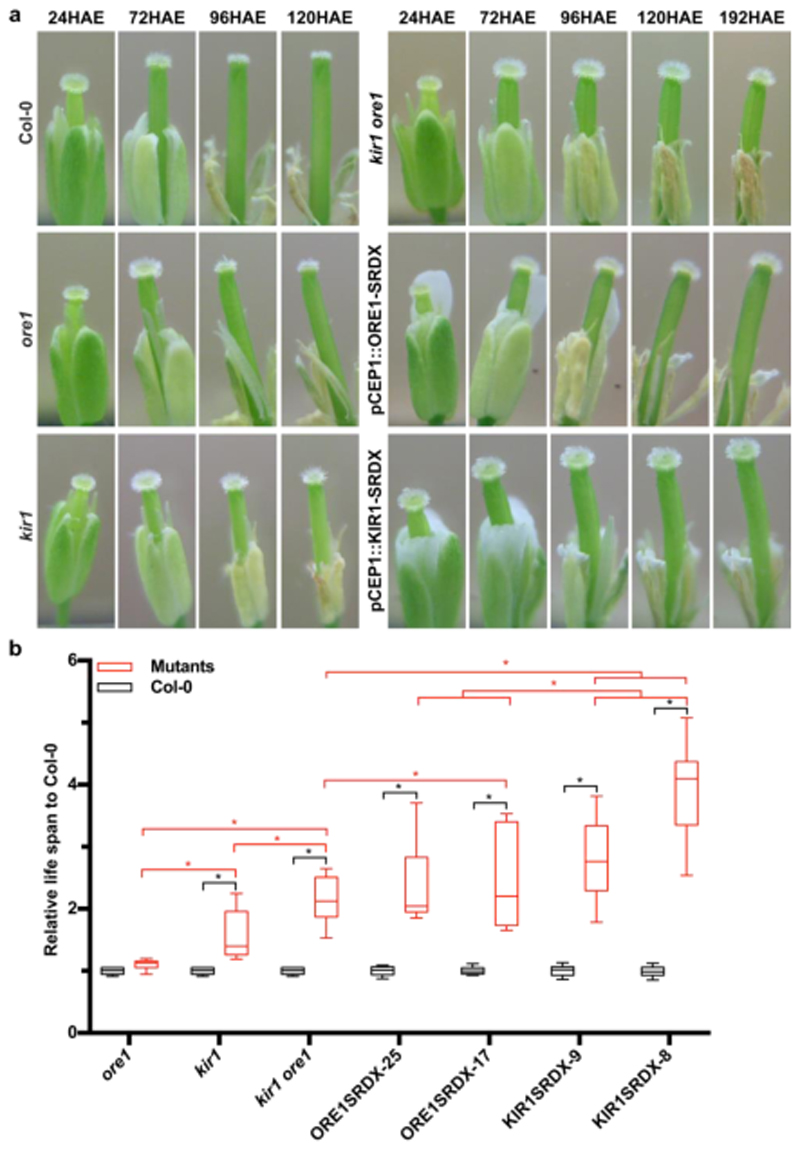
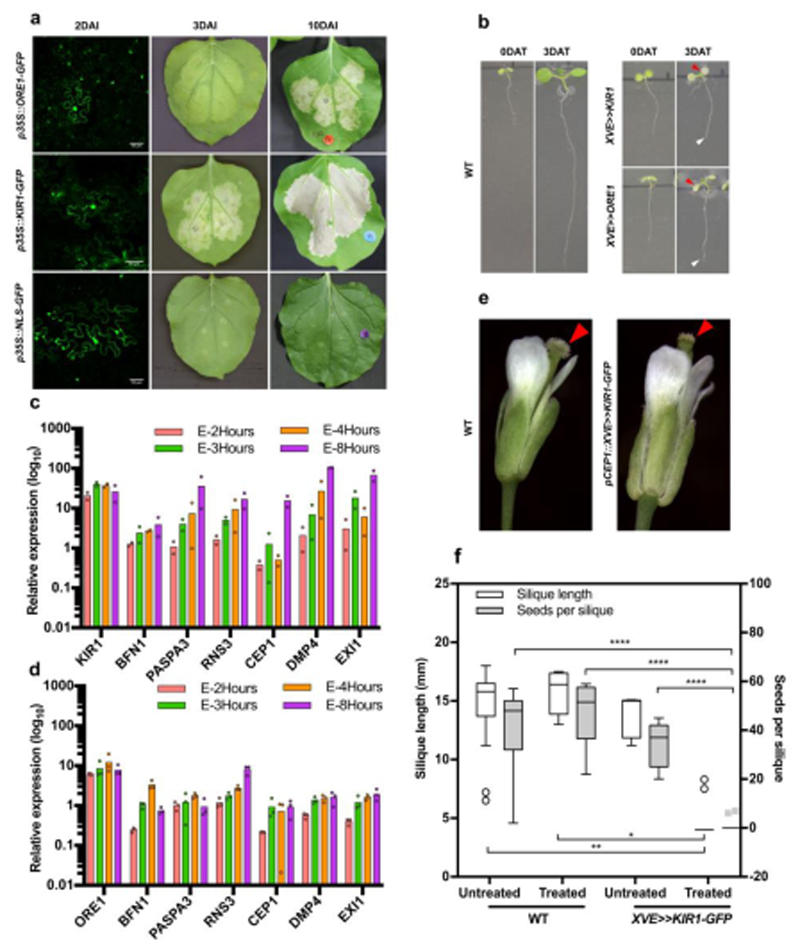
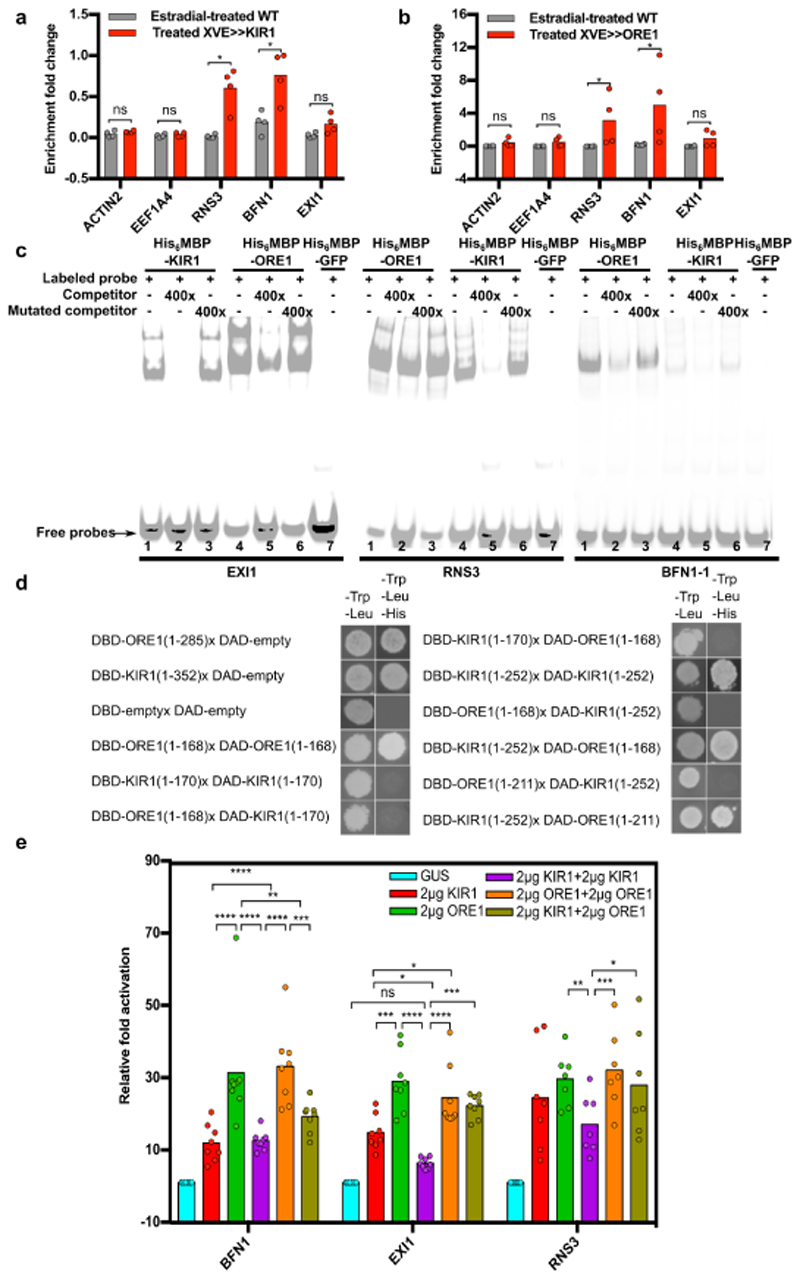
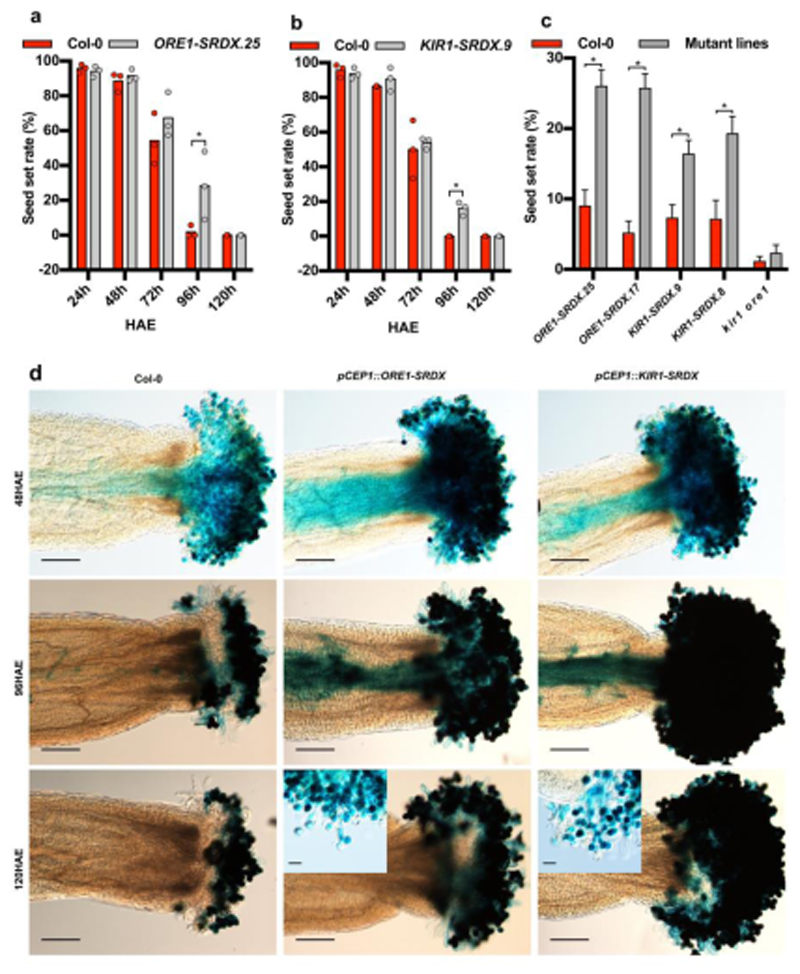
Flowers have a species-specific functional life span that determines the time window in which pollination, fertilization and seed set can occur. The stigma tissue plays a key role in flower receptivity by intercepting pollen and initiating pollen tube growth toward the ovary. In this article, we show that a developmentally controlled cell death programme terminates the functional life span of stigma cells in Arabidopsis. We identified the leaf senescence regulator ORESARA1 (also known as ANAC092) and the previously uncharacterized KIRA1 (also known as ANAC074) as partially redundant transcription factors that modulate stigma longevity by controlling the expression of programmed cell death-associated genes. KIRA1 expression is sufficient to induce cell death and terminate floral receptivity, whereas lack of both KIRA1 and ORESARA1 substantially increases stigma life span. Surprisingly, the extension of stigma longevity is accompanied by only a moderate extension of flower receptivity, suggesting that additional processes participate in the control of the flower's receptive life span.


Figures

Figure 1
Figure 1. Stigma degeneration is a developmentally timed process correlated with loss of floral receptivity.
a) Four stages of flower senescence after emasculation of plants grown in long-day conditions. At stage 1, or 1 day after emasculation (1 DAE), papilla cells are still short, whereas they are fully elongated at stage 2 (2 DAE). At stage 3 (3 DAE), the first papilla cells start to bend and collapse, and at stage 4 (4 DAE), stigma collapse is complete. The upper row shows the stigma, which are indicated with yellow arrowheads and given in detail in the lower row, with white arrows indicating the first groups of collapsing papilla cells. b) Webcam-based phenotyping platform. Arrowheads point at mounted flowers. c) Quantitative analysis of three independent webcam experiments conducted under continuous light, showing the reproducibility of occurrence of stage 3 (start) and stage 4 (end) of stigma senescence. Three individual replicates are shown; n = 5 flowers per replicate. Col0-r1: mean±SD=53.6±2.2h (beginning of collapse)/ mean±SD=72.00±3.39 h (end of collapse); Col0- r2: mean±SD=57.7±3.5h (beginning of collapse)/ mean±SD= 74.40±3.63 h (end of collapse); Col0-r3: mean±SD=55.4±2.2h (beginning of collapse)/ mean±SD=70.1±2.56 h (end of collapse). d) Stigma senescence is correlated with loss of reproductive potential. Whereas pollination at stage 1 and 2 results in full seed set, pollination at stages 3 and 4 shows a strong reduction in seed set. Data from three biological replicates are shown; n = 9 flowers per replicate (mean±SEM=95.16±3.01%, 88.08±3.94%, 49.89±22.94%, 2.70±6.25% for stage 1, stage 2, stage 3 and stage 4, respectively). Statistical differences were calculated using one-way ANOVA with multiple comparisons by Fisher’s LSD test; ns = non-significant.
Figure 2
Figure 2. Ageing unpollinated papilla cells die in a dPCD-like process.
a) Maximal projections of confocal microscopy images showing promoter-reporters of canonical dPCD-associated genes, which are expressed during stigma senescence. Green represents the nuclear-localized H2A-GFP reporter; magenta shows propidium iodide (PI) staining the cell wall. b) FDA (green) and PI (magenta) staining in different stages of stigma senescence shows loss of cellular viability in peripheral papilla cells at stage 3 by absence of FDA staining, and entry of PI into the dying cells. c) Kymograph of an individual papilla cell stained with FDA and PI, showing an attenuation of the FDA signal and vacuolar collapse (black arrowhead), followed by entry of PI in the nucleus (white arrowhead), abrupt nuclear fragmentation (magenta arrowhead), and cellular collapse. d) Quantification of the timing of vacuolar collapse and nuclear fragmentation in relation to PI entry into the nucleus (time point ‘0’). Scatter plot with mean±SD, n=11 cells from three different stigmata. Mean time of vacuolar collapse is -32.59 ± 15.44 minutes, mean time of nuclear fragmentation is 33.32 ± 16.8 minutes. Scale bars, 50 µm.
Figure 3
Figure 3. KIR1 and ORE1 are upregulated in senescent papilla cells.
a) Pie-chart showing the percentage of differentially expressed transcription factors of major families, with NAC family members representing the largest fraction. b) 17 NAC transcription factors are significantly upregulated during stigma senescence, more than members of other transcription factor families. c) Maximal projections of confocal microscopy images showing red plastid auto-fluorescence and green GFP fluorescence. Both the pORE1≫H2A-GFP transcriptional reporter and the pKIR1::KIR1-GFP-3’UTR translational reporter show a GFP signal in the fusiform papilla nuclei at stage 3 (arrowheads). The nucleus of a single papilla cell is shown in the inset. Note the change in the plastid auto-fluorescence spectrum from red over yellow to green during ageing, possibly caused by chlorophyll degradation. Scale bars, 50 µm.
Figure 4
Figure 4. ORE1 and KIR1 redundantly control stigma lifespan.
a) Representative snapshots of the webcam analysis of Col-0 and diverse ore1 and kir1 mutants. b) Quantitative analysis of the webcam experiments. In order to integrate several independent experiments in a comparative analysis, the lifespan of the stigmata in mutant lines was normalized to the Col-0 control in the individual experiments. While ore1 mutant stigmata live slightly but not significantly longer, kir1 and kir1 ore1 mutant stigmata are significantly longer living. Different independent lines of ORE1-SRDX and KIR1-SRDX show even stronger stigma life-extending effects. Black box-and-whiskers show Col-0 controls (from left to right, mean±SEM=1±0.014, 1±0.014, 1±0.014, 1±0.015, 1±0.017, 1±0.018, 1±0.018, N=15,15,15,20,13,20,17), red box-and-whiskers show mutants (from left to right, mean±SEM=1.101±0.020, 1.557±0.099, 2.139±0.091, 2.402±0.127, 2.472±0.213, 2.789±0.135, 3.881±0.196, N=15,15,15,19,14,20,14). Statistical differences were calculated using two-way ANOVA with multiple comparisons by Fisher’s LSD test. Black asterisks indicate the comparison between Col-0 and mutants, red asterisks show the comparison between different mutants, significance levels at * P<0.05.
Figure 5
Figure 5. Overexpression of ORE1 and KIR1 induces senescence and cell death symptoms to varying degrees.
a) Tobacco leaf infiltration with Agrobacterium carrying p35S::ORE1-GFP leads to expression of senescence symptoms at three days after infiltration (DAI), and cell death symptoms at 10 DAI, while p35S::KIR1-GFP expression induces cell death symptoms already at 3 DAI. Infiltration with p35S::NLS-GFP plasmid is used as a negative control; the presence of GFP signal at 2DAI (green) in all samples indicates successful transfection. b) Five-day-old Col-0 wild-type (WT) plants and seedlings of a representative line for an estradiol-inducible pRPS5A::XVE≫KIR1-GFP and pRPS5A::XVE≫ORE1-GFP construct directly after and three days after transfer to estradiol-containing medium (DAT). Red arrowheads indicate chlorotic cotyledons, white arrowheads the growth-arrested root tip. c-d) Real-time quantitative PCR reveals an increased accumulation of dPCD- associated transcripts in response to time-course estradiol treatment of 5-day-old XVE≫KIR1-GFP (c) and pRPS5A::XVE≫ORE1-GFP (d) seedlings. Expression values are relative to the reference genes PEX4 and UBL5; a minimum of two biological replicates are shown (n=20 seedlings per replicate). Expression data of estradiol- treated lines is normalized to mock-treated samples. e) Representative Col-0 wild-type and pCEP1::XVE≫KIR1- GFP flowers after estradiol treatment. Whereas the Col-0 stigma appears still viable, the KIR1-GFP stigma appears collapsed (arrowheads). f) Representative Col-0 and pCEP1::XVE≫KIR1-GFP flowers after estradiol treatment and pollination. Whereas silique elongation in WT indicates successful pollination and seed development, in estradiol-treated transgenic lines silique elongation appears severely reduced, and seed set is absent. Box-and-whisker plots are calculated following the Tukey method; white box-and-whisker plots show the silique length (from left to right, mean±SD=14.413±3.504, 15.788±1.762, 13.760±18.04, 4.390±1.207, N=15,8,5,20.), grey box-and-whisker plots show the seeds per silique (from left to right, mean±SD=40.933±18.211, 47.000±13.038, 34.200±9.576, 0.650±2.007, N=15,8,5,20.). white circles and gray rectangles show the outliers. Statistical differences were calculated using two-way ANOVA with multiple comparisons by Fisher’s LSD test. *=p<0.05, **=p<0.01, ****=p<0.0001. Scale bars, 50 µm.
Figure 6
Figure 6. ORE1 and KIR1 homo- and heterodimers directly control expression of dPCD-associated genes.
a) ChIP-qPCR showing the enrichment of dPCD-associated promoter fragments 24 h after estradiol-induced overexpression of pRPS5A::XVE≫KIR1-GFP. b) ChIP-qPCR showing the percentage of enrichment of dPCD- associated genes 48 h after estradiol-induced overexpression of pRPS5A::XVE≫ORE1-GFP. In both A and B, gray bars indicate the estradiol-treated Col-0 control, red bars show estradiol-treated pRPS5A::XVE≫KIR1-GFP or pRPS5A::XVE≫ORE1-GFP, respectively. Promoter fragments from ACTIN2 and EEF1A were used as negative controls. A mean of two biological replicates per experiment is shown (each biological replicate includes two technical repeats). c) Electrophoretic mobility shift assay. Purified His6-MBP-KIR1 and His6-MBP-ORE1 bind in vitro to a 40-bp sequence of the EXI1, RNS3, and BFN1 promoters, a clear band shift can be seen for the tested promoter fragments. Generally, weaker band shifts were observed, when a non-labeled competitor probe (400-fold excess) was added. In contrast, strong band shifts were detected again when a mutated competitor was added. d) Left panel: Y1H auto-activation assay showing transcriptional activation of full-length ORE1 and KIR1 proteins fused to the DBD domain in absence of a DAD-fused protein partner. C-terminally truncated versions do not auto-activate transcription in yeast any more. Right panel: Y2H assay showing interactions of ORE1 and KIR1 as homodimers, and of ORE1 and KIR1 as heterodimers. Note that DBD-KIR1 interacts with DAD- ORE1, but not vice versa. e) Transient expression assay (TEA) in tobacco BY-2 protoplasts quantifying the activation of dPCD promoters by p35S::KIR1 and p35S::ORE1 constructs. Promoter activation was measured based on firefly luciferase activity controlled by pBFN1, pEXI1, and pRNS3, and normalized to Renilla luciferase controlled by the constitutive p35S promoter. Note that co-transfection with both KIR1 and ORE1 did not lead to an additive, nor to a synergistic effect on promoter activation of all tested dPCD-associated genes. To account for the doubled amount of TF added in the case of dimerization assays, the respective control assays contained doubled amounts of KIR1 and ORE1 (4µg total TF plasmid).
Figure 7
Figure 7. Loss of KIR1 and ORE1 function moderately extends seed set in aged flowers.
a) Seed set assay of ageing Col-0 flowers versus ageing flowers of an ORE1-SRDX line showing a significant extension of floral receptivity only at 96 hours after emasculation (HAE). Three plants and one flower each were used per time point and per genotype; statistical differences were calculated using multiple t-test. b) The same assay showing a similar extension of floral receptivity in a KIR1-SRDX line. Three plants and one flower each were used per time point and per genotype. Statistical differences were calculated using multiple t-test; *=p<0.05. c) Comparison of the seed set in different genotypes after pollination at 96 HAE. Two independent ORE1-SRDX and KIR1-SRDX lines each show a significant extension of floral receptivity at this time point, whereas the kir1 ore1 double mutant shows no difference compared to the Col-0 wild type. * = p<0.05. Error bars show the standard error of the mean (SEM), Mean and SEM values were calculated from two independent experiments with 15 replicates, N=30. Statistical differences were calculated using multiple t-test. d) Pollen germination assay using pollen of a pLAT52::GUS reporter line. In accordance with the seed set assays, there is no qualitative difference between pollen tube growth towards the ovules after pollination at 48 HAE. In contrast to wild-type flowers, there are still pollen tubes growing through the styles in ORE1-SRDX and KIR1-SRDX flowers at 96 HAE. At 120 HAE, despite the viability of papilla cells in the ORE1-SRDX and KIR1-SRDX flowers, there are no pollen tubes growing through the style any more. In the last row of panels, higher magnification insets of ORE1-SRDX and KIR1-SRDX flowers at 120 HAE show that although many pollen grains still germinate, pollen tubes do not seem to grow effectively through the stigma any more. Scale bars, 200 µm in the main panels and 50 µm in the insets.

Comment in

  • The stigma of death.
    Bosch M, Franklin-Tong NVE. Bosch M, et al. Nat Plants. 2018 Jun;4(6):323-324. doi: 10.1038/s41477-018-0168-z. Nat Plants. 2018. PMID: 29808022 No abstract available.

References

    1. Rogers HJ. From models to ornamentals: how is flower senescence regulated? Plant Molecular Biology Reporter. 2013;82:563–574. doi: 10.1007/s11103-012-9968-0. - DOI - PubMed
    1. Jones ML. Ethylene signaling is required for pollination-accelerated corolla senescence in petunias. Plant Science. 2008;175:190–196.
    1. Williams RR. The Effect of Summer Nitrogen Applications on The Quality of Apple Blossom. Journal of Horticultural Science. 1965;40:31–41.
    1. Primack RB. Longevity of Individual Flowers. Annual Review of Ecology and Systematics. 1985;16:15–37.
    1. Shahri W, Tahir I. Flower senescence: some molecular aspects. Planta. 2014;239:277–297. doi: 10.1007/s00425-013-1984-z. - DOI - PubMed

Publication types

MeSH terms

Substances