. 2018 Jun;50(6):790-795.
doi: 10.1038/s41588-018-0135-7. Epub 2018 May 28.

The fecal metabolome as a functional readout of the gut microbiome

Affiliations

The fecal metabolome as a functional readout of the gut microbiome

Jonas Zierer et al. Nat Genet. 2018 Jun.

Abstract

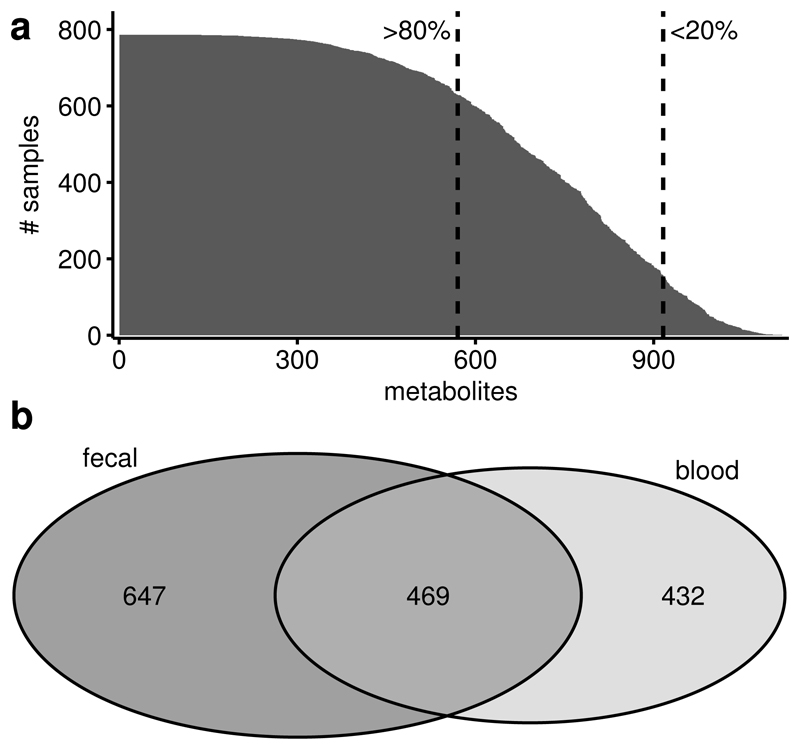
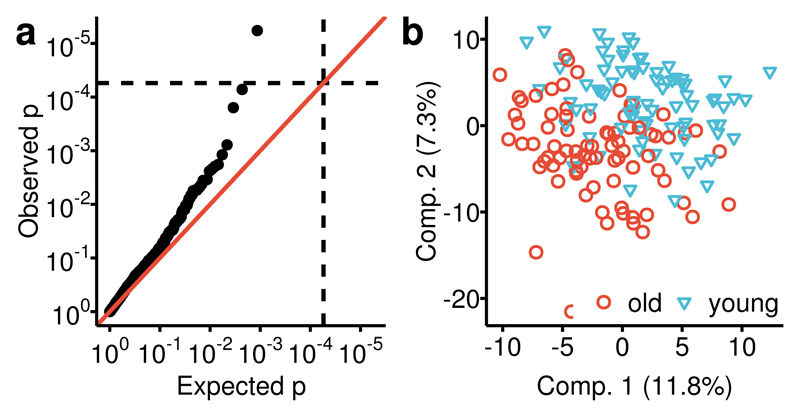
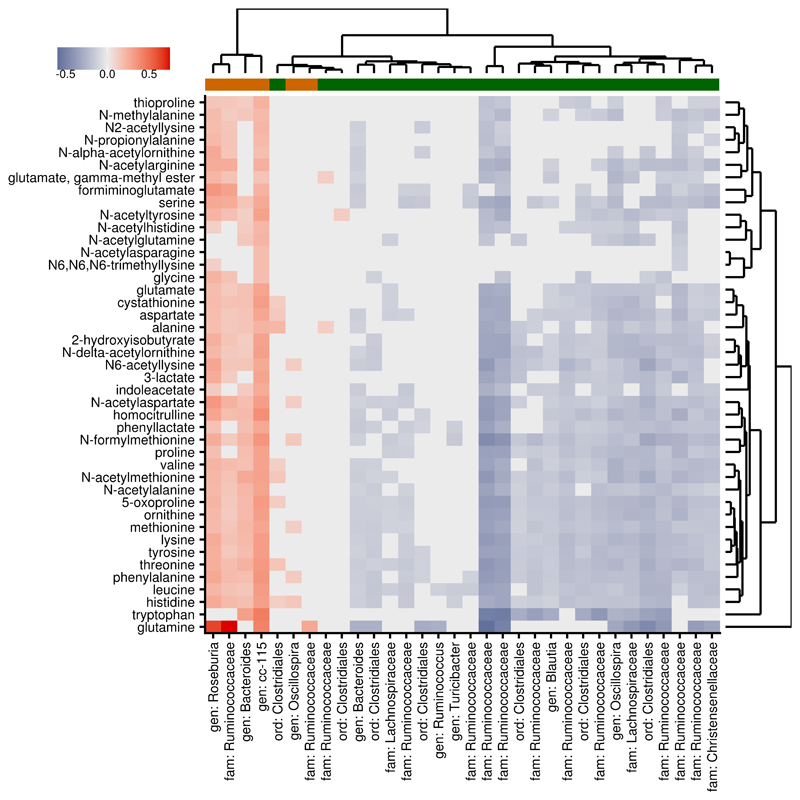
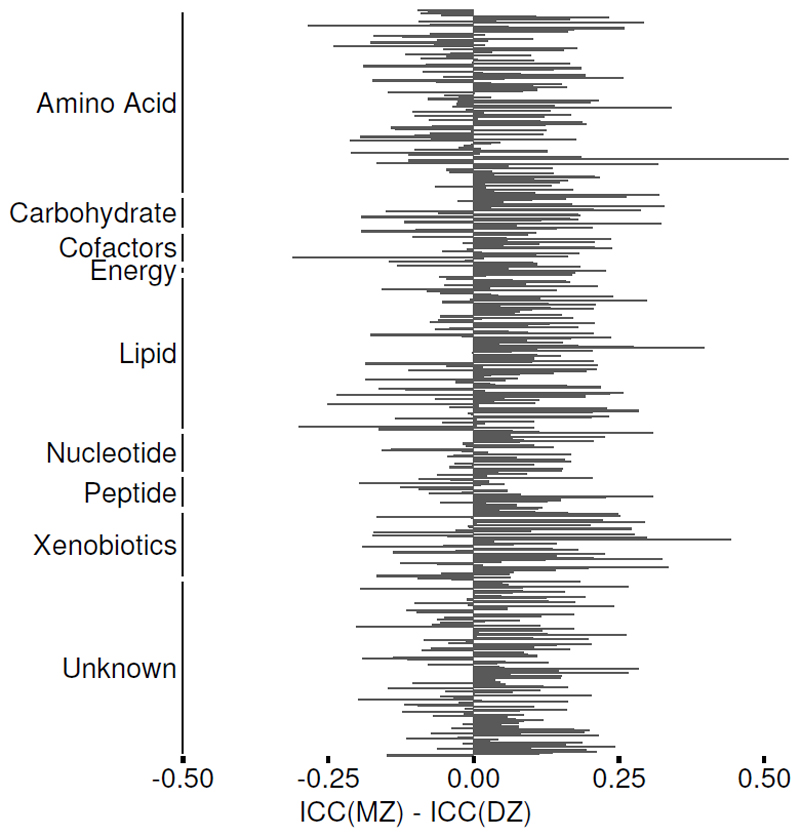
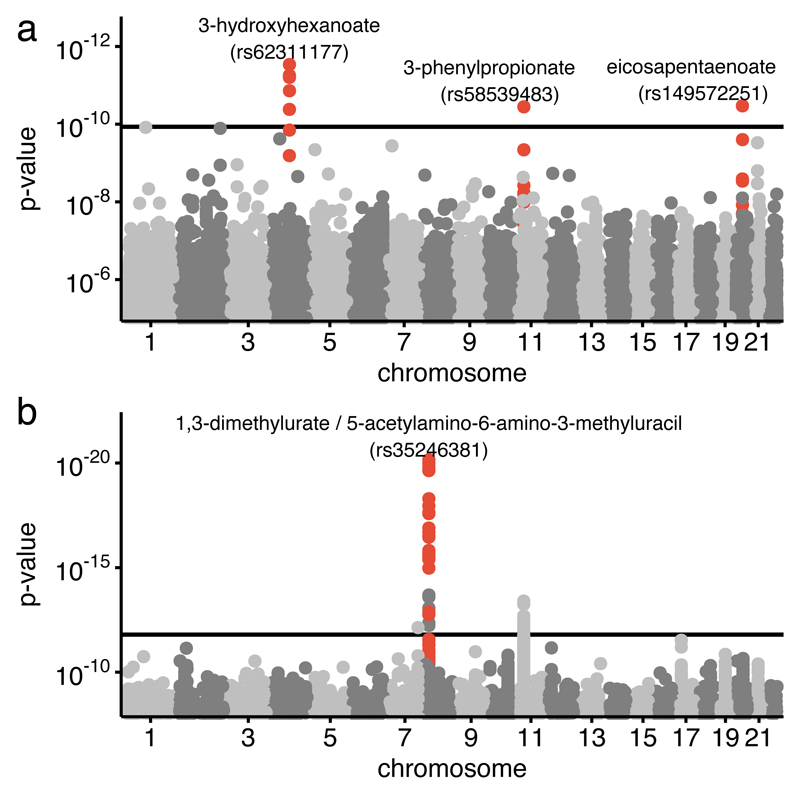
The human gut microbiome plays a key role in human health 1 , but 16S characterization lacks quantitative functional annotation 2 . The fecal metabolome provides a functional readout of microbial activity and can be used as an intermediate phenotype mediating host-microbiome interactions 3 . In this comprehensive description of the fecal metabolome, examining 1,116 metabolites from 786 individuals from a population-based twin study (TwinsUK), the fecal metabolome was found to be only modestly influenced by host genetics (heritability (H2) = 17.9%). One replicated locus at the NAT2 gene was associated with fecal metabolic traits. The fecal metabolome largely reflects gut microbial composition, explaining on average 67.7% (±18.8%) of its variance. It is strongly associated with visceral-fat mass, thereby illustrating potential mechanisms underlying the well-established microbial influence on abdominal obesity. Fecal metabolic profiling thus is a novel tool to explore links among microbiome composition, host phenotypes, and heritable complex traits.


Conflict of interest statement

Competing financial interests

RPM is employee of Metabolon, Inc. TL and AT were employees of HLI, Inc. at the time this work was conducted. TDS is co-founder of MapMyGut Ltd. All other authors declare no competing financial interests.

Figures

Figure 1
Figure 1. Number of measured fecal metabolites.
1116 metabolites were detected in 786 fecal samples. (a) 570 of those were detected in at least 80% of all samples and 345 were detected in less than 80% but more than 20% of all samples. The first were analyzed continuously, while we dichotomized the latter in present/absent. 210 metabolites that were present in less than 20% of the samples were excluded from further analysis. (b) 469 metabolites where observed in both, fecal and blood samples of the sample individuals, while 647 metabolites are unique to feces. 499 of these 647 metabolites were observed in at least 20% of the fecal samples.
Figure 2
Figure 2. Association of the fecal metabolome with age.
We compared the fecal metabolome between the oldest (>75 yrs., n=79) and youngest decile (<56 yrs., n=80) of the study population. (a) First, we investigated the age effect for all metabolites individually using logistic regression models and found one metabolite, phytanate, significantly different between the youngest and the oldest decile of our data. (b) Then, we fitted a multivariate PLS-DA model to distinguish the older (red) from the younger (blue) group. We estimated the area under the receiver operations curve (AUC) at 0.71 (p=6.8×10⁻⁶) in a 10-fold cross-validation.
Figure 3
Figure 3. Associations of fecal metabolites with gut microbiome corespond to microbial effect on visceral fat.
Visceral fat mass was significantly associated with 43 fecal amino acids (all positively) (n=647) and 32 OTUs (n=540) (6 positively in orange, 26 negatively in green). Red tiles indicate positive associations between these metabolites and OTUs (β > 0) and blue tiles negative associations (β < 0); grey tiles indicate non-significant associations (FDR > 5%). Microbial associations with fecal metabolites correspond to their respective associations with visceral fat, indicating that the microbial metabolic profile is more closely related to the host phenotype than taxonomy.
Figure 4
Figure 4. Intraclass correlation of fecal metabolites in MZ and DZ twins.
The intraclass correlation coefficients (ICCs) were calculated from variance components of a one-way analysis of variance separately for monozygotic (MZ, n=148 pairs) and dizygotic (DZ, n=155 pairs) twins for each metabolite. Positive values of their respective differences indicate more similar metabolic profiles between MZ than DZ twins.
Figure 5
Figure 5. Host genetic influence on the fecal metabolome
Genome-wide association studies were conducted for 428 heritable fecal metabolites and 31,226 fecal metabolite ratios (n=739). P-values were calculated using the score test implemented in GEMMA. (a) The Manhattan plot illustrates the genetic associations of fecal metabolites in the discovery sample. The horizontal line indicates the Bonferroni cutoff of 1.2×10⁻¹⁰. Three loci (red) pass the Bonferroni threshold. (b) The second Manhattan plot shows genetic associations with metabolite ratios in the discovery sample. The horizontal line indicates the Bonferroni cutoff of (p<1.6×10⁻¹²). Two loci pass the threshold, however only the association with 1,3-dimethylurate / 5-acetylamino-6-amino-3-methyluracil (p = 6.2×10⁻²¹, red) passed filtering by p-gain (p-gain > 8.9×10⁵) and thus is considerably stronger than the association of each individual metabolite. Boxplots, QQ-plots, and regional association plots for each of the four loci are shown in Supplementary Figures 1-3.

References

    1. O’Hara AM, Shanahan F. The gut flora as a forgotten organ. EMBO Rep. 2006;7:688–693. - PMC - PubMed
    1. Frias-Lopez J, et al. Microbial community gene expression in ocean surface waters. Proc Natl Acad Sci U S A. 2008;105:3805–10. - PMC - PubMed
    1. Marcobal A, et al. A metabolomic view of how the human gut microbiota impacts the host metabolome using humanized and gnotobiotic mice. ISME J. 2013;7:1933–43. - PMC - PubMed
    1. Ley R, Turnbaugh P, Klein S, Gordon J. Microbial ecology: human gut microbes associated with obesity. Nature. 2006;444:1022–3. - PubMed
    1. Turnbaugh PJ, et al. A core gut microbiome in obese and lean twins. Nature. 2009;457:480–484. - PMC - PubMed

Publication types

Substances