. 2018 Aug;410(20):4867-4873.
doi: 10.1007/s00216-018-1127-2. Epub 2018 May 29.

Proteins and antibodies in serum, plasma, and whole blood-size characterization using asymmetrical flow field-flow fractionation (AF4)

Affiliations

Proteins and antibodies in serum, plasma, and whole blood-size characterization using asymmetrical flow field-flow fractionation (AF4)

Mats Leeman et al. Anal Bioanal Chem. 2018 Aug.

Abstract

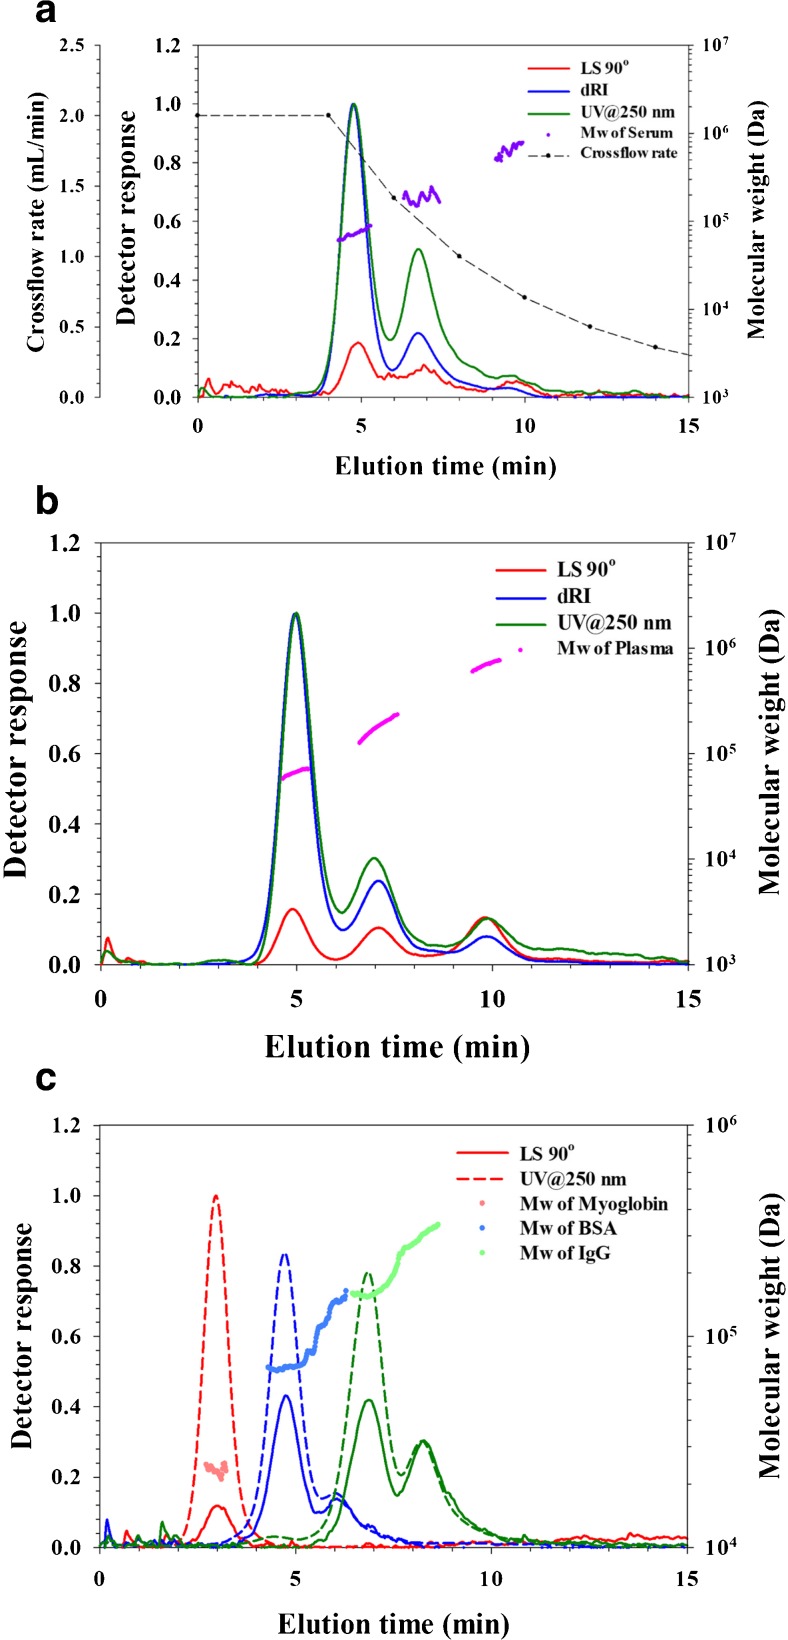
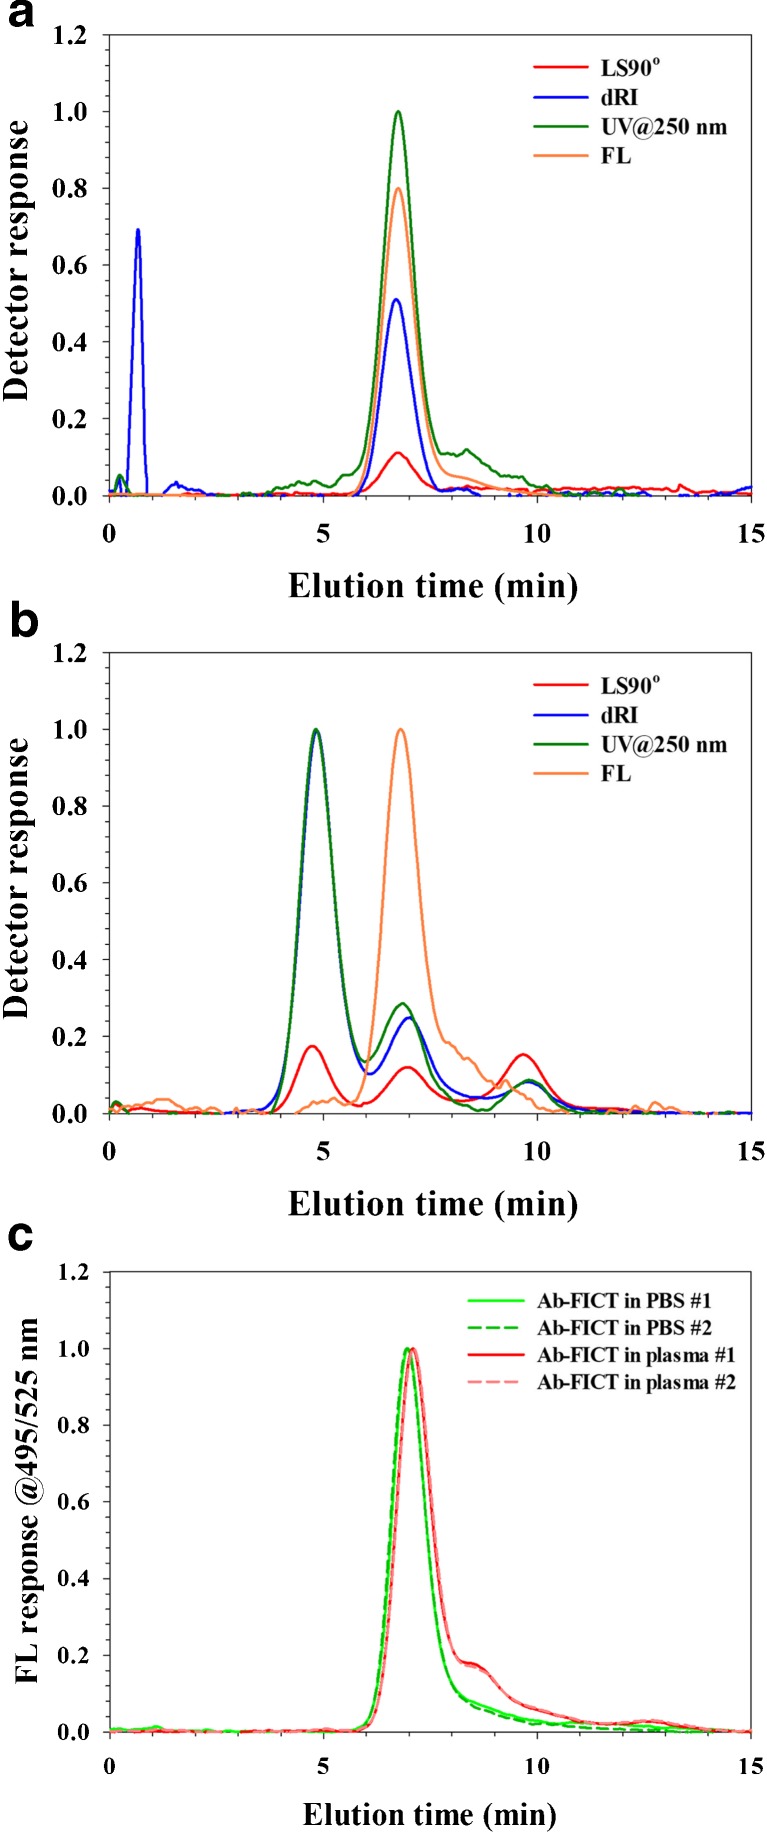
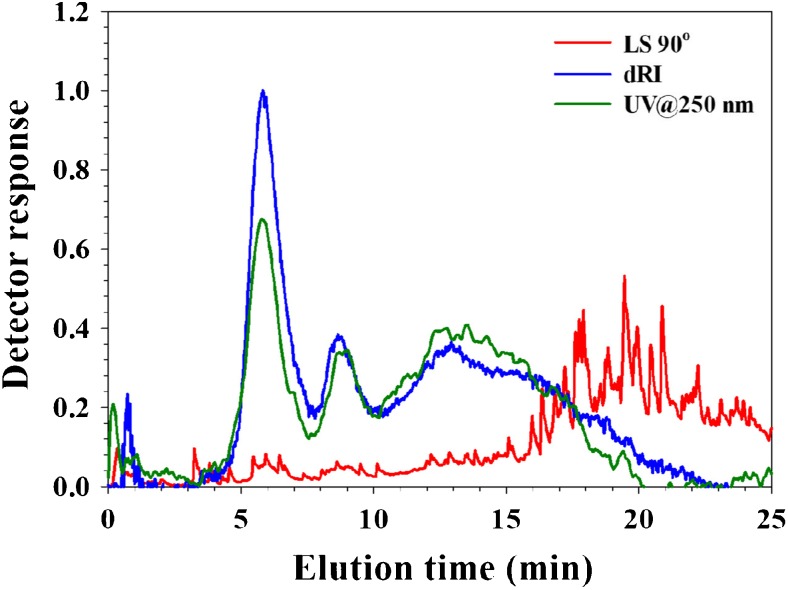
The analysis of aggregates of therapeutic proteins is crucial in order to ensure efficacy and patient safety. Typically, the analysis is performed in the finished formulation to ensure that aggregates are not present. An important question is, however, what happens to therapeutic proteins, with regard to oligomerization and aggregation, after they have been administrated (i.e., in the blood). In this paper, the separation of whole blood, plasma, and serum is shown using asymmetric flow field-flow fractionation (AF4) with a minimum of sample pre-treatment. Furthermore, the analysis and size characterization of a fluorescent antibody in blood plasma using AF4 are demonstrated. The results show the suitability and strength of AF4 for blood analysis and open new important routes for the analysis and characterization of therapeutic proteins in the blood.

Keywords: Antibodies; Asymmetric flow field-flow fractionation (AF4); Fluorescence labelling; Plasma; Serum; Whole blood.


Conflict of interest statement

The authors declare that they have no conflict of interest.

Figures

Fig. 1
Fig. 1
AF4-UV-MALS-dRI fractograms and molecular weight. UV trace at 250 nm (green), dRI trace (blue), and LS at 90° trace (red). a Analysis of blood serum. Injection volume was 10 μL of a 100× diluted serum sample, i.e., corresponding to 0.1 μL serum. b Analysis of plasma. Injection volume was 10 μL of a 100× diluted plasma sample, i.e., corresponding to 0.1 μL plasma. c Analysis of 17 kDa myoglobin (red trace), 67 kDa bovine serum albumin (blue trace), and ~ 150 kDa immunoglobulin G (green trace). The BSA and IgG samples contain dimers
Fig. 2
Fig. 2
AF4-UV-MALS-dRI-FL fractograms. Detected by UV at 250 nm (green trace), MALS (red trace), FL at 495/525 nm (orange trace), and dRI (blue trace). a Analysis of fluorescently labeled antibody in PBS. The injection volume was 10 μL of a 100 μg/mL solution (mass load = 1 μg). b Analysis of fluorescently labeled antibody in blood plasma. The plasma was spiked for a concentration of 10 μg of fluorescently labeled antibody/mL plasma. The spiked plasma was then diluted 100× with PBS carrier before analysis (sample volume was 10 μL, corresponding to a mass load of 1 ng of fluorescently labeled antibody on channel). c Analysis of fluorescently labeled antibody in PBS (green trace) and in blood plasma (red trace). The plasma was spiked for a concentration of 100 μg of fluorescently labeled antibody/mL plasma. The spiked plasma was then diluted 100× with PBS carrier before analysis (sample volume was 10 μL, corresponding to a mass load of 10 ng of fluorescently labeled antibody on channel)
Fig. 3
Fig. 3
Analysis of whole blood by AF4-UV-MALS-dRI. UV trace at 250 nm (green), dRI trace (blue), and LS at 90° trace (red). Injection volume was 10 μL of a 100× diluted blood sample, i.e., corresponding to 0.1 μL whole blood

References

    1. Frokjaer S, Otzen DE. Protein drug stability: a formulation challenge. Nat Rev Drug Disc. 2005;4(4):298–306. doi: 10.1038/nrd1695. - DOI - PubMed
    1. Den Engelsman J, Garidel P, Smulders R, Koll H, Smith B, Bassarab S, Seidl A, Hainzl O, Jiskoot W. Strategies for the assessment of protein aggregates in pharmaceutical biotech product development. Pharm Res. 2011;28(4):920–933. doi: 10.1007/s11095-010-0297-1. - DOI - PMC - PubMed
    1. Manning RR, Holcomb RE, Wilson GA, Henry CS, Manning MC. Review of orthogonal methods to SEC for quantitation and characterization of protein aggregates. Biopharm Int. 2014;27(12):32.
    1. Carpenter JF, Randolph TW, Jiskoot W, Crommelin DJA, Middaugh CR, Winter G. Potential inaccurate quantitation and sizing of protein aggregates by size exclusion chromatography: essential need to use orthogonal methods to assure the quality of therapeutic protein products. J Pharm Sci. 2010;99(5):2200–2208. doi: 10.1002/jps.21989. - DOI - PubMed
    1. USFDA (2014) Guidance for industry immunogenicity assessment for therapeutic protein products.