. 2018 Jul;42(5):418-433.
doi: 10.1002/gepi.22131. Epub 2018 May 29.

Transcriptome-wide association studies accounting for colocalization using Egger regression

Affiliations

Transcriptome-wide association studies accounting for colocalization using Egger regression

Richard Barfield et al. Genet Epidemiol. 2018 Jul.

Abstract

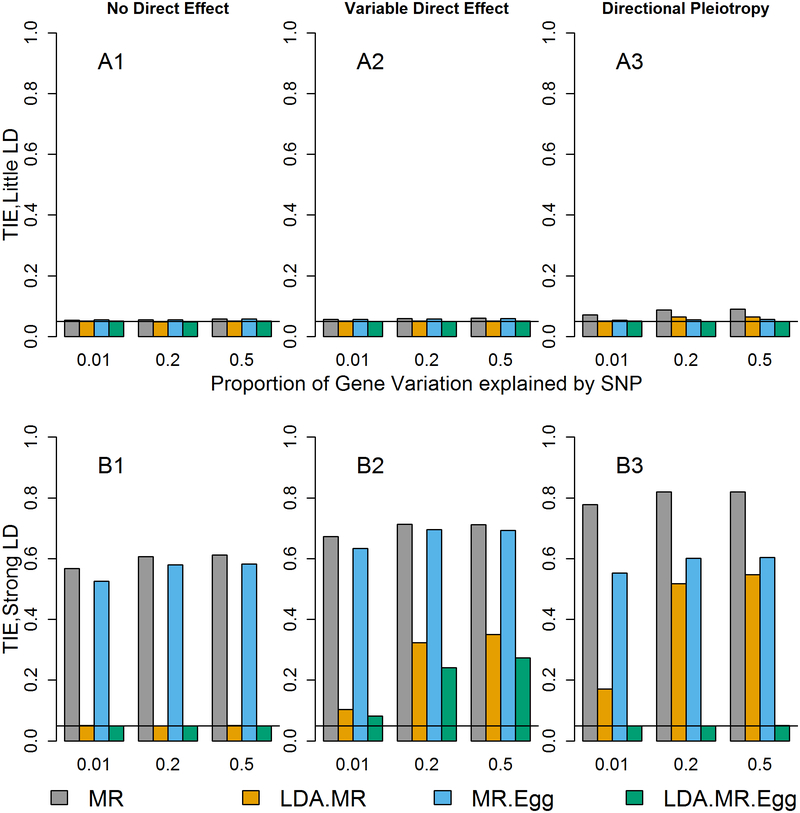
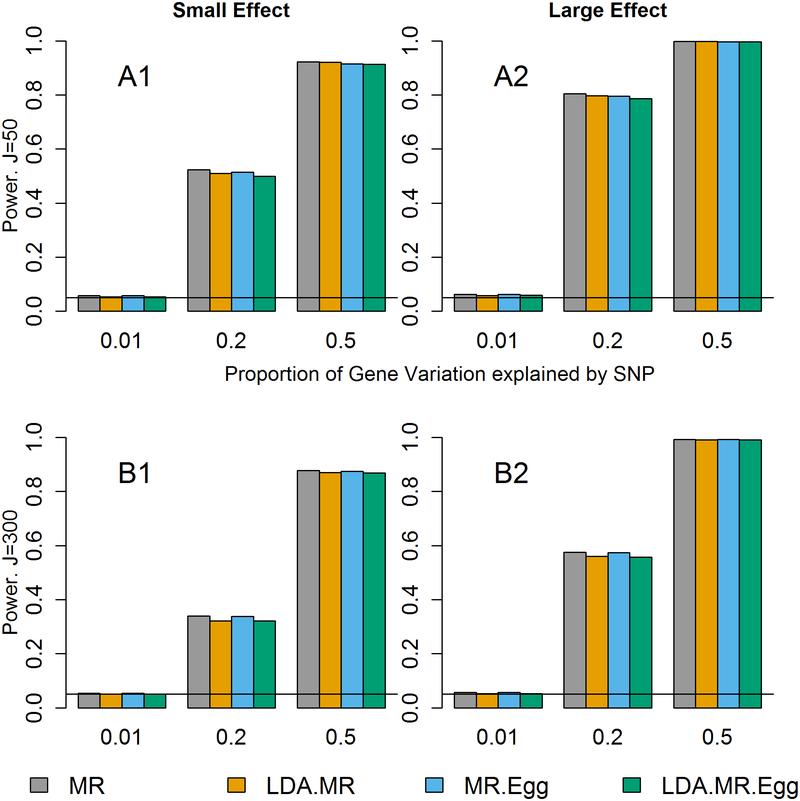
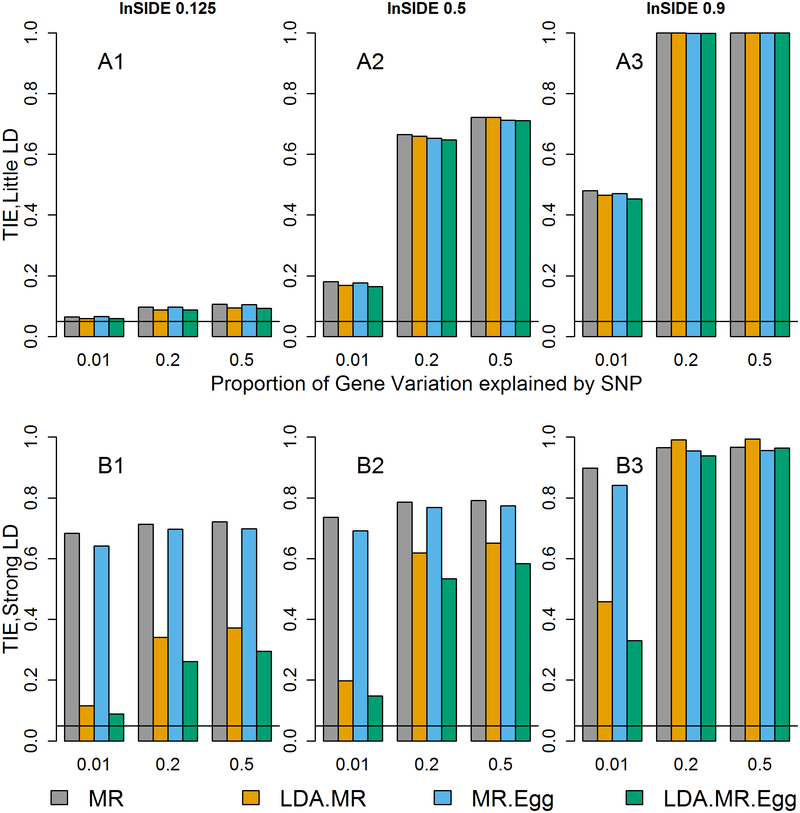
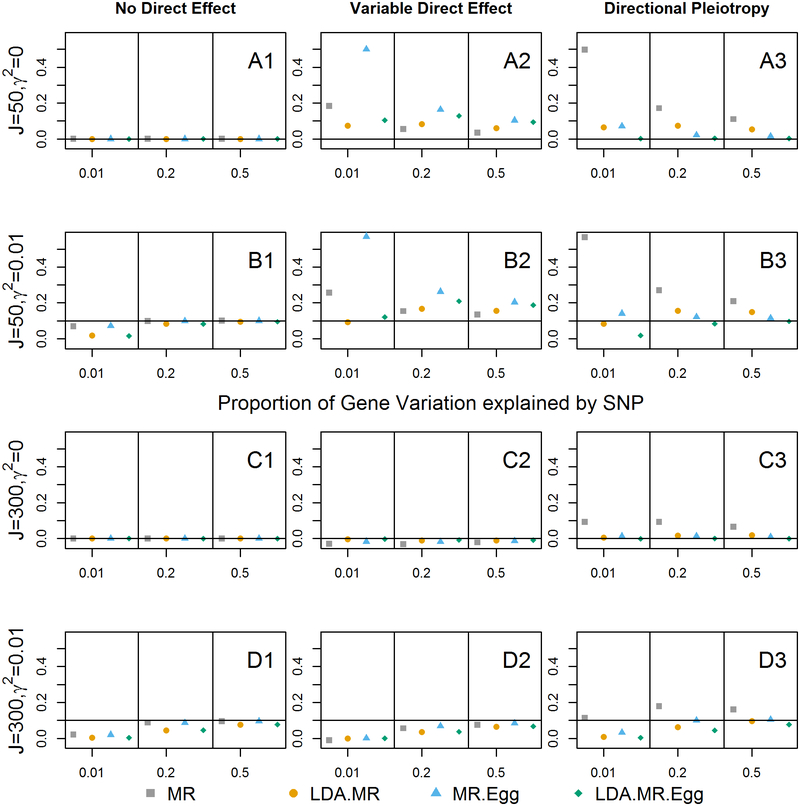
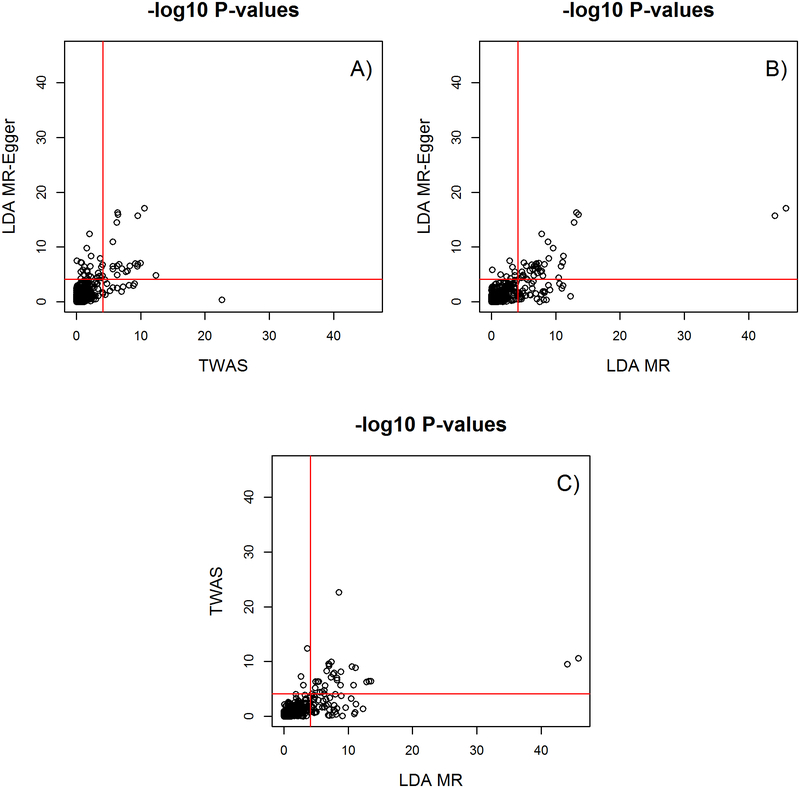
Integrating genome-wide association (GWAS) and expression quantitative trait locus (eQTL) data into transcriptome-wide association studies (TWAS) based on predicted expression can boost power to detect novel disease loci or pinpoint the susceptibility gene at a known disease locus. However, it is often the case that multiple eQTL genes colocalize at disease loci, making the identification of the true susceptibility gene challenging, due to confounding through linkage disequilibrium (LD). To distinguish between true susceptibility genes (where the genetic effect on phenotype is mediated through expression) and colocalization due to LD, we examine an extension of the Mendelian randomization (MR) egger regression method that allows for LD while only requiring summary association data for both GWAS and eQTL. We derive the standard TWAS approach in the context of MR and show in simulations that the standard TWAS does not control type I error for causal gene identification when eQTLs have pleiotropic or LD-confounded effects on disease. In contrast, LD-aware MR-Egger (LDA MR-Egger) regression can control type I error in this case while attaining similar power as other methods in situations where these provide valid tests. However, when the direct effects of genetic variants on traits are correlated with the eQTL associations, all of the methods we examined including LDA MR-Egger regression can have inflated type I error. We illustrate these methods by integrating gene expression within a recent large-scale breast cancer GWAS to provide guidance on susceptibility gene identification.

Keywords: Mendelian randomization; gene Expression; genome-wide association study; transciptome-wide association study.


Figures

Figure 1:
Figure 1:. Type I error when J=50.
Each bar represents results over 5×10⁴ simulations. Evaluated at α = 0.05. First panel represent when low LD (plots with A). Second panel represents when strong LD (plots with B). From left to right correspond to: no direct effect, variable direct effects with mean 0 across SNPs, and direct effects with mean >0 across SNPs and small variability (directional pleiotropy). When there is a direct effect, the SNPs explain 1% of the variation in the outcome (hGY2=.01).
Figure 2:
Figure 2:. Power when little to no LD and J=50, 300.
Power results when there is little to no LD and no direct effect. Each bar represents results over 5×10⁴ simulations. Evaluated at α = 0.05. First row represents J=50 and second row when J=300. From left to right: when γ2 = 0.005 and γ2 = 0.01.
Figure 3:
Figure 3:. Type I error when J=50, InSIDE condition violated, and there is directional pleiotropy.
Each bar represents results over 5×10⁴ simulations. Evaluated at α = 0.05. First panel represent when low LD (plots with A). Second panel represents when strong LD (plots with B). From left to right correspond to: correlation between θj and βE,j is 0.125, 0.5, or 0.9.
Figure 4:
Figure 4:. Bias when strong LD for J=50, 300.
Bias plots for when there is strong LD in the SNP set. First row corresponds to J=50, γ = 0 (plots with A). Second panel (plots with B) when J = 50 and γ2 = 0.01. Third panel (plots with C) when J = 300 and γ = 0. Final panel (plots with D) J = 300 and γ2 = 0.01. From left to right: no direct effect, variable direct effects with mean 0 across SNPs, and directional pleiotropy. When there is a direct effect, the SNPs explain 1% of the variation in the outcome (hGY2=.01).
Figure 5:
Figure 5:. Comparing −log 10 p-values.
Shows for 683 genes between LDA MR Egger and TWAS (A), LDA MR Egger and LDA MR (B), and LDA MR and TWAS (C). Red line is the Bonferroni cutoff of -log10(.05/683).

References

    1. Barbeira A, Shah KP, Torres JM, Wheeler HE, Torstenson ES, Edwards T, Garcia T, Bell GI, Nicolae D, Cox NJ and et al. 2016. MetaXcan: Summary Statistics Based Gene-Level Association Method Infers Accurate PrediXcan Results. bioRxiv.
    1. Bowden J, Davey Smith G, Burgess S. 2015. Mendelian randomization with invalid instruments: effect estimation and bias detection through Egger regression. Int J Epidemiol 44(2):512–25. - PMC - PubMed
    1. Burgess S, Dudbridge F, Thompson SG. 2016. Combining information on multiple instrumental variables in Mendelian randomization: comparison of allele score and summarized data methods. Stat Med 35(11):1880–906. - PMC - PubMed
    1. Burgess S, Thompson SG. 2017. Interpreting findings from Mendelian randomization using the MR-Egger method. Eur J Epidemiol 32(5):377–389. - PMC - PubMed
    1. Consortium GT. 2013. The Genotype-Tissue Expression (GTEx) project. Nat Genet 45(6):580–5. - PMC - PubMed

Publication types

LinkOut - more resources