. 2018 May 29:7:e35619.
doi: 10.7554/eLife.35619.

mTORC1 and mTORC2 differentially promote natural killer cell development

Affiliations

mTORC1 and mTORC2 differentially promote natural killer cell development

Chao Yang et al. Elife. .

Abstract

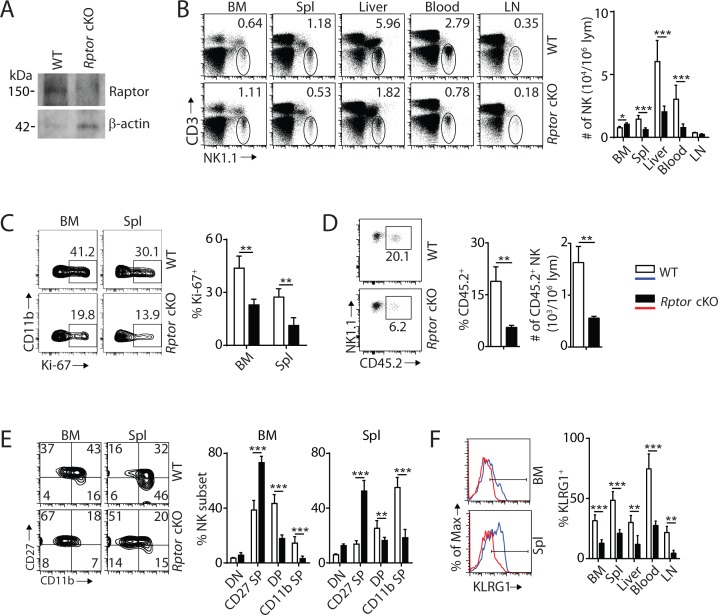
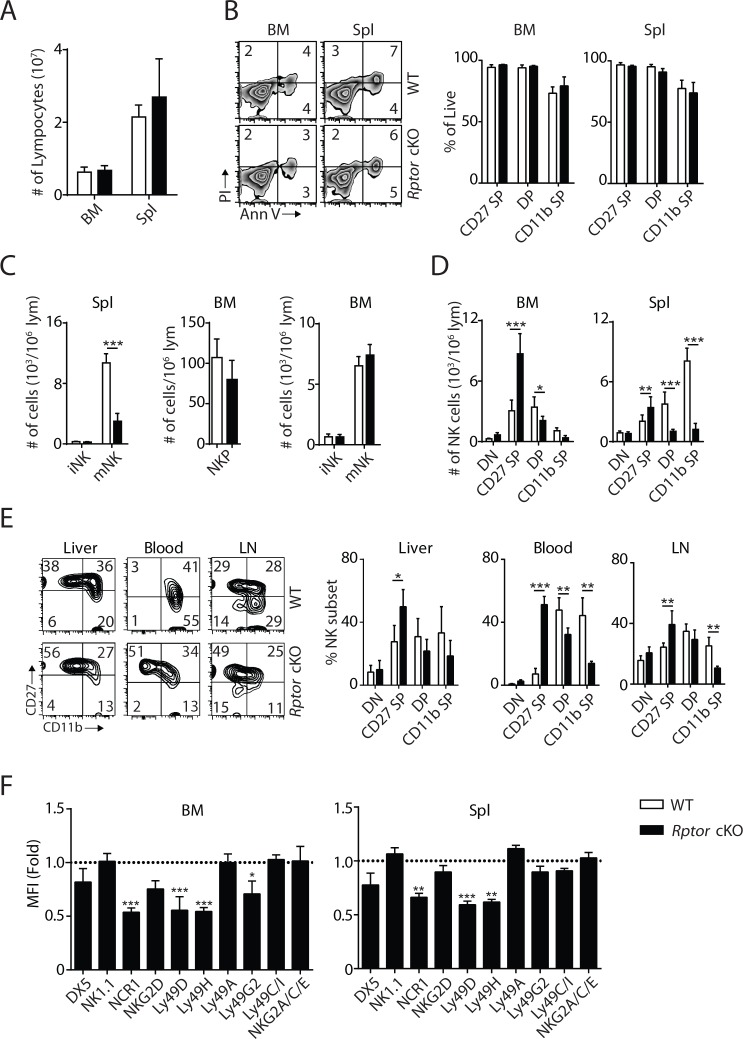
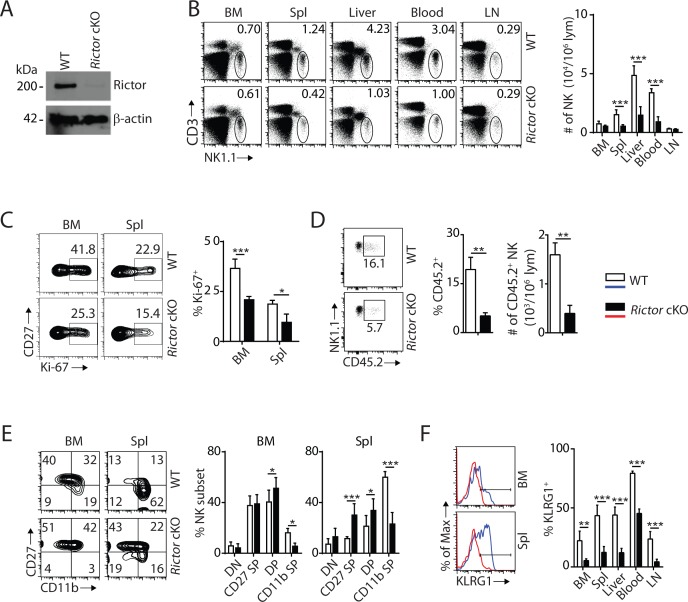
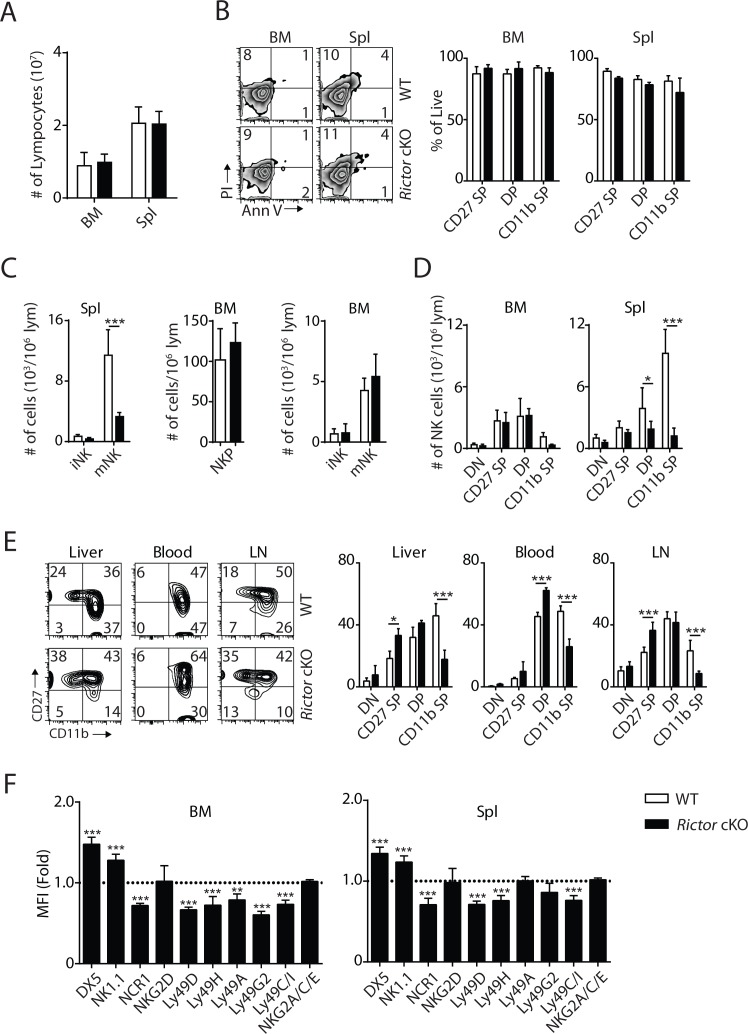
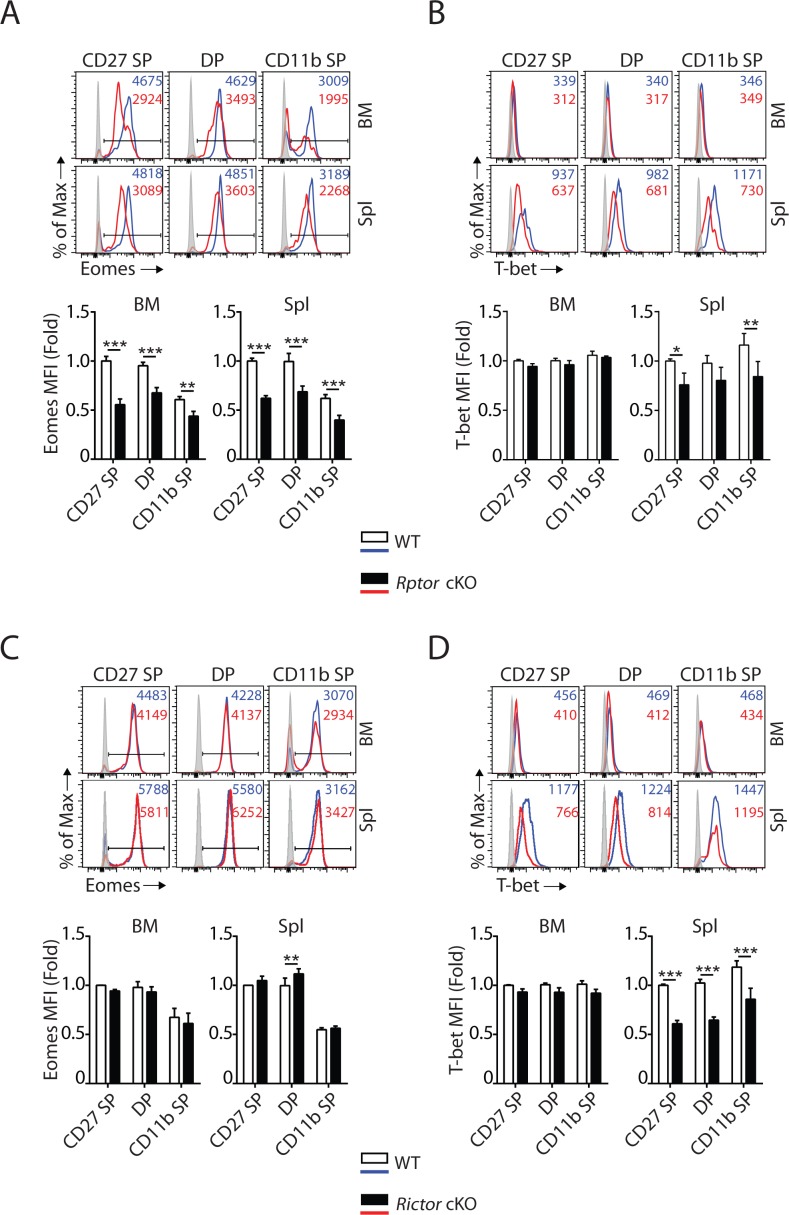
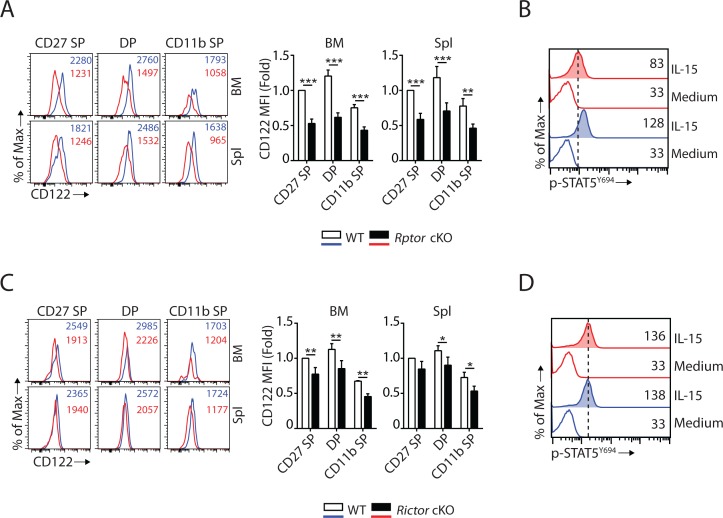
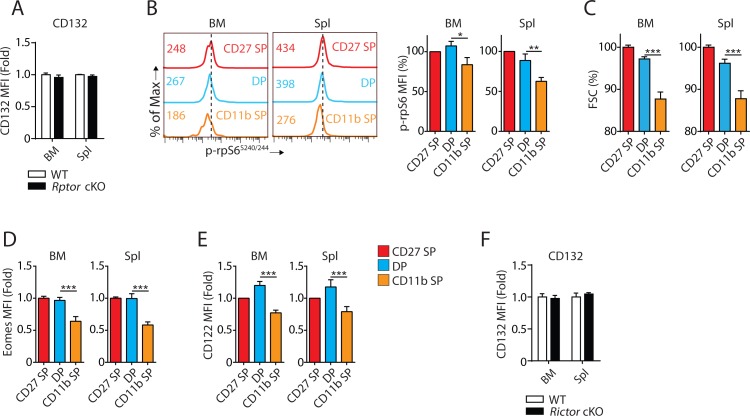
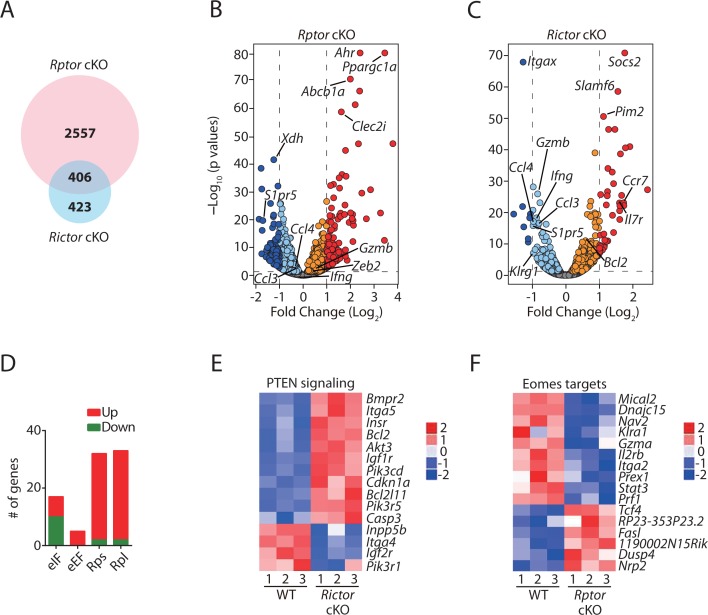
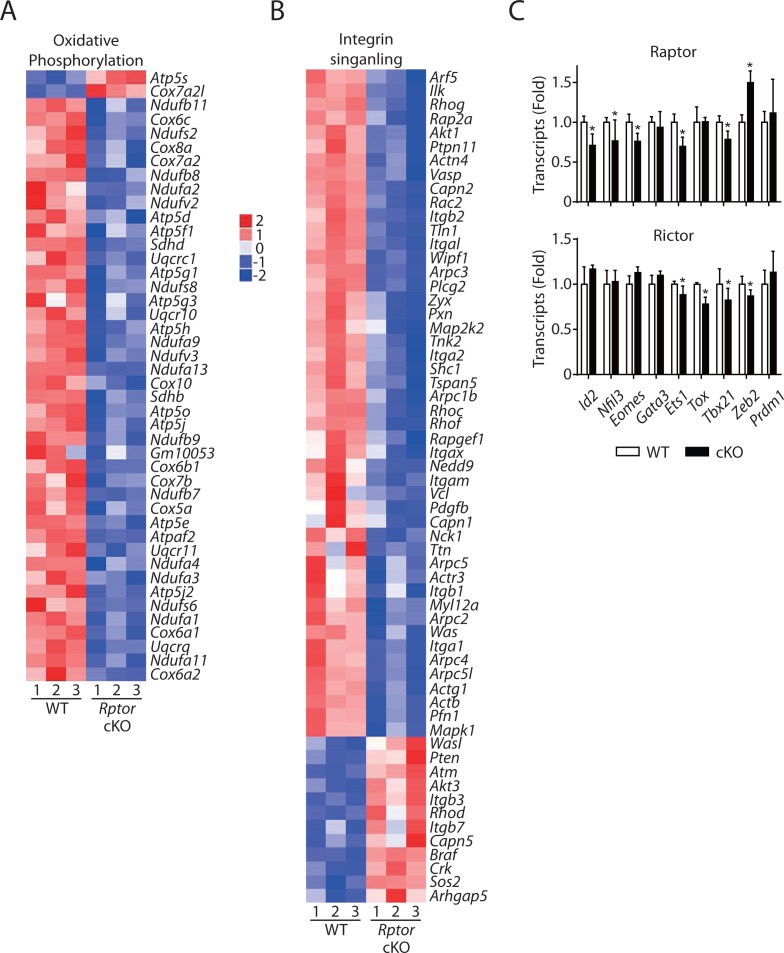
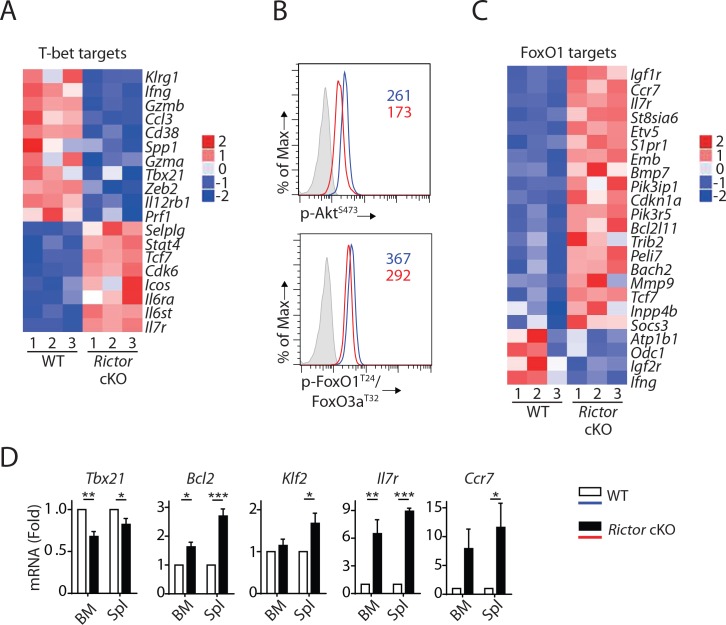
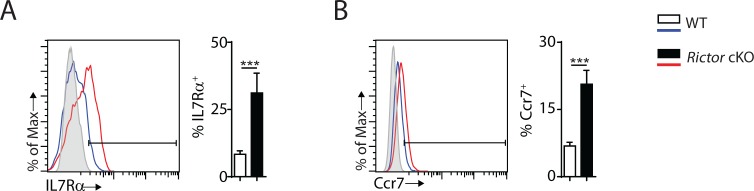
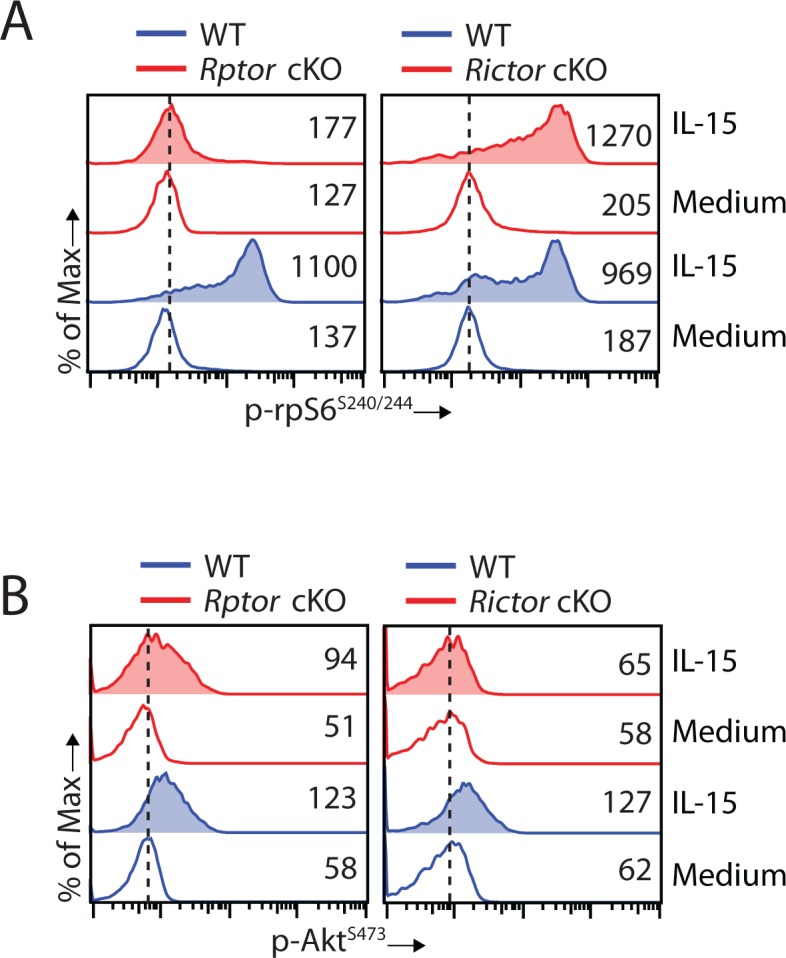
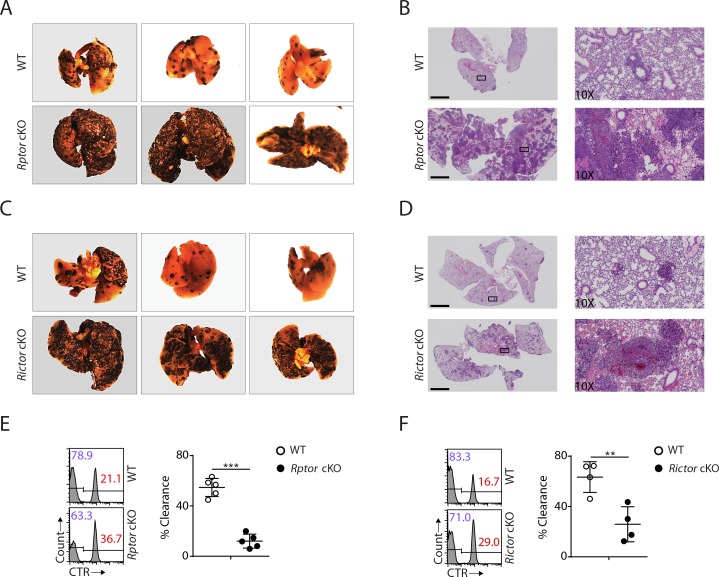
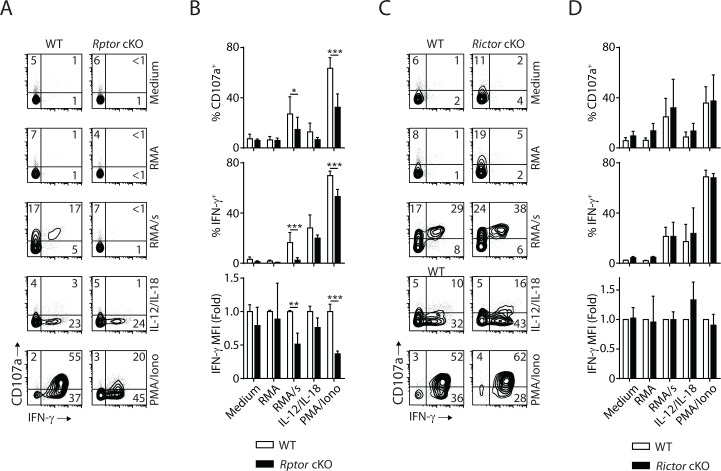
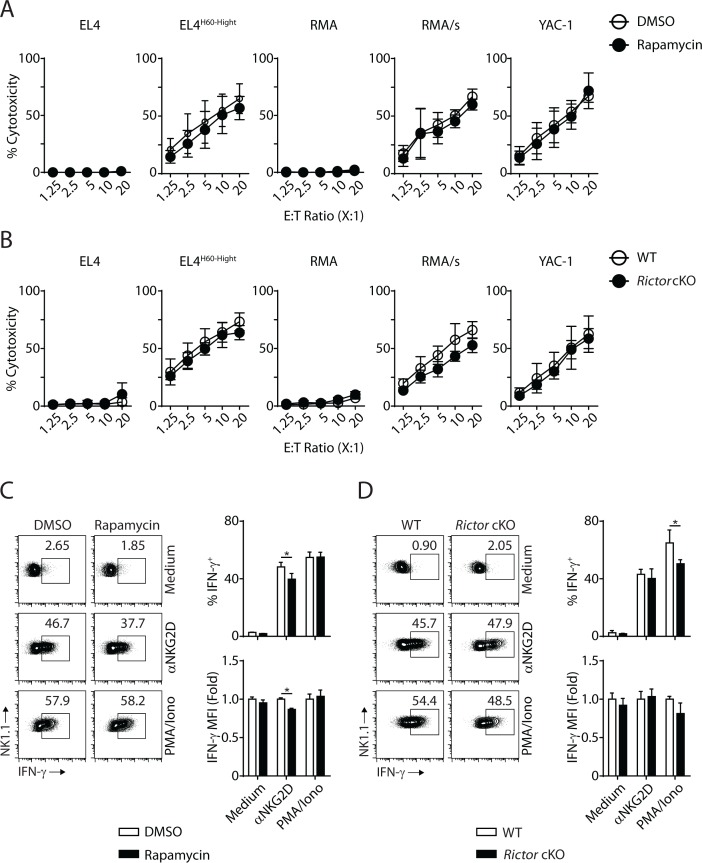
Natural killer (NK) cells are innate lymphoid cells that are essential for innate and adaptive immunity. Mechanistic target of rapamycin (mTOR) is critical for NK cell development; however, the independent roles of mTORC1 or mTORC2 in regulating this process remain unknown. Ncr1iCre-mediated deletion of Rptor or Rictor in mice results in altered homeostatic NK cellularity and impaired development at distinct stages. The transition from the CD27+CD11b- to the CD27+CD11b+ stage is impaired in Rptor cKO mice, while, the terminal maturation from the CD27+CD11b+ to the CD27-CD11b+ stage is compromised in Rictor cKO mice. Mechanistically, Raptor-deficiency renders substantial alteration of the gene expression profile including transcription factors governing early NK cell development. Comparatively, loss of Rictor causes more restricted transcriptome changes. The reduced expression of T-bet correlates with the terminal maturation defects and results from impaired mTORC2-AktS473-FoxO1 signaling. Collectively, our results reveal the divergent roles of mTORC1 and mTORC2 in NK cell development.

Keywords: NK cells; Raptor; Rictor; immunology; inflammation; mouse.


Conflict of interest statement

CY, ST, AL, MF, MT, SM No competing interests declared

Figures

Figure 1.
Figure 1.. mTORC1 is essential for NK cell homeostasis and maturation.
(A) Raptor expression in freshly-isolated NK cells from WT and Rptor cKO mice was evaluated via western blot. (B) CD3, NK1.1 staining of cells from various organs (left) and quantification of NK cells in each organ of WT and Rptor cKO mice (right). n = 4–8 pooled from two to four independent experiments. (C) Ki-67 staining was used to assess steady-state proliferation of NK cells gated on CD11b population (left), and percentage of Ki-67+ cells (right). n = 3 pooled from three independent experiments. (D) Percentage of NK cells that are in the sinusoidal compartment of BM was demonstrated by CD45.2 staining (left) and quantified as both percentage and number of CD45.2+ NK cells per million lymphocytes (right). n = 3 pooled from three independent experiments. (E) CD27 and the CD11b expression on gated NK cells from BM and spleen of WT and Rptor cKO mice were assessed by flow cytometry (left), and percentages of each NK subsets were quantified (right). n = 7 pooled from three independent experiments. (F) The KLRG1 expression on gated NK cells from BM and spleen of WT and Rptor cKO mice (left) and percentage of KLRG1+ cells within NK populations from different organs (right). n = 4 pooled from two independent experiments. All bar graphs present the mean ± SD. Statistical significance was calculated using two-way ANOVA (B, C, E, F) or unpaired Student t-test (D). *p<0.05; **p<0.01; ***p<0.001.
Figure 1—figure supplement 1.
Figure 1—figure supplement 1.. mTORC1 is required for NK cell maturation.
(A) BM and spleen lymphocytes count in WT and Rptor cKO mice. n = 4 pooled from two independent experiments. (B) The viability of freshly-isolated NK cells from BM and spleen of WT and Rptor cKO mice was evaluated by Annexin V (Ann V) and Propidium iodide (PI) staining (left). Percentage of live cells (Ann VPI) in each population gated by CD27 and CD11b was quantified (right). n = 3 pooled from three independent experiments. (C) Number of iNKs (CD3CD122+NK1.1+DX5), mNKs (CD3CD122+NK1.1+DX5+) in the spleen and NKPs (CD3Flt3CD27+2B4+CD127+CD122+ NK1.1), iNKs, mNKs in the BM from Rptor cKO mice were quantified using flow cytometry. n = 3–5 pooled from two or three independent experiments. (D) Number of each NK cell population defined by CD27 and CD11b expression in BM and spleen was quantified as the number of cells per million lymphocytes. n = 7 pooled from four independent experiments. (E) CD27 and the CD11b expression on NK cells from liver, blood and lymph node (LN) were assessed by flow cytometry (left). Percentage of each NK subsets was quantified (right). n = 4 pooled from two to four independent experiments. (F) Expression of various maturation markers on NK cells was shown as fold change in MFI normalized to WT. n = 4 pooled from two independent experiments. All bar graphs present the mean ± SD. Statistical significance was calculated using two-way ANOVA. *p<0.05; **p<0.01; ***p<0.001.
Figure 2.
Figure 2.. mTORC2 is pivotal for NK cell homeostasis and terminal maturation.
(A) Rictor expression in IL-2-cultured NK cells isolated from WT and Rictor cKO mice was evaluated via western blot. A representative of three independent experiments. (B) CD3, NK1.1 staining of cells from various organs (left) and quantification of NK cells in each organ of WT and Rictor cKO mice (right). n = 4–7 pooled from two to four independent experiments. (C) Ki-67 staining was used to assess steady-state proliferation of NK cells gated on CD27+ population (left), and percentage of Ki-67+ cells (right). n = 3 pooled from three independent experiments. (D) Percentage of NK cells that are in the sinusoidal compartment of BM was demonstrated by CD45.2 staining (left) and quantified as both percentage and number of CD45.2+ NK cells per million lymphocytes (right). n = 3 pooled from three independent experiments. (E) CD27 and the CD11b expression on gated NK cells from BM and spleen of WT and Rictor cKO mice were assessed by flow cytometry (left), and percentages of each NK subsets were quantified (right). n = 6 pooled from four independent experiments. (F) The KLRG1 expression on gated NK cells from BM and spleen of WT and Rictor cKO mice (left) and percentage of KLRG1+ cells within NK populations from different organs (right). n = 3–4 pooled from two or three independent experiments. All bar graphs present the mean ± SD. Statistical significance was calculated using two-way ANOVA (B, C, E, F) or unpaired Student t-test (D). *p<0.05; **p<0.01; ***p<0.001.
Figure 2—figure supplement 1.
Figure 2—figure supplement 1.. Terminal NK cell maturation was impaired in Rictor cKO mice.
(A) BM and spleen lymphocytes count in WT and Rictor cKO mice. n = 4 pooled from two independent experiments. (B) The viability of freshly isolated NK cells from BM and spleen of WT and Rictor cKO mice was evaluated by Annexin V (Ann V) and Propidium iodide (PI) staining (left). Percentage of live cells (Ann VPI) in each population gated by CD27 and CD11b was quantified (right). n = 3 pooled from three independent experiments. (C) Number of iNKs (CD3CD122+NK1.1+DX5), mNKs (CD3CD122+NK1.1+DX5+) in the spleen and NKPs (CD3Flt3CD27+2B4+CD127+CD122+NK1.1), iNKs, mNKs in the BM from Rictor cKO mice were quantified using flow cytometry. n = 3–4 pooled from two or four independent experiments. (D) Number of each NK cell population defined by CD27 and CD11b expression in BM and spleen of WT and Rictor cKO mice was quantified as the number of cells per million lymphocytes. n = 6 pooled from four independent experiments. (E) CD27 and the CD11b expression on NK cells from liver, blood and lymph node (LN) of WT and Rictor cKO mice were assessed by flow cytometry (left). Percentage of each NK subsets was quantified (right). n = 3–4 pooled from two or three independent experiments. (F) Expression of various maturation markers on NK cells was shown as fold change in MFI normalized to WT. n = 4 pooled from two independent experiments. All bar graphs present the mean ± SD. Statistical significance was calculated using two-way ANOVA. *p<0.05; **p<0.01; ***p<0.001.
Figure 3.
Figure 3.. mTORC1 and mTORC2 differentially regulate the expression of Eomes and T-bet.
(A–D) Histogram of Eomes (A, C) and T-bet (B, D) expression on each NK cell population gated by CD27 and CD11b of Rptor (A, B) or Rictor (C, D) cKO mice and their corresponding WT control. The histogram in grey presents the unstained control (top). Mean fluorescent intensity (MFI) is shown as fold change normalized to WT CD27 SP population (bottom). n = 4 pooled from three independent experiments. All bar graphs present the mean ± SD. Statistical significance was calculated using two-way ANOVA. *p<0.05; **p<0.01; ***p<0.001.
Figure 4.
Figure 4.. mTORC1 and mTORC2 differentially regulate the expression of CD122 and STAT5 activation.
(A) Histogram of CD122 expression on each NK population gated by CD27 and CD11b of WT and Rptor cKO mice (left). MFI of CD122 was normalized to WT CD27 SP population (right). n = 3 pooled from three independent experiments. (B) Splenocytes from WT or Rptor cKO mice were stimulated with either medium or 100 ng/mL IL-15 for 1 hr. Phosphorylation of STAT5Y694 was detected by phosphor-flow and shown as the representative histogram of three independent experiments. (C, D) CD122 expression (C) and IL-15-mediated STAT5 activation (D) in WT or Rictor-deficient NK cells. Same experimental procedures as A and B. All bar graphs present the mean ± SD. Statistical significance was calculated using two-way ANOVA. *p<0.05; **p<0.01; ***p<0.001.
Figure 4—figure supplement 1.
Figure 4—figure supplement 1.. mTORC1 activity, Eomes and CD122 expression were concurrently reduced during the transition from DP to CD11b SP stage.
(A) The MFI of CD132 in NK cells from BM and Spleen of Rptor cKO mice were normalized to WT control demonstrated as a bar graph. n = 4 pooled from two independent experiments. (B) Phosphorylation of rpS6S240/244 in different NK cell subsets defined by CD27 and CD11b from BM and spleen of WT mice was evaluated by flow cytometry (left). MFI of rpS6S240/244 was normalized to CD27 SP population and shown as percentages (right). n = 3 pooled from two independent experiments. (C) MFI of FSC of each NK subset was normalized to CD27 SP population from BM and spleen of WT mice and shown as percentages. n = 7 pooled from four independent experiments. (D) Eomes expression in three NK cell subsets is shown in fold change normalized to CD27 SP population. n = 8 pooled from four independent experiments. (E) CD122 expression in three NK cell subsets is shown in fold change normalized to CD27 SP population. n = 5 pooled from four independent experiments. (F) The MFI of CD132 in NK cells from BM and Spleen of Rictor cKO mice were normalized to WT control demonstrated as a bar graph. n = 3 pooled from three independent experiments. All bar graphs present the mean ± SD. Statistical significance was calculated using two-way ANOVA. *p<0.05; **p<0.01; ***p<0.001.
Figure 5.
Figure 5.. Transcriptome analyses of Raptor- or Rictor-deficient NK cells.
RNAseq was conducted using CD11b BM NK cells from littermate WT and Rptor cKO mice or CD27+ BM NK cells from littermate WT and Rictor cKO mice. (n = 3 per group). (A) Venn diagram demonstrating the number of genes that are differentially expressed (FDR < 0.05) in Raptor- or Rictor-deficient NK cells compared to their corresponding littermate WT control cells and the overlapping between those two genes list. (B, C) Volcano plot demonstrating the overall transcriptome alterations in Raptor- (B) or Rictor-deficient (C) NK cells compared to their corresponding littermate WT control cells. The orange/red dots represent genes that are significantly increased, while the aqua/dark blue dots represent genes that are significantly decreased in Raptor- and Rictor-deficient NK cells compared to the corresponding WT counterparts. We plotted all the genes with –Log10(p values) greater than 80 at the y-axis equal to 80. (D) A number of significantly up-regulated or down-regulated genes encoding proteins belonging to eIFs, eEFs, ribosome small (Rps) or large (Rpl) subunits family in Rptor cKO NK cells are quantified and presented in the bar graph. (E, F) Enrichment of PTEN signaling in Rictor cKO NK cells (E) and Eomes target genes in Rptor cKO NK cells (F) were demonstrated via the heatmap.
Figure 5—figure supplement 1.
Figure 5—figure supplement 1.. Altered oxidative phosphorylation and integrin signaling in Raptor-deficient NK cells indicated by RNA sequencing.
(A, B) IPA analyses revealed enrichment of oxidative phosphorylation (A) and integrin signaling (B) in Rptor cKO NK cells as demonstrated via the heatmap. (C) mRNA level of key transcription factors governing NK cell development in Raptor- (top) or Rictor- (bottom) deficient NK cells normalized to corresponding WT control.
Figure 6.
Figure 6.. mTORC2 is required for T-bet expression through regulation of FoxO1 during NK cell development.
(A) Enrichment of T-bet target genes in Rictor cKO NK cells as shown via the heatmap. (B) Histogram demonstrating phosphorylation of AktS473 (top) and FoxO1T24/FoxO3aT32 (bottom) in NK cells from BM of WT or Rictor cKO mice. The histogram in grey presents the isotype control. A representative of two or three independent experiments. (C) Enrichment of FoxO1 target genes in Rictor cKO NK cells as shown via the heatmap. (D) The mRNA level of Tbx21, Bcl2, Klf2, IL7r, and Ccr7 were evaluated by RT-qPCR with sorted fresh CD27+ NK cells from BM and spleen of WT or Rictor cKO mice. The data were shown as fold change normalized to WT. n = 3–5 pooled from three to five independent experiments. All bar graphs present the mean ± SD expect (D) which is shown as the mean ± SEM. Statistical significance was calculated using two-way ANOVA. *p<0.05; **p<0.01; ***p<0.001.
Figure 6—figure supplement 1.
Figure 6—figure supplement 1.. Cell surface expression of IL7Rα and Ccr7 are increased in Rictor cKO NK cells.
(A, B) Cell surface expression of IL7Rα (A) and Ccr7 (B) in CD27+ NK cells from the spleen of WT and Rictor cKO mice were detected by flow cytometry as shown in the histogram on the left. Percentage positive cells were quantified on the right. The grey histogram was the unstained control. A representative of two independent experiments with three mice in each. All bar graphs present the mean ± SD. Statistical significance was calculated using unpaired student t test. *p<0.05; **p<0.01; ***p<0.001.
Figure 7.
Figure 7.. Disruption of mTORC2 does not affect mTORC1 activation.
(A, B) Splenocytes from WT, Rptor cKO (left) or Rictor cKO mice (right) were stimulated with either medium or 100 ng/mL IL-15 for 1 hr. Phosphorylation of rpS6S240/244 (A) and AktS473 (B) were detected by phosphor-flow and shown as the representative histogram of three independent experiments.
Figure 8.
Figure 8.. Impaired antitumor activity in Rptor or Rictor cKO mice.
(A−D) 200,000 B16F10 tumor cells were intravenously injected into Rptor (A, B) or Rictor (C, D) cKO mice and their corresponding WT control mice. 14 days post-injection, the lungs were perfused with PBS and harvested for image acquisition (A, C) and HE staining (B, D; Scale bars represent 2.5 mm, and the right side are the 10X exploded view of select regions). The representative images were shown. n = 3–6 for each genotype from two independent experiments. (C, D) CTV-labeled splenocytes from WT C57BL/6 mice were mixed with CTV/CTR-double-labeled splenocytes from B2m−/− C57BL/6 mice at 1:1 ratio. Total 5 × 106 cells mixed cells were i.v. injected to Rptor (E) or Rictor (F) cKO mice and their corresponding WT control mice. 18 hr post-injection, the splenocytes from recipient mice were analyzed by flow cytometry. The percentages of WT and B2m−/− lymphocytes were analyzed as the representative histogram (left, gated on CTV+ lymphocytes). The percentage cytotoxicity was also calculated (right). n = 4–5, pooled from two independent experiments. All bar graphs present the mean ± SD. Statistical significance was calculated using unpaired Student t-test. *p<0.05; **p<0.01; ***p<0.001.
Figure 9.
Figure 9.. mTORC1 is critical for the effector function of NK cells.
In vivo Poly (I:C)-activated splenocytes were co-cultured with RMA/s target cells or stimulated with IL-12/IL-18 or PMA/Ionomycin for 6 hr. Medium and RMA target cells were used as the control groups. Degranulation (indicated by CD107a expression) and IFN-γ generation were assessed by flow cytometry. (A) Representative flow plots demonstrating the expression of CD107a and IFN-γ on gated NK cells from Rptor cKO and WT mice in different stimuli. (B) Percentage CD107a+, IFN-γ+NK cells from Rptor cKO and WT mice in different stimuli were quantified. The MFI of IFN-γ was normalized to WT in each condition. n ≥ 5, pooled from four independent experiments. (C, D) Expression of CD107a and IFN-γ in NK cells from Rictor cKO and WT mice (as shown in A and B). n = 3, pooled from three independent experiments. All bar graphs present the mean ± SD. Statistical significance was calculated using two-way ANOVA. *p<0.05; **p<0.01; ***p<0.001.
Figure 9—figure supplement 1.
Figure 9—figure supplement 1.. mTORC1 is essential for the IFN-γ generation downstream of NKG2D.
(A) Standard 51Cr-release assay using IL-2-cultured WT NK cells against different target cells at various effector to target ratios in the presence of DMSO or Rapamycin (100 nM). n = 6 pooled from three independent experiments. (B) Standard 51Cr-release assay using IL-2-cultured WT and Rictor-deficient NK cells against different target cells at various effector to target ratios. n = 3 pooled from two independent experiments. (C) IL-2-cultured WT NK cells were stimulated with plate-bound NKG2D, PMA/Ionomycin or left along with medium in the presence of DMSO or Rapamycin (100 nM) for 6 hr. IFN-γ production was assessed via intracellular flow. n = 3 representative of three independent experiments. (D) IL-2-cultured WT or Rictor cKO NK cells were stimulated with plate-bound NKG2D, PMA/Ionomycin or left along with medium for 6 hr. IFN-γ production was assessed via intracellular flow. n = 3 pooled from two independent experiments. All bar graphs present the mean ± SD. Statistical significance was calculated using two-way ANOVA. *p<0.05; **p<0.01; ***p<0.001. List of other files.

References

    1. Brunet A, Bonni A, Zigmond MJ, Lin MZ, Juo P, Hu LS, Anderson MJ, Arden KC, Blenis J, Greenberg ME. Akt promotes cell survival by phosphorylating and inhibiting a Forkhead transcription factor. Cell. 1999;96:857–868. doi: 10.1016/S0092-8674(00)80595-4. - DOI - PubMed
    1. Cahill CM, Tzivion G, Nasrin N, Ogg S, Dore J, Ruvkun G, Alexander-Bridges M. Phosphatidylinositol 3-kinase signaling inhibits DAF-16 DNA binding and function via 14-3-3-dependent and 14-3-3-independent pathways. Journal of Biological Chemistry. 2001;276:13402–13410. doi: 10.1074/jbc.M010042200. - DOI - PubMed
    1. Carotta S, Pang SH, Nutt SL, Belz GT. Identification of the earliest NK-cell precursor in the mouse BM. Blood. 2011;117:5449–5452. doi: 10.1182/blood-2010-11-318956. - DOI - PubMed
    1. Chiossone L, Chaix J, Fuseri N, Roth C, Vivier E, Walzer T. Maturation of mouse NK cells is a 4-stage developmental program. Blood. 2009;113:5488–5496. doi: 10.1182/blood-2008-10-187179. - DOI - PubMed
    1. Curti A, Ruggeri L, D'Addio A, Bontadini A, Dan E, Motta MR, Trabanelli S, Giudice V, Urbani E, Martinelli G, Paolini S, Fruet F, Isidori A, Parisi S, Bandini G, Baccarani M, Velardi A, Lemoli RM. Successful transfer of alloreactive haploidentical KIR ligand-mismatched natural killer cells after infusion in elderly high risk acute myeloid leukemia patients. Blood. 2011;118:3273–3279. doi: 10.1182/blood-2011-01-329508. - DOI - PubMed

Publication types

MeSH terms

Substances