. 2018 May 29:7:e37018.
doi: 10.7554/eLife.37018.

The ER membrane protein complex interacts cotranslationally to enable biogenesis of multipass membrane proteins

Affiliations

The ER membrane protein complex interacts cotranslationally to enable biogenesis of multipass membrane proteins

Matthew J Shurtleff et al. Elife. .

Abstract

The endoplasmic reticulum (ER) supports biosynthesis of proteins with diverse transmembrane domain (TMD) lengths and hydrophobicity. Features in transmembrane domains such as charged residues in ion channels are often functionally important, but could pose a challenge during cotranslational membrane insertion and folding. Our systematic proteomic approaches in both yeast and human cells revealed that the ER membrane protein complex (EMC) binds to and promotes the biogenesis of a range of multipass transmembrane proteins, with a particular enrichment for transporters. Proximity-specific ribosome profiling demonstrates that the EMC engages clients cotranslationally and immediately following clusters of TMDs enriched for charged residues. The EMC can remain associated after completion of translation, which both protects clients from premature degradation and allows recruitment of substrate-specific and general chaperones. Thus, the EMC broadly enables the biogenesis of multipass transmembrane proteins containing destabilizing features, thereby mitigating the trade-off between function and stability.

Keywords: EMC; cell biology; endoplasmic reticulum; human; ion channel; transmembrane; transporter.


Conflict of interest statement

MS, DI, JH, NS, EC, MJ, JW, KP, CJ, PS, SV, HH, JC, AB, JB, AF, GB, JW No competing interests declared

Figures
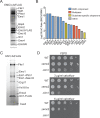
Figure 1.
Figure 1.. Identifying EMC interaction partners in S. cerevisiae.
(A) SDS-PAGE gel of Emc3-3xFLAG co-immunoprecipitated proteins. Proteins identified from excised bands are indicated. (B) SILAC ratios for proteins identified by mass spectrometry for Emc3-3xFLAG (heavy) and ORM1-3xFLAG (light) immunoprecipitations. The most Emc3-3xFLAG enriched proteins are shown. (C) SDS-PAGE gel of Ilm1-3xFLAG co-immunoprecipitated proteins. Proteins identified from excised bands are indicated. (D) 10-fold serial dilutions of log phase cultures of the indicated strains were plated on YEPD, YEPD containing calcofluor white at the indicated concentrations and incubated at 30°C for 24 hr.
Figure 2.
Figure 2.. The EMC interacts with multipass client proteins independent of co-chaperones.
(A) Schematic showing SILAC strategy for comparative analysis of EMC3-3xFLAG interactions in wildtype (WT - light) and ∆ilm1 (heavy) and ∆sop4 (heavy) cells. IP – immunoprecipitation, MS – mass spectrometry. (B) Log2 SILAC ratios for all proteins identified in EMC3-FLAG expressing strains (top - ∆sop4 and WT, bottom - ∆ilm1 and WT). Enriched multipass proteins and strongly depleted proteins are indicated. (C) Schematic showing a summary of physical interactions based on pull downs presented in Figures 1 and 2.
Figure 3.
Figure 3.. The EMC engages client proteins cotranslationally.
(A) Schematic for strategy to examine the role of the EMC (Emc5-BirA) in cotranslational interaction with clients using proximity-specific ribosome profiling. (B) Positional enrichment plots showing footprint reads across the full-length mRNAs of the genes indicated for Emc5-BirA, BirA-Ubc6-TA and Ssh1-BirA expressing strains. Transmembrane domains (TMDs) are indicated in gray. (C) As in (B), except comparing Emc5-BirA and Sec63-BirA expressing strains. (D) Mean enrichments of all TMD-containing genes and EMC clients (N = 51) following start of first TMD for two independent replicates of Emc5-BirA, Sec63-BirA, BirA-Ssh1 and BirA-Ubc6-TA.
Figure 3—figure supplement 1.
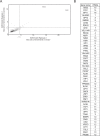
Figure 3—figure supplement 1.. Maximum 101-codon EMC/Ubc6 enrichment ratio windows from two independent Emc5-BirA replicates.
(A) Scatterplot of maximum 101-codon enrichment windows for each gene represented in two independent replicates of Emc5-BirA ribosome profiling. (B) List of genes above the 90th percentile in both replicates.
Figure 4.
Figure 4.. EMC clients are enriched for multipass membrane proteins with sub-optimal transmembrane helices.
(A) Histogram showing the proportion of proteins containing the given number of TMDs for all proteins that enter the secretory pathway (Uniprot annotations) and EMC clients. (B) Fraction of amino acids with the given properties in TMDs from EMC client proteins compared to all secretory proteins. Proportion of EMC TMD amino acids/all TMDs for each property is shown by a blue line. Blue boxes indicate 95% confidence ranges defined by 10,000 random sub-samplings of total TMDs with a pool size equal to EMC TMDs (N = 51). (C) Top non-redundant over-represented GOMF terms calculated from PANTHER (FDR < 0.05; redundant terms removed by REViGO). Inset: PANTHER protein classifications pie chart for all clients (N = 51).
Figure 5.
Figure 5.. The mammalian EMC stabilizes multipass transmembrane proteins.
(A) SILAC quantification of EMC components, comparing their expression level in cells with guide RNAs targeting EMC2 or EMC4 with those expressing non-targeting GAL4 guide RNA. PARK7 is shown as a control (Wiśniewski and Mann, 2016). (B) Full proteome comparison scatter plot of protein abundance change in cells expressing EMC2 guide RNA against abundance change in cells expressing EMC4 guide. Expression is relative to non-targeting GAL4 guide RNA. Proteins colored red are significantly upregulated in both EMC2 and EMC4 cells. Proteins colored green are significantly downregulated in both EMC2 and EMC4 cells (Log2 >0.5). EMC components are colored blue. (C) Comparison of translation change by ribosome profiling with proteome change. (D) Histogram showing the proportion of proteins containing the given number of TMDs for all proteins that enter the secretory pathway (as defined in Uniprot) and EMC clients. (E) Fraction of amino acids with the given properties in TMDs from EMC client proteins compared to all secretory proteins. Proportion of EMC TMD amino acids/all TMDs for each property is shown by a blue line. Blue boxes indicate 95% confidence ranges defined by 10,000 random sub-samplings of total TMDs with a pool size equal to EMC TMDs (N = 37). (F) Top non-redundant over-represented GOMF terms calculated from PANTHER (FDR < 0.05; redundant terms removed by REViGO). Inset: Protein classifications pie chart for EMC client proteins (N = 37).
Figure 5—figure supplement 1.
Figure 5—figure supplement 1.. 2D annotation enrichment based on the protein ratios and ribosome profiling ratios of EMC knockdown versus control knockdown cells.
Each point relates to a GO term whose corresponding protein or RNA expression values are significantly skewed in their distribution compared to the global distribution of the values for all proteins. The position on the plot relates to how the distribution is skewed, for example point one is concordantly upregulated at both the RNA and protein level in EMC2 knockdown cells.
Figure 5—figure supplement 2.
Figure 5—figure supplement 2.. Amino acid composition of transmembrane domains of EMC clients and background.
(A,B) Weblogos of amino acid frequencies at positions along transmembrane domains of EMC clients (A) and transmembrane domains in the total human proteome (B).
Figure 6.
Figure 6.. Model for the role of the EMC in multipass transmembrane protein biogenesis.
See text for details. Unstable transmembrane domains are shown in orange. Note, while the EMC is depicted here as cooperating with the translocon following insertion, our data do not exclude the possibility that the EMC acts as an insertase for some substrates.

References

    1. Algire MA, Maag D, Savio P, Acker MG, Tarun SZ, Sachs AB, Asano K, Nielsen KH, Olsen DS, Phan L, Hinnebusch AG, Lorsch JR. Development and characterization of a reconstituted yeast translation initiation system. RNA. 2002;8:382–397. doi: 10.1017/S1355838202029527. - DOI - PMC - PubMed
    1. Anghel SA, McGilvray PT, Hegde RS, Keenan RJ. Identification of Oxa1 homologs operating in the eukaryotic endoplasmic reticulum. Cell Reports. 2017;21:3708–3716. doi: 10.1016/j.celrep.2017.12.006. - DOI - PMC - PubMed
    1. Aviram N, Ast T, Costa EA, Arakel EC, Chuartzman SG, Jan CH, Haßdenteufel S, Dudek J, Jung M, Schorr S, Zimmermann R, Schwappach B, Weissman JS, Schuldiner M. The SND proteins constitute an alternative targeting route to the endoplasmic reticulum. Nature. 2016;540:134–138. doi: 10.1038/nature20169. - DOI - PMC - PubMed
    1. Bagchi P, Inoue T, Tsai B. EMC1-dependent stabilization drives membrane penetration of a partially destabilized non-enveloped virus. eLife. 2016;5:e21470. doi: 10.7554/eLife.21470. - DOI - PMC - PubMed
    1. Bircham PW, Maass DR, Roberts CA, Kiew PY, Low YS, Yegambaram M, Matthews J, Jack CA, Atkinson PH. Secretory pathway genes assessed by high-throughput microscopy and synthetic genetic array analysis. Molecular BioSystems. 2011;7:2589–2598. doi: 10.1039/c1mb05175j. - DOI - PubMed

Publication types