Ovarian cancer statistics, 2018
- PMID: 29809280
- PMCID: PMC6621554
- DOI: 10.3322/caac.21456
Ovarian cancer statistics, 2018
Abstract
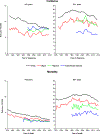
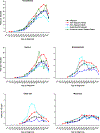
In 2018, there will be approximately 22,240 new cases of ovarian cancer diagnosed and 14,070 ovarian cancer deaths in the United States. Herein, the American Cancer Society provides an overview of ovarian cancer occurrence based on incidence data from nationwide population-based cancer registries and mortality data from the National Center for Health Statistics. The status of early detection strategies is also reviewed. In the United States, the overall ovarian cancer incidence rate declined from 1985 (16.6 per 100,000) to 2014 (11.8 per 100,000) by 29% and the mortality rate declined between 1976 (10.0 per 100,000) and 2015 (6.7 per 100,000) by 33%. Ovarian cancer encompasses a heterogenous group of malignancies that vary in etiology, molecular biology, and numerous other characteristics. Ninety percent of ovarian cancers are epithelial, the most common being serous carcinoma, for which incidence is highest in non-Hispanic whites (NHWs) (5.2 per 100,000) and lowest in non-Hispanic blacks (NHBs) and Asians/Pacific Islanders (APIs) (3.4 per 100,000). Notably, however, APIs have the highest incidence of endometrioid and clear cell carcinomas, which occur at younger ages and help explain comparable epithelial cancer incidence for APIs and NHWs younger than 55 years. Most serous carcinomas are diagnosed at stage III (51%) or IV (29%), for which the 5-year cause-specific survival for patients diagnosed during 2007 through 2013 was 42% and 26%, respectively. For all stages of epithelial cancer combined, 5-year survival is highest in APIs (57%) and lowest in NHBs (35%), who have the lowest survival for almost every stage of diagnosis across cancer subtypes. Moreover, survival has plateaued in NHBs for decades despite increasing in NHWs, from 40% for cases diagnosed during 1992 through 1994 to 47% during 2007 through 2013. Progress in reducing ovarian cancer incidence and mortality can be accelerated by reducing racial disparities and furthering knowledge of etiology and tumorigenesis to facilitate strategies for prevention and early detection. CA Cancer J Clin 2018;68:284-296. © 2018 American Cancer Society.
Keywords: epidemiology; epithelial ovarian cancers; health disparities; ovarian neoplasms.
© 2018 American Cancer Society.
Figures


References
-
- Siegel RL, Miller KD, Jemal A. Cancer statistics, 2018. CA Cancer J Clin 2018;68:7–30. - PubMed
-
- Howlader N, Noone AM, Krapcho M, Miller D, Bishop K, Kosary CL, Yu M, Ruhl J, Tatalovich Z, Mariotto A, Lewis DR, Chen HS, Feuer EJ, Cronin KA (eds). SEER Cancer Statistics Review, 1975–2014, National Cancer Institute; Bethesda, MD, https://seer.cancer.gov/csr/1975_2014/, based on November 2016 SEER data submission, posted to the SEER web site, April 2017.
-
- SEER*Stat Database: NAACCR Incidence Data - CiNA Analytic File, 1995–2014, for Expanded Races, Custom File With County, ACS Facts and Figures projection Project (which includes data from CDC’s National Program of Cancer Registries (NPCR), CCCR’s Provincial and Territorial Registries, and the NCI’s Surveillance, Epidemiology and End Results (SEER) Registries), certified by the North American Association of Central Cancer Registries (NAACCR) as meeting high-quality incidence data standards for the specified time periods, submitted December 2016.
-
- Copeland G, Lake A, Firth R, Wohler B, Wu XC, Schymura M, De P, Hofferkamp J, Sherman R, Kohler B (eds). Cancer in North America: 2010–2014. Volume One: Combined Cancer Incidence for the United States, Canada and North America Springfield, IL: North American Association of Central Cancer Registries, Inc. June 2017.
-
- Copeland G, Lake A, Firth R, Wohler B, Wu XC, Schymura M, De P, Hofferkamp J, Sherman R, Kohler B (eds). Cancer in North America: 2010–2014. Volume Two: Registry-specific Cancer Incidence in the United States and Canada Springfield, IL: North American Association of Central Cancer Registries, Inc. June 2017.
MeSH terms
Grants and funding
LinkOut - more resources
Full Text Sources
Other Literature Sources
Medical

