. 2018 May 29;16(5):e2004526.
doi: 10.1371/journal.pbio.2004526. eCollection 2018 May.

Zbtb7a is a transducer for the control of promoter accessibility by NF-kappa B and multiple other transcription factors

Affiliations

Zbtb7a is a transducer for the control of promoter accessibility by NF-kappa B and multiple other transcription factors

José Miguel Ramos Pittol et al. PLoS Biol. .

Abstract

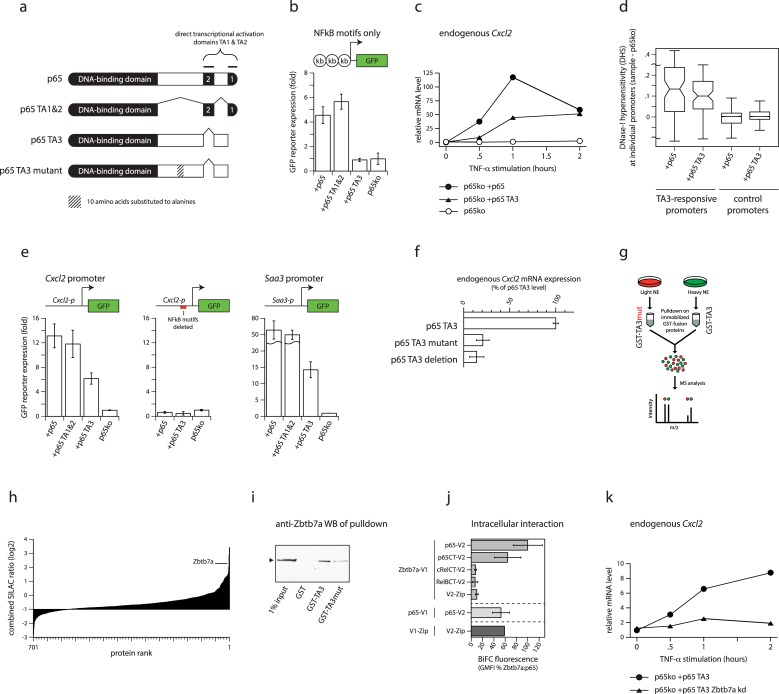
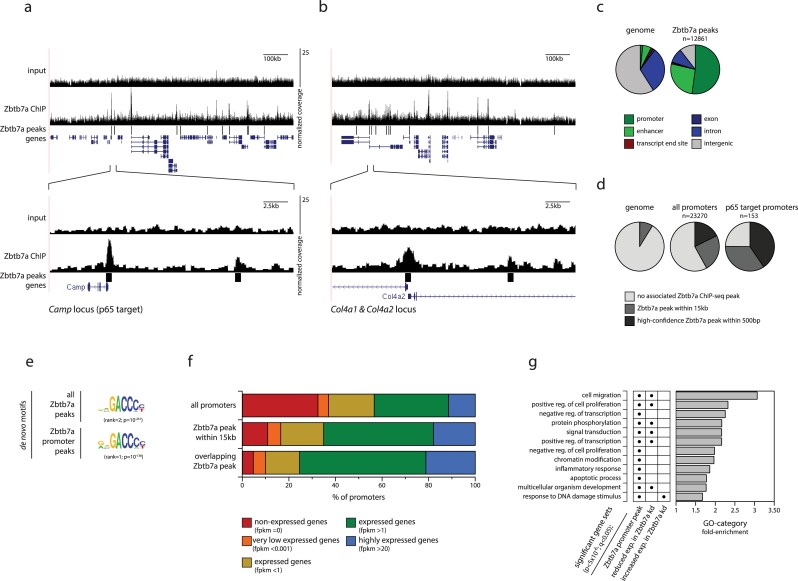
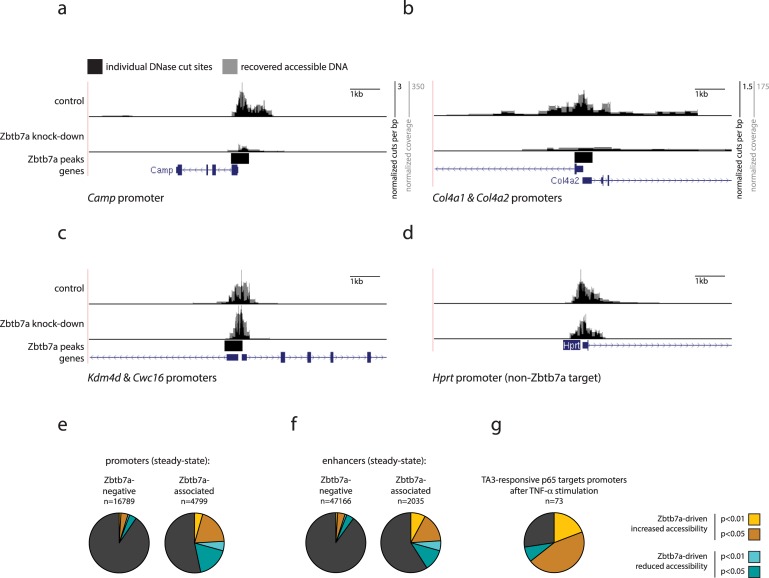
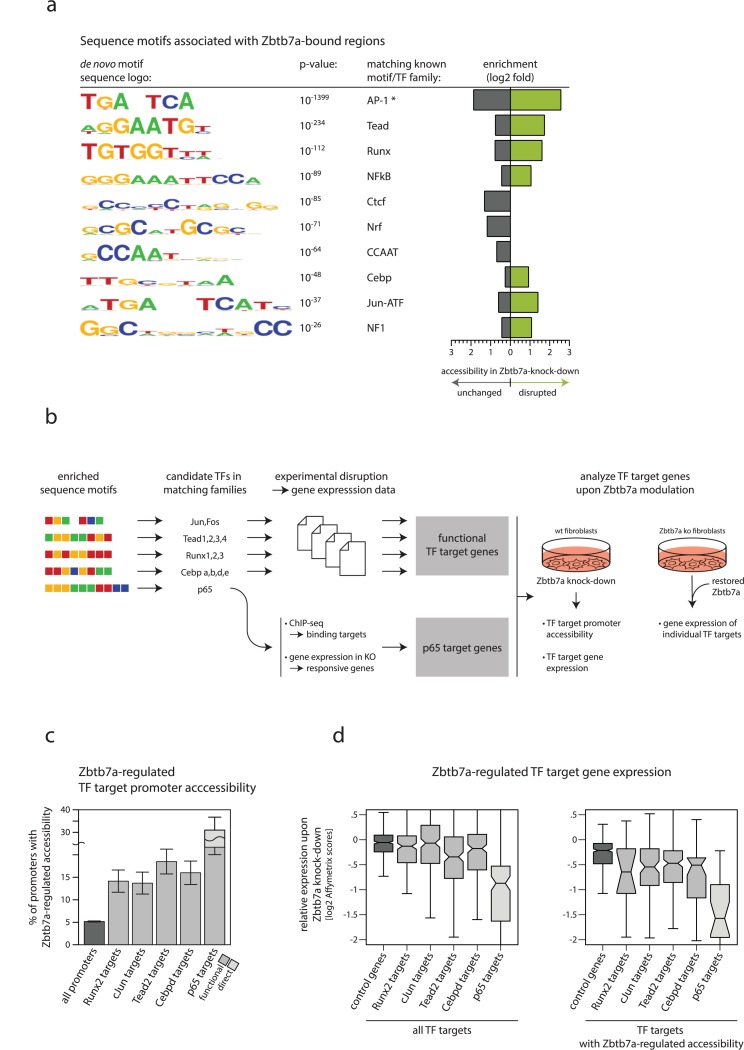
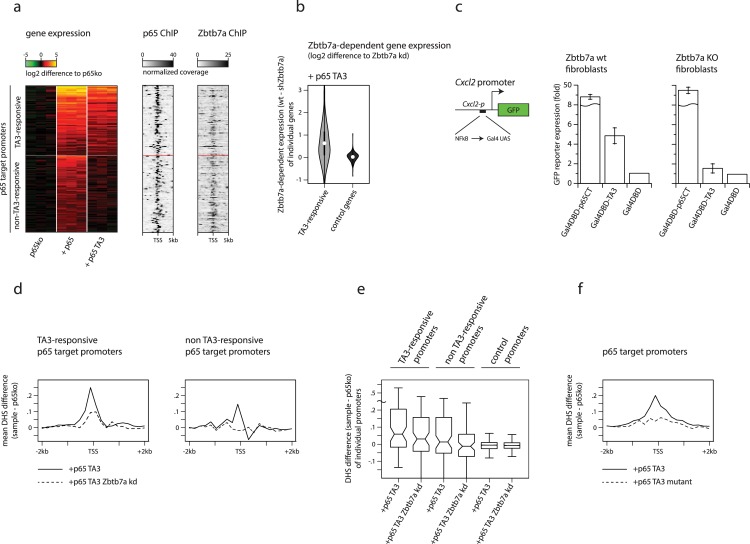
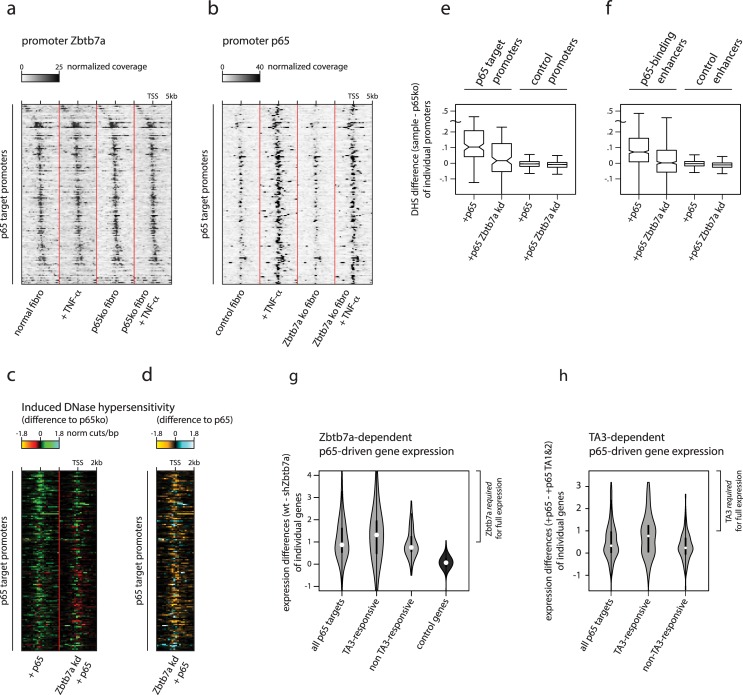
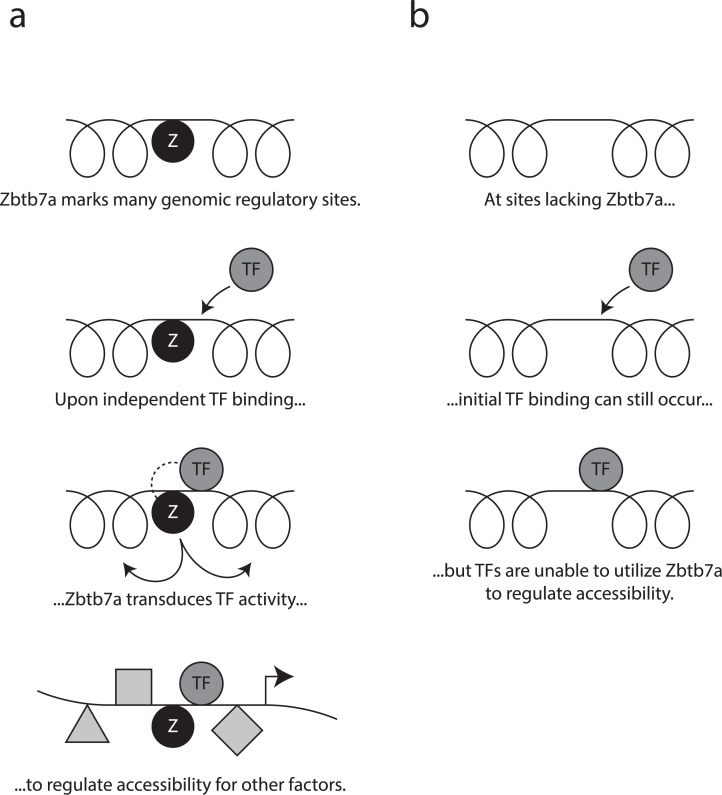
Gene expression in eukaryotes is controlled by DNA sequences at promoter and enhancer regions, whose accessibility for binding by regulatory proteins dictates their specific patterns of activity. Here, we identify the protein Zbtb7a as a factor required for inducible changes in accessibility driven by transcription factors (TFs). We show that Zbtb7a binds to a significant fraction of genomic promoters and enhancers, encompassing many target genes of nuclear factor kappa B (NFκB) p65 and a variety of other TFs. While Zbtb7a binding is not alone sufficient to directly activate promoters, it is required to enable TF-dependent control of accessibility and normal gene expression. Using p65 as a model TF, we show that Zbtb7a associates with promoters independently of client TF binding. Moreover, the presence of prebound Zbtb7a can specify promoters that are amenable to TF-induced changes in accessibility. Therefore, Zbtb7a represents a widely used promoter factor that transduces signals from other TFs to enable control of accessibility and regulation of gene expression.


Conflict of interest statement

The authors have declared that no competing interests exist.

Figures

Fig 1
Fig 1. A SILAC-based screen identifies the protein Zbtb7a as a factor associated with context-dependent gene regulation.
(A) Schematic illustration of p65 variants. (B) GFP reporter expression from a plasmid containing 3 tandem NFκB-binding motifs linked to a minimal promoter, in transfected p65-knockout fibroblasts expressing p65 variants and treated with TNF-α. Error bars indicate SEM. (C) Expression of endogenous Cxcl2 mRNA in TNF-α-treated p65-knockout fibroblasts expressing p65 or p65 TA3, or in untransduced p65-knockout fibroblasts. mRNA levels are expressed relative to the level in unstimulated p65-knockout cells. (D) DNase-I hypersensitivity levels induced by p65 or by p65 TA3, at TA3-responsive or control (non-NFκB target) promoters in transduced p65-knockout fibroblasts. Induced levels represent differences in mean cut frequencies within ±600 bp surrounding the TSS, compared to p65-knockout fibroblasts. TA3-responsive promoters are defined as promoters of genes whose expression is activated by p65 TA3 and that are associated with p65 ChIP-seq peaks (see Materials and methods). Lines in boxplots indicate median values; whiskers extend to the most extreme data within 1.5× the IQR from the box; outliers are not shown. (E) GFP reporter expression from plasmids containing 1 kb promoter sequences from the TA3-responsive Cxcl2 (left) and Saa3 (right) genes, or the Cxcl2 promoter with targeted mutations that delete the 2 consensus NFκB-binding motifs (centre), in transfected p65-knockout fibroblasts expressing p65 variants and treated with TNF-α. Error bars indicate SEM. (F) Expression of endogenous Cxcl2 mRNA in TNF-α-treated p65-knockout fibroblasts expressing p65 variants (the TA3 deletion corresponds to removal of amino acids 361–396) (see S1E Fig). mRNA levels are expressed as the percentage of those in cells reconstituted with p65 TA3. Error bars indicate SEM. (G) Cartoon of the SILAC-based pull-down strategy to identify proteins that specifically interact with the functional TA3 region. (H) Combined log2 SILAC ratios of 701 proteins identified in GST-TA3 pull-down using NEs from TNF-α-treated HeLa cells. Ratios represent the means of heavy/light ratios derived from separate pull-downs with labels swapped between samples. (I) Validation of Zbtb7a as a functional TA3 interactor by pull-down from transfected HEK-293 cells overexpressing Zbtb7a, using GST alone, GST-TA3, or GST-TA3mut. Zbtb7a was detected by immunoblotting. Arrowhead indicates Zbtb7a. (J) Measurement of in vivo Zbtb7a interaction with p65 using BiFC. BiFC fluorescence values represent the GMFI of cells co-expressing the indicated proteins tagged with V1 (carboxy-terminal) or V2 (amino-terminal) fragments of Venus fluorescent protein, expressed as a percentage of the GMFI of cells expressing Zbtb7a-V1 plus p65-V2. Error bars indicate SEM. (K) Expression of endogenous Cxcl2 mRNA in TNF-α-treated p65-knockout fibroblasts expressing p65 TA3, with or without shRNA knockdown of Zbtb7a. mRNA levels are expressed relative to the level in unstimulated cells without Zbtb7a knockdown. Statistical analysis of all experiments is provided as Supporting information, and numerical values underlying figures are reported in S1 Data. BiFC, bimolecular fluorescence complementation; ChIP-seq, chromatin immunoprecipitation sequencing; CT, carboxy terminal domain; GFP, green fluorescent protein; GMFI, geometric mean fluorescence intensity; GST, glutathione S-transferase; HEK-293, human embryonic kidney cells 293; IQR, interquartile range; m/z, mass to charge ratio; NE, nuclear extract; NFκB, nuclear factor kappa B; SEM, standard error of the mean; shRNA, short hairpin RNA; SILAC, stable isotope labelling of amino acids in cell culture; TNF-α, tumour necrosis factor alpha; TSS, transcription start site; Zip, control self-interacting leucine zipper sequence derived from yeast GCN4.
Fig 2
Fig 2. Zbtb7a is a widespread promoter- and enhancer-associated factor.
(A, B) Genome browser example tracks of a Zbtb7a ChIP-seq and input coverage (top) across representative 1 Mb genomic intervals, illustrating the prominent overlap between Zbtb7a peaks and TSSs, and (bottom) zoomed-in on 25 kb regions including the Zbtb7a-bound Camp (A) and Col4a1/2 (B) gene promoters. Lower tracks indicate predicted Zbtb7a binding peaks and RefSeq genes. (C) Fractions of the genome (left pie) and of Zbtb7a ChIP-seq peaks (right pie) that overlap with selected genomic features. (D) Fractions of the genome, of all promoters, and of p65 target promoters that are associated with predicted Zbtb7a ChIP-seq peaks. (E) DNA sequence motifs matching the described binding specificity of Zbtb7a, enriched among all (top) and promoter-associated (bottom) Zbtb7a ChIP-seq peaks, identified by de novo motif prediction. (F) Fractions of all promoters (top) or of promoters overlapping (bottom) or within 15 kb of (middle) predicted Zbtb7a ChIP-seq peaks that are expressed in fibroblasts at the indicated mRNA levels. (G) Enrichment of GO annotations among genes whose promoters are associated with Zbtb7a peaks (first column, “Zbtb7a promoter peak”) or with increased or decreased mRNA expression in control fibroblasts, compared to Zbtb7a-knockdown fibroblasts (second and third columns). Dots indicate statistically enriched annotations (P < 5 × 10⁻⁶; corrected q < 0.05). The most-significantly enriched annotations among genes with Zbtb7a-associated promoters are shown, of which some are also enriched among genes exhibiting Zbtb7a-regulated expression. Bars indicate levels of enrichment compared to all annotated genes. Statistical analysis is provided as Supporting information, and numerical values underlying figures are reported in S1 Data. ChIP-seq, chromatin immunoprecipitation sequencing; FPKM, RNA-sequencing fragments per kilobase transcript per million reads; GO, gene ontology; RefSeq, NCBI reference sequence database; TSS, transcription start site.
Fig 3
Fig 3. Zbtb7a is required for ongoing regulation of accessibility at a subset of its genomic binding sites.
(A–D) Genome browser example tracks of DNase-I hypersensitivity surrounding (A, B) the Camp and Col4a1/2 gene promoters (Zbtb7a-bound and Zbtb7a-dependent accessibility), (C) the promoter region of the JmjD2d and Cwc15 genes (Zbtb7a-bound but ongoing accessibility is Zbtb7a-independent), and (D) the control Hprt promoter (non Zbtb7a-bound), in control or Zbtb7a-knockdown fibroblasts. Lower tracks indicate predicted Zbtb7a binding peaks and RefSeq genes. (E–G) Fractions of (E) promoters, (F) enhancers, and (G) TA3-responsive p65 target promoters that exhibit significant evidence for Zbtb7a-regulated accessibility in fibroblasts. Left (E, F): regions without any associated Zbtb7a peak (“Zbtb7a-negative”); right (E, F): regions with associated Zbtb7a peaks. Yellow/cyan slices indicate promoters with increased/decreased DNase-I hypersensitivity in control fibroblasts compared to Zbtb7a-knockdown fibroblasts, at the indicated P value cutoffs. Statistical analysis is provided as Supporting information, and numerical values underlying figures are reported in S1 Data. RefSeq, NCBI reference sequence database; TNF-α, tumour necrosis factor alpha.
Fig 4
Fig 4. Target genes of a diverse set of TFs exhibit Zbtb7a-dependent promoter accessibility and expression.
(A) DNA sequence motifs that are consistently enriched at Zbtb7a ChIP-seq peaks (note that the binding motif for Zbtb7a itself is also highly enriched, but not shown here). Known TF families with specificities matching each motif are indicated. Grey and green bars display the log2 fold-enrichment of each motif among the subset of peaks exhibiting unchanged (grey) or disrupted (green) DNase-I hypersensitivity levels in Zbtb7a-knockdown fibroblasts. *Note that the motif TGANTCA belongs to a previously identified set of motifs that are commonly found to be enriched within unrelated genome-wide datasets [24], suggesting caution in interpretation based on motif enrichment alone, in this instance. (B) Schematic illustration of the strategy for identifying candidate Zbtb7a-utilising TF target genes and for experimentally analysing Zbtb7a dependence of promoter accessibility and gene expression. (C) Percentages of all promoters, and of target promoters of selected TFs, that exhibit Zbtb7a-regulated accessibility (experimentally defined as significantly reduced DNase-I hypersensitivity in Zbtb7a-knockdown fibroblasts, using a statistical cutoff of P < 0.05). Candidate TFs were identified using the scheme in panel b, and only targets of individual TFs that exhibit enrichment for Zbtb7a-regulated accessibility are shown. Error bars indicate 95% CIs. Significance of enrichments: Runx2 q = 1.4 × 10⁻⁶; cJun P = 1.4 × 10⁻⁶; Tead2 q = 2.3 × 10⁻¹¹; Cebpd q = 1.7 × 10⁻⁸; p65 P = 1.9 × 10⁻²⁹. (D) Microarray-based analysis of changes in mRNA expression levels upon Zbtb7a knockdown in fibroblasts, among target genes of selected TFs. Left: all TF target genes; right: target genes that also exhibit Zbtb7a-regulated accessibility. Lines in boxplots indicate median values; whiskers extend to the most extreme data within 1.5× the IQR from the box; outliers are not shown. Significance of expression differences: Runx2 P = 8.9 × 10⁻³; cJun P = 2.3 × 10⁻⁷; Tead2 P = 9.7 × 10⁻¹¹; Cebpd P = 4.9 × 10⁻⁶; p65 P = 1.8 × 10⁻¹⁴. Additional details of statistical analysis are provided as Supporting information, and numerical values underlying figures are reported in S1 Data. ChIP-seq, chromatin immunoprecipitation sequencing; IQR, interquartile range; TF, transcription factor.
Fig 5
Fig 5. Zbtb7a transduces regulation of accessibility upstream and independently of transcriptional activation.
(A) Left: mRNA expression levels of 153 direct p65 target genes (73 “TA3-responsive” plus 80 “non-TA3-responsive”), in TNF-α-treated p65-knockout fibroblasts and in fibroblasts reconstituted with p65 or p65 TA3. Middle: p65 ChIP signals, and right: Zbtb7a ChIP signals, at promoters of p65 target genes in TNF-α-treated normal fibroblasts. mRNA levels are log2 microarray signal differences to non-reconstituted p65-knockout fibroblasts, for 3 biological replicates. (B) mRNA expression differences between TNF-α-treated control and Zbtb7a-knockdown fibroblasts expressing p65 TA3, at distinct gene sets. Dots in violins indicate mean values. Significance of expression difference between TA3-responsive and control genes: P = 3.0 × 10⁻¹⁴. (C) GFP reporter expression in TNF-α-treated control (left) or Zbtb7a-knockout (right) fibroblasts, expressing p65 C-terminal regions fused to the DBD of Gal4 and cotransfected with plasmids carrying 1 kb promoter sequences from the Cxcl2 gene, in which NFκB binding motifs are replaced by the Gal4-UAS. Zbtb7a-knockout and congenic-control fibroblasts are both derived on a p53-knockout background, to prevent premature senescence [20]. Error bars indicate SEM. (D) Mean TA3-induced DNase hypersensitivity levels across TA3-responsive (left) or non-TA3-responsive (right) p65 target promoters, in TNF-α-treated control and Zbtb7a-knockdown fibroblasts. (E) DNase hypersensitivity levels induced by p65 TA3 at TA3-responsive, non-TA3-responsive, or control (non-NFκB target) promoters, in TNF-α-treated control and Zbtb7a-knockdown fibroblasts. Induced levels represent differences in mean cut frequencies within ±600 bp surrounding the TSS, compared to p65-knockout fibroblasts. Lines in boxplots indicate median values; whiskers extend to the most extreme data within 1.5× the IQR from the box; outliers are not shown. Significance of difference to Zbtb7a knockdown at non-TA3-responsive P = 4.7 × 10⁻². (F) Mean induced DNase hypersensitivity levels across p65 target promoters, in TNF-α-treated fibroblasts expressing p65 TA3 or a loss-of-function TA3 mutant that does not interact with Zbtb7a (“p65 TA3 mutant”). Additional details of statistical analysis are provided as Supporting information, and numerical values underlying figures are reported in S1 Data. ChIP, chromatin immunoprecipitation; DBD, DNA-binding domain; GFP, green fluorescent protein; IQR, interquartile range; NFκB, nuclear factor kappa B; SEM, standard error of the mean; TNF-α, tumour necrosis factor alpha; TSS, transcription start site.
Fig 6
Fig 6. Prebinding of Zbtb7a can specify the responsiveness of promoters and enhancers to induction of accessibility by TFs.
(A) Zbtb7a ChIP signals at p65 target promoters in untreated (left) and TNF-α-treated (left centre) normal fibroblasts, and untreated (right centre) and TNF-α-treated (right) p65-knockout fibroblasts. Promoters are sorted in order of Zbtb7a peak position. (B) p65 ChIP signals at p65 target promoters in untreated (left) and TNF-α-treated (left centre) control (congenic p53-knockout) fibroblasts, and untreated (right centre) and TNF-α-treated (right) fibroblasts derived from Zbtb7a-knockout fibroblasts. Promoters are sorted in order of Zbtb7a peak position. (C, D) Induced DNase-I hypersensitivity at p65 target promoters, in TNF-α-treated control or Zbtb7a-knockdown fibroblasts expressing p65. DNase hypersensitivity levels are shown at individual promoters as the differences to the levels observed in non-reconstituted p65-knockout fibroblasts (C), or as the differences between Zbtb7a-knockdown and control fibroblasts (D). (E, F) DNase-I hypersensitivity levels induced by p65, at p65 target and control promoters (E) or enhancers (F), in TNF-α-treated control and Zbtb7a-knockdown fibroblasts. Induced levels represent differences in mean cut frequencies within ±600 bp surrounding the TSS for promoters, or surrounding enhancer midpoints, compared to p65-knockout fibroblasts. Lines in boxplots indicate median values; whiskers extend to the most extreme data within 1.5× the IQR from the box; outliers are not shown. Significance of difference to Zbtb7a knockdown: p65 target promoters P = 2.4 × 10⁻⁸; p65-binding enhancers P = 1.1 × 10−134. (G) mRNA expression differences between TNF-α-treated control and Zbtb7a-knockdown fibroblasts expressing p65, at distinct gene sets. Genes whose expression levels are most reduced by Zbtb7a knockdown are indicated as those for which Zbtb7a is required for full expression. Dots in violins indicate mean values. Significance of expression difference between TA3-responsive and control genes: P = 1.6 × 10⁻²⁶. (H) mRNA expression differences between TNF-α-treated fibroblasts expressing p65 and those expressing the p65 TA1&2 variant, at distinct gene sets. Genes whose expression levels are most reduced in p65 TA1&2-expressing cells (lacking the TA3 region) are indicated as those for which TA3 is required for full expression. Dots in violins indicate mean values. Significance of expression difference between TA3-responsive and control genes: P = 2.3 × 10⁻¹². Additional details of statistical analysis are provided as Supporting information, and numerical values underlying figures are reported in S1 Data. ChIP, chromatin immunoprecipitation; IQR, interquartile range; TF, transcription factor; TNF-α, tumour necrosis factor alpha; TSS, transcription start site.
Fig 7
Fig 7. Scheme of Zbtb7a function at gene-regulatory elements.
Cartoon outlining role of Zbtb7a described in this paper. Principal experimental evidence for each depicted step is shown in the indicated figures. (A) Top row: Zbtb7a binds to many genomic regulatory sites, including promoters and enhancers (see Fig 2C and 2D). Zbtb7a binding is independent of the presence of client TFs, and binding may occur before client TF recruitment (see Fig 6A). Second row: Zbtb7a-utilising client TFs bind independently to neighbouring genomic sites. This may occur under normal, steady-state conditions or in response to stimulation (see Figs 4A and 6B). Third row: Zbtb7a transduces TF-dependent changes in local chromatin accessibility (see Figs 4C, 5D, 6C, 6D, 6E and 6F). In the case of p65, this is triggered by the interaction between Zbtb7a and the TA3 region of p65 (see Fig 5F). Bottom row: Zbtb7a-transduced accessibility allows binding of secondary TFs and contributes to normal gene activation (see Figs 4D, 6G and S3L and S3M Fig). (B) At genomic sites that lack Zbtb7a binding (which could occur due to the natural genomic distribution of Zbtb7 or through experimental manipulation), client TF binding is unimpaired (see Fig 6B), but Zbtb7a-dependent regulation of accessibility is abolished (see Figs 4C, 6C, 6D, 6E and 6F). TF, transcription factor.

References

    1. Bell O, Tiwari VK, Thoma NH, Schubeler D (2011) Determinants and dynamics of genome accessibility. Nat Rev Genet 12: 554–564. doi: 10.1038/nrg3017 - DOI - PubMed
    1. Guertin MJ, Lis JT (2013) Mechanisms by which transcription factors gain access to target sequence elements in chromatin. Curr Opin Genet Dev 23: 116–123. doi: 10.1016/j.gde.2012.11.008 - DOI - PMC - PubMed
    1. Chen T, Dent SY (2014) Chromatin modifiers and remodellers: regulators of cellular differentiation. Nat Rev Genet 15: 93–106. doi: 10.1038/nrg3607 - DOI - PMC - PubMed
    1. Clapier CR, Cairns BR (2009) The biology of chromatin remodeling complexes. Annu Rev Biochem 78: 273–304. doi: 10.1146/annurev.biochem.77.062706.153223 - DOI - PubMed
    1. Buenrostro JD, Giresi PG, Zaba LC, Chang HY, Greenleaf WJ (2013) Transposition of native chromatin for fast and sensitive epigenomic profiling of open chromatin, DNA-binding proteins and nucleosome position. Nat Methods 10: 1213–1218. doi: 10.1038/nmeth.2688 - DOI - PMC - PubMed

Publication types