

Competition and niche construction in a model of cancer metastasis
- PMID: 29813117
- PMCID: PMC5973602
- DOI: 10.1371/journal.pone.0198163
Competition and niche construction in a model of cancer metastasis
Abstract
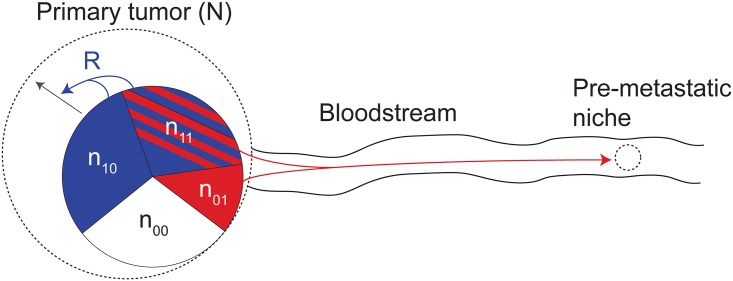
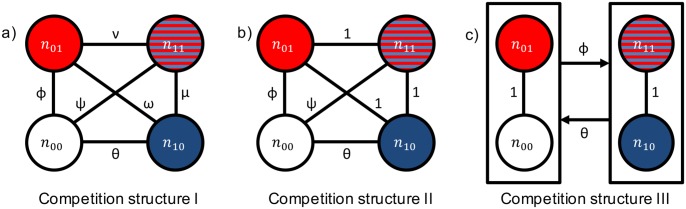
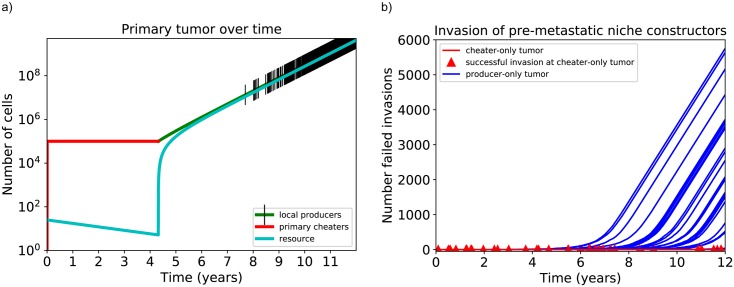
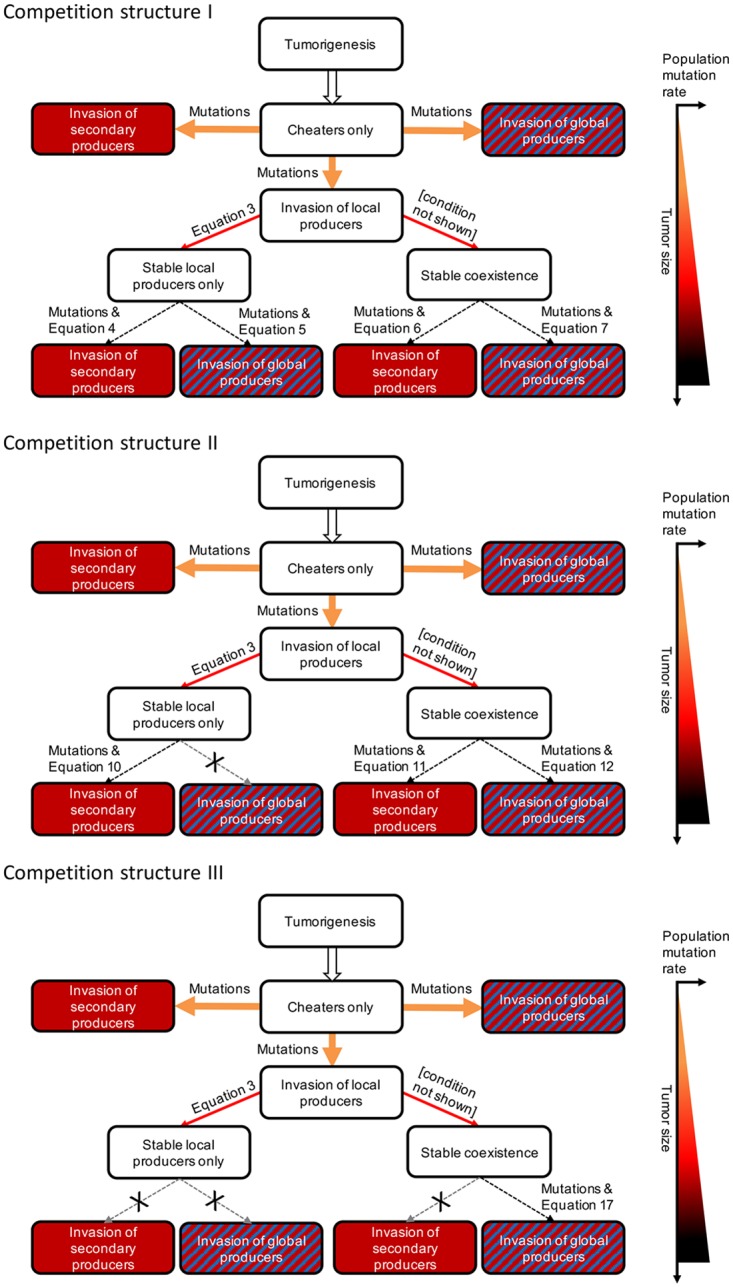
Niche construction theory states that not only does the environment act on populations to generate Darwinian selection, but organisms reciprocally modify the environment and the sources of natural selection. Cancer cells participate in niche construction as they alter their microenvironments and create pre-metastatic niches; in fact, metastasis is a product of niche construction. Here, we present a mathematical model of niche construction and metastasis. Our model contains producers, which pay a cost to contribute to niche construction that benefits all tumor cells, and cheaters, which reap the benefits without paying the cost. We derive expressions for the conditions necessary for metastasis, showing that the establishment of a mutant lineage that promotes metastasis depends on niche construction specificity and strength of interclonal competition. We identify a tension between the arrival and invasion of metastasis-promoting mutants, where tumors composed only of cheaters remain small but are susceptible to invasion whereas larger tumors containing producers may be unable to facilitate metastasis depending on the level of niche construction specificity. Our results indicate that even if metastatic subclones arise through mutation, metastasis may be hindered by interclonal competition, providing a potential explanation for recent surprising findings that most metastases are derived from early mutants in primary tumors.
Conflict of interest statement
The authors have declared that no competing interests exist.
Figures
References
-
- Basanta D, Anderson AR. Exploiting ecological principles to better understand cancer progression and treatment. Interface Focus. 2013;3(4):20130020 doi: 10.1098/rsfs.2013.0020 - DOI - PMC - PubMed
-
- Lloyd MC, Gatenby RA, Brown JS. Ecology of the Metastatic Process In: Ecology and Evolution of Cancer. Elsevier; 2017. p. 153–165.
-
- Altrock PM, Liu LL, Michor F. The mathematics of cancer: integrating quantitative models. Nature Reviews Cancer. 2015;15(12):730–745. doi: 10.1038/nrc4029 - DOI - PubMed
-
- Korolev KS, Xavier JB, Gore J. Turning ecology and evolution against cancer. Nature Reviews Cancer. 2014;14(5):371–380. doi: 10.1038/nrc3712 - DOI - PubMed
-
- Laland KN, Odling-Smee FJ, Feldman MW. Evolutionary consequences of niche construction and their implications for ecology. Proceedings of the National Academy of Sciences. 1999;96(18):10242–10247. doi: 10.1073/pnas.96.18.10242 - DOI - PMC - PubMed
Publication types
MeSH terms
LinkOut - more resources
Full Text Sources
Other Literature Sources
