. 2018 May 29;12(1):60.
doi: 10.1186/s12918-018-0556-z.

A computational framework for complex disease stratification from multiple large-scale datasets

Affiliations

A computational framework for complex disease stratification from multiple large-scale datasets

Bertrand De Meulder et al. BMC Syst Biol. .

Abstract

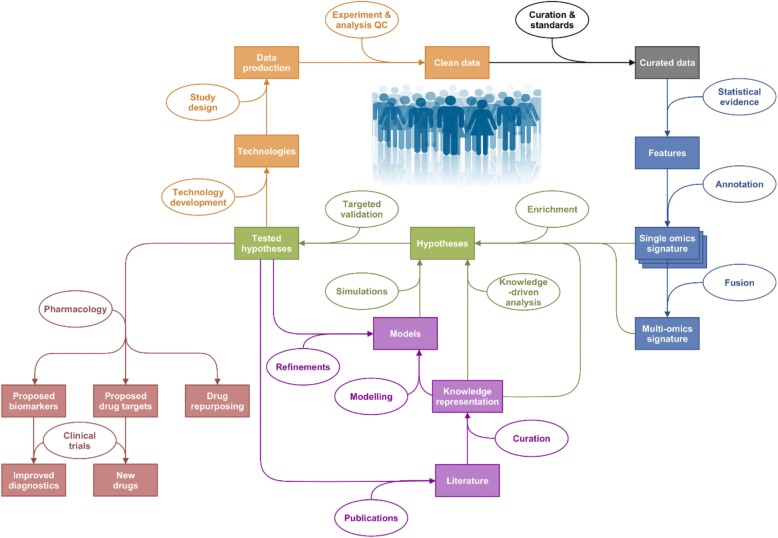
Background: Multilevel data integration is becoming a major area of research in systems biology. Within this area, multi-'omics datasets on complex diseases are becoming more readily available and there is a need to set standards and good practices for integrated analysis of biological, clinical and environmental data. We present a framework to plan and generate single and multi-'omics signatures of disease states.

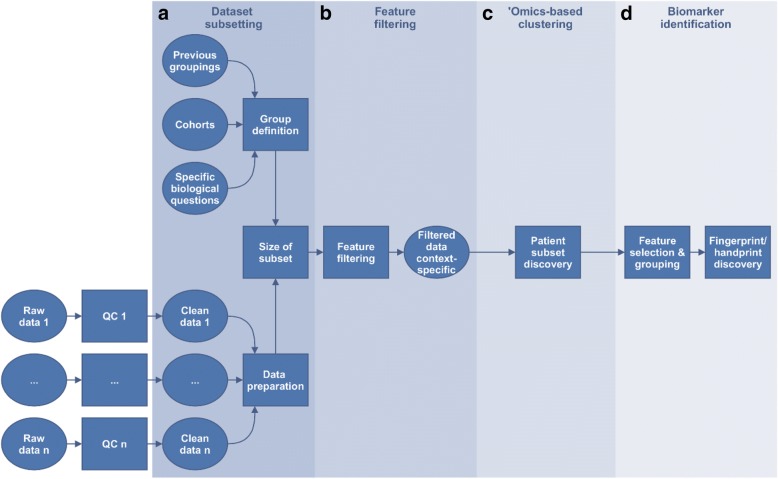
Methods: The framework is divided into four major steps: dataset subsetting, feature filtering, 'omics-based clustering and biomarker identification.

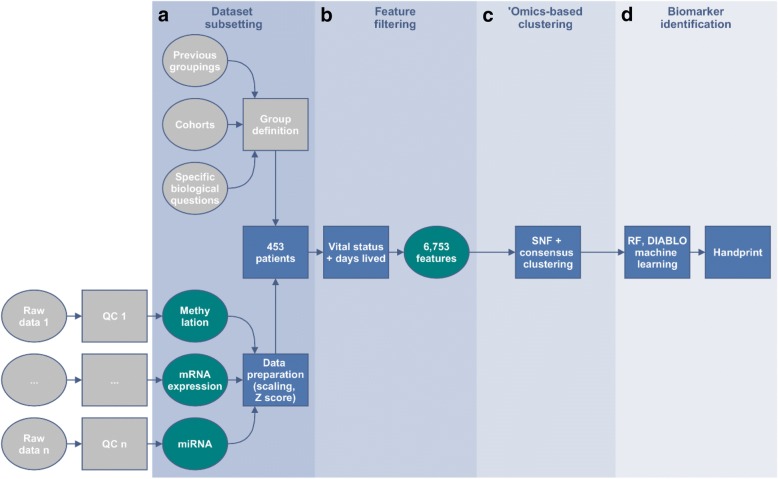
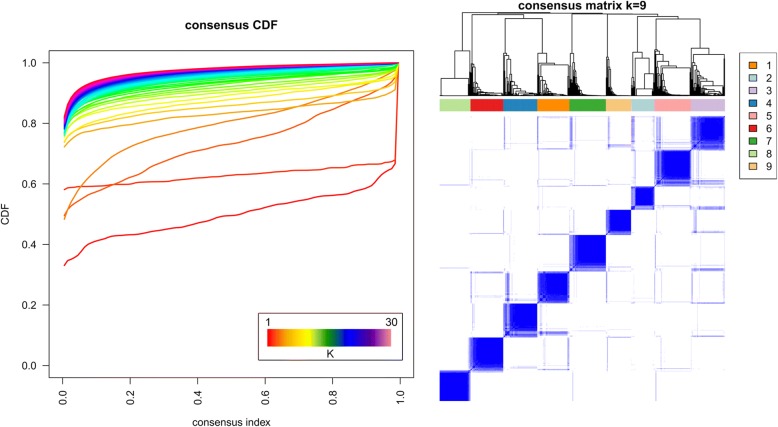
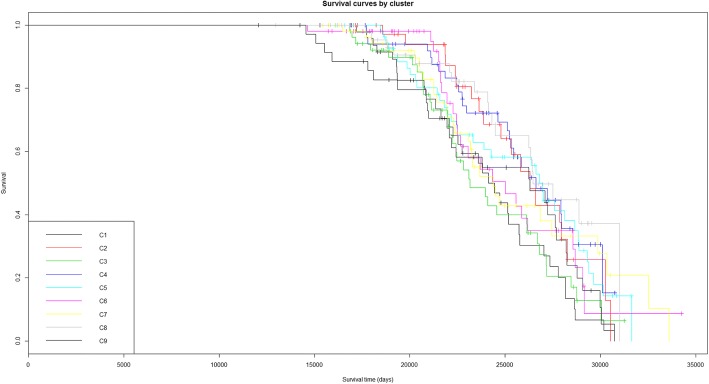
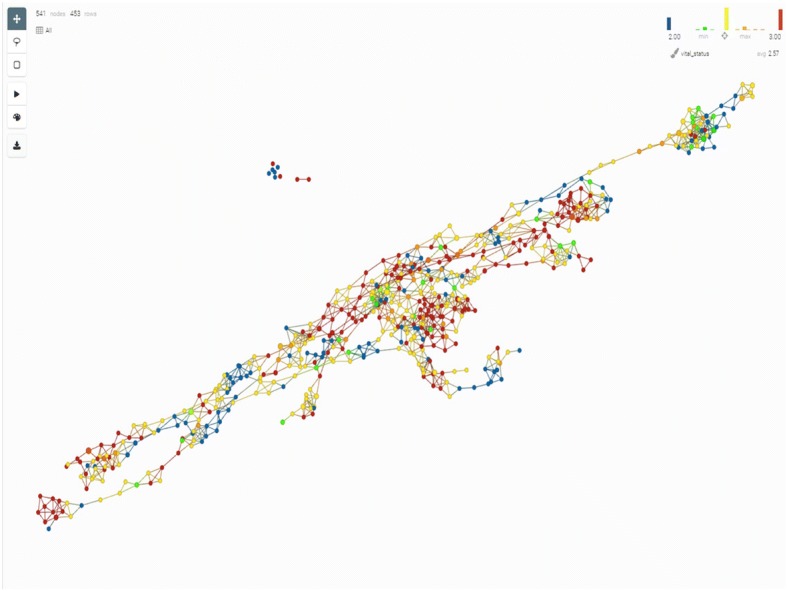
Results: We illustrate the usefulness of this framework by identifying potential patient clusters based on integrated multi-'omics signatures in a publicly available ovarian cystadenocarcinoma dataset. The analysis generated a higher number of stable and clinically relevant clusters than previously reported, and enabled the generation of predictive models of patient outcomes.

Conclusions: This framework will help health researchers plan and perform multi-'omics big data analyses to generate hypotheses and make sense of their rich, diverse and ever growing datasets, to enable implementation of translational P4 medicine.

Keywords: Molecular signatures; Stratification; Systems medicine; ‘Omics data.


Conflict of interest statement

Ethics approval and consent to participate

Not applicable

Consent for publication

Not applicable

Competing interests

ATB received fees from Acclarogen Ltd. KK received fees from UCB Celltech Ltd. JvE received fees from UCB Pharma S.A. AB received fees from Roche Products Ltd. TD received fees from Janssen R & D High Wycombe Ltd. PD received fees from AstraZeneca Ltd. CL received fees from GSK Ltd. JC received fees from Areteva R & D Ltd. AMan received fees from Roche Diagnostics GmbH, AR received fees from Janssen R & D High Wycombe Ltd. FB received fees from Janssen R & D Springhouse LLC.

Publisher’s Note

Springer Nature remains neutral with regard to jurisdictional claims in published maps and institutional affiliations.

Figures

Fig. 1
Fig. 1
Outline of the Systems Medicine rationale. Represented in orange are the steps linked to quality data production, followed by curation in grey, identification of interesting features through statistical analysis in blue and hypothesis generation and their validation in green. Modelling and knowledge representation methods can inform the hypotheses generated through statistical analysis of generated hypotheses on their own (in purple). Outputs of this exercise are represented in red: drug repurposing, new drugs and improved diagnostics, with the help of clinical trials
Fig. 2
Fig. 2
Process proposed for handling high levels of non-random missing data. If there are less than 10% missing values, data imputation is used, then tested for association (artificial associations might arise from the imputation process, which would then skew the analysis downstream) and submitted to a sensitivity analysis. If there are more than 10% missing values, we either collapse the feature/patient to a binary (presence/absence) scheme and run a χ2 test for difference in detection rates, or explore several imputation methods with highly cautious interpretation
Fig. 3
Fig. 3
Overview of the framework. Starting from quality-checked and pre-processed ‘omics data, four key generic steps are highlighted: (a) dataset subsetting, including formulation of the biological question to be answered and data preparation, (b) feature filtering (optional step) where features that are uninformative in relation to the question can be removed, (c) ‘omics-based unsupervised clustering (optional step) aiming at finding groups of participants arising from the data structure using the (optionally filtered) features, and finally d) biomarker identification, including feature selection by bioinformatics means and machine learning algorithms for prediction
Fig. 4
Fig. 4
Framework outline for the TCGA handprint analysis with additional feature filtering. Each dataset was separately filtered based on nominal p-values < 0.05 when comparing alive versus deceased patients at the end of the study taking into account the total amount of days alive. A total of 6753 features were selected: 899 differentially methylated genes, 37 miRNAs and 5817 differentially expressed probesets. Consensus clustering on the fused similarity matrices determined the number of stable clusters that were viewed in a Kaplan-Meyer plot and tested for differential survival. Machine learning was then performed to identify candidate features predicting the identified groups: Recursive Feature Elimination (RFE) on a linear Support-Vector-Machine (SVM) model to identify informative features, followed by a Random Forest (RF) model building in parallel with DIABLO sPLS-DA on those features
Fig. 5
Fig. 5
Consensus clustering results for the handprint analysis with feature filtering. A number of stable clustering schemes are available (k = 3, 6, 7, 8, 9). Nine clusters were chosen as the most informative, while keeping a low value of the deviation from ideal stability index and with clinical characteristics of the clusters statistically different in both survival time and survival status between clusters
Fig. 6
Fig. 6
Kaplan-Meyer plot of survival for patients from the nine clusters revealed with the consensus clustering analysis. The x axis bears the total amount of days that patients have lived, i.e. the sum of their age at enrolment in the study plus the recorded amount of days they survived during the study, censored to the right by the end of measurements in the study (enrolment plus 4624 days)
Fig. 7
Fig. 7
Network of patients shown in the TDA platform. The network is constructed as ‘bins’ grouping patients who are similar based on their ‘omics profiles. Each dot in the network represents a bin. The bins are overlapping by an adaptable percentage, and if at least one patient is present in the overlap of two bins, the two bins will be linked in the network. The survival status of the patients is then translated as a color scheme (blue representing deceased patients and red alive patients). Using this technique, it is easy to identify ‘islands’ of good and poor survival among the patients, and equally easy to acknowledge that there are more such islands than is identified through the clustering technique. Thorough analysis of such networks can lead to insights into biology, as detailed in [168]

References

    1. Jameson JL, Longo DL. Precision medicine--personalized, problematic, and promising. N Engl J Med. 2015;372(23):2229–2234. doi: 10.1056/NEJMsb1503104. - DOI - PubMed
    1. Chen R, Snyder M. Promise of personalized omics to precision medicine. Wiley Interdiscip Rev Syst Biol Med. 2013;5(1):73–82. doi: 10.1002/wsbm.1198. - DOI - PMC - PubMed
    1. Viceconti M, Hunter P, Hose R. Big data, big knowledge: big data for personalized healthcare. IEEE J Biomed Health Inform. 2015;19(4):1209–1215. doi: 10.1109/JBHI.2015.2406883. - DOI - PubMed
    1. Ritchie MD, Holzinger ER, Li R, Pendergrass SA, Kim D. Methods of integrating data to uncover genotype-phenotype interactions. Nat Rev Genet. 2015;16(2):85–97. doi: 10.1038/nrg3868. - DOI - PubMed
    1. Berger B, Gaasterland T, Lengauer T, Orengo C, Gaeta B, Markel S, Valencia A. ISCB's initial reaction to the New England journal of medicine editorial on data sharing. PLoS Comput Biol. 2016;12(3):e1004816. doi: 10.1371/journal.pcbi.1004816. - DOI - PMC - PubMed

Publication types