. 2018 Jun 13;38(24):5567-5583.
doi: 10.1523/JNEUROSCI.0705-18.2018. Epub 2018 May 29.

A Central Extended Amygdala Circuit That Modulates Anxiety

Affiliations

A Central Extended Amygdala Circuit That Modulates Anxiety

Sandra Ahrens et al. J Neurosci. .

Abstract

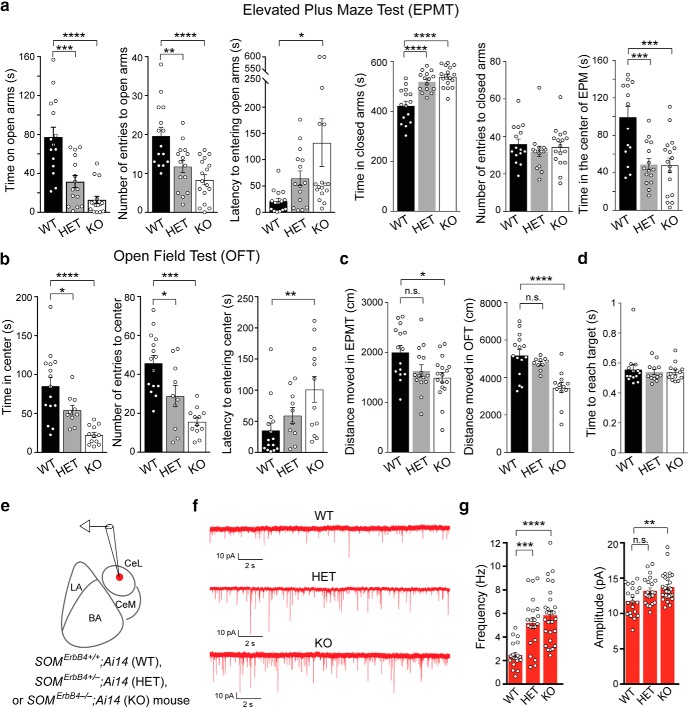
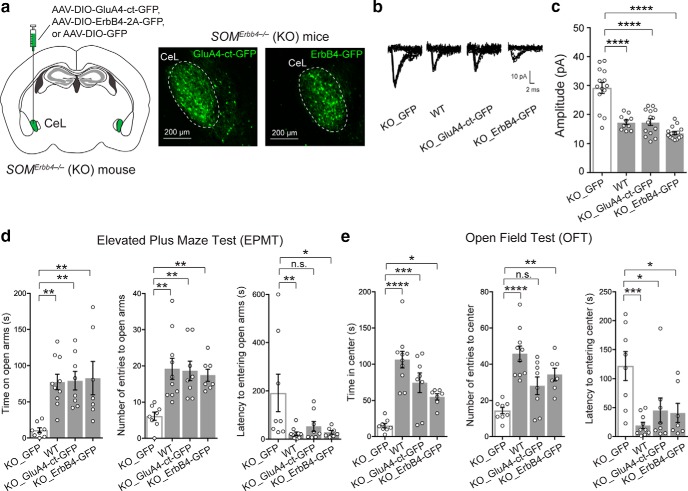
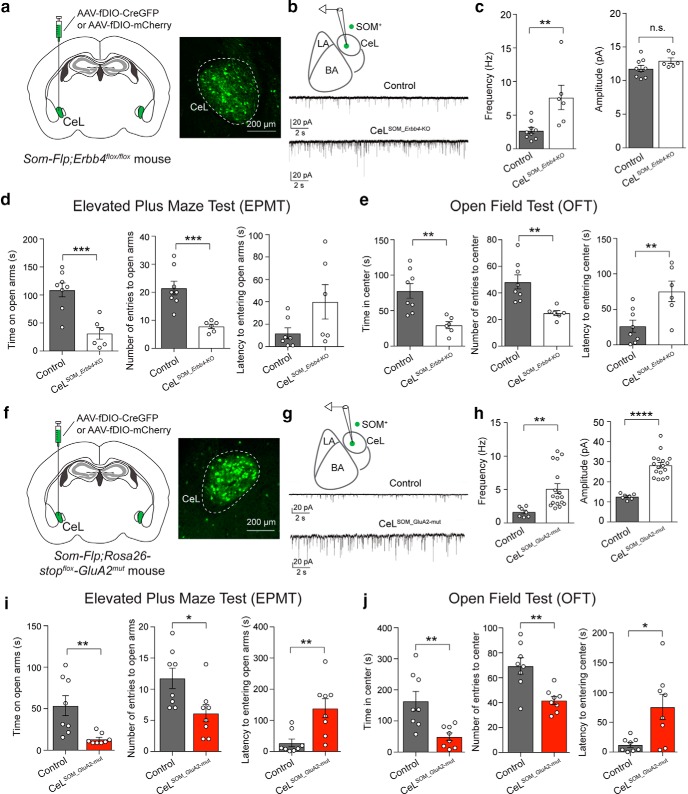
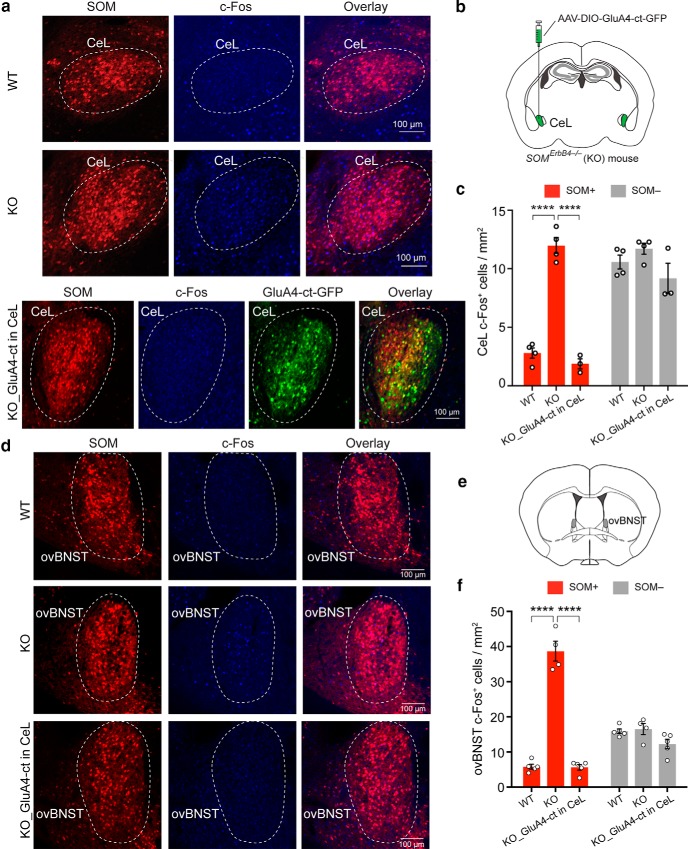
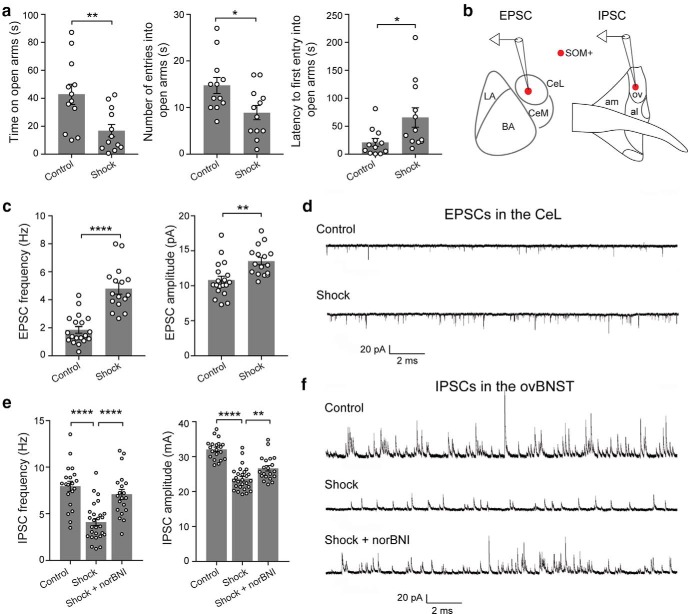
Both the amygdala and the bed nucleus of the stria terminalis (BNST) have been implicated in maladaptive anxiety characteristics of anxiety disorders. However, the underlying circuit and cellular mechanisms have remained elusive. Here we show that mice with Erbb4 gene deficiency in somatostatin-expressing (SOM+) neurons exhibit heightened anxiety as measured in the elevated plus maze test and the open field test, two assays commonly used to assess anxiety-related behaviors in rodents. Using a combination of electrophysiological, molecular, genetic, and pharmacological techniques, we demonstrate that the abnormal anxiety in the mutant mice is caused by enhanced excitatory synaptic inputs onto SOM+ neurons in the central amygdala (CeA), and the resulting reduction in inhibition onto downstream SOM+ neurons in the BNST. Notably, our results indicate that an increase in dynorphin signaling in SOM+ CeA neurons mediates the paradoxical reduction in inhibition onto SOM+ BNST neurons, and that the consequent enhanced activity of SOM+ BNST neurons is both necessary for and sufficient to drive the elevated anxiety. Finally, we show that the elevated anxiety and the associated synaptic dysfunctions and increased dynorphin signaling in the CeA-BNST circuit of the Erbb4 mutant mice can be recapitulated by stress in wild-type mice. Together, our results unravel previously unknown circuit and cellular processes in the central extended amygdala that can cause maladaptive anxiety.SIGNIFICANCE STATEMENT The central extended amygdala has been implicated in anxiety-related behaviors, but the underlying mechanisms are unclear. Here we found that somatostatin-expressing neurons in the central amygdala (CeA) controls anxiety through modulation of the stria terminalis, a process that is mediated by an increase in dynorphin signaling in the CeA. Our results reveal circuit and cellular dysfunctions that may account for maladaptive anxiety.

Keywords: BNST; ErbB4; anxiety; central amygdala; dynorphin; stress.


Figures

Figure 1.
Figure 1.
ErbB4 deficiency in SOM+ neurons causes increased anxiety and enhanced excitatory synaptic transmission onto SOM+ CeL neurons. a, Quantification of behavioral parameters in the EPMT. b, Quantification of behavioral parameters in the OFT. c, Distance moved in EPMT and OFT. d, Time needed to reach targets in a decision-making task (Ahrens et al., 2015). e, A schematic of the recording configuration. f, Representative mEPSC traces recorded from SOM+ neurons in the CeL of WT, HET and KO mice. g, Left, Quantification of mEPSC frequency. Right, Quantification of mEPSC amplitude. Data are presented as the mean ± SEM. *p < 0.05, **p < 0.01, ***p < 0.001, ****p < 0.0001, n.s. (not significant).
Figure 2.
Figure 2.
Rescue of behavioral phenotypes by rescuing the potentiated excitatory synaptic transmission onto SOM+ CeL neurons in the ErbB4 mutant mice. a, Left, A schematic of the experimental design. Right, Example images of the SOM+ CeL neurons expressing GluA4-ct-GFP or ErbB4–2A-GFP. b, Representative traces of EPSCs recorded from SOM+ CeL neurons in response to minimal electrical stimulation in the LA (emEPSCs). c, Quantification of the amplitude of emEPSCs. d, Quantification of behavioral parameters in the EPMT. e, Quantification of behavioral parameters in the OFT. Data are presented as the mean ± SEM. *p < 0.05, **p < 0.01, ***p < 0.001, ****p < 0.0001, n.s. (not significant).
Figure 3.
Figure 3.
Potentiation of excitatory synaptic drive onto SOM+ CeL neurons is sufficient to cause enhanced anxiety. a–e, Selective deletion of Erbb4 in SOM+ CeL neurons potentiated excitatory synapses onto these neurons and caused increased anxiety in mice. a, Left, A schematic of the experimental design. Right, An example image of the SOM+ CeL neurons expressing Cre-GFP. b, Top, A schematic of the recording configuration. Bottom, Representative mEPSC traces recorded from SOM+ neurons in the CeL of control mice (top) and mice in which Erbb4 was selectively deleted in SOM+ CeL neurons (bottom). c, Left, Quantification of mEPSC frequency. Right, Quantification of mEPSC amplitude. d, Quantification of behavioral parameters in the EPMT. e, Quantification of behavioral parameters in the OFT. f–j, Selective potentiation of excitatory synaptic transmission onto SOM+ CeL neurons was sufficient to drive enhanced anxiety in mice. f, Left, A schematic of the experimental design. Right, An example image of the SOM+ CeL neurons expressing Cre-GFP. g, Top, A schematic of the recording configuration. Bottom, Representative mEPSC traces recorded from SOM+ neurons in the CeL of control mice (top) and mice in which the GluA2mut was selectively expressed in SOM+ CeL neurons (bottom). h, Left, Quantification of mEPSC frequency. Right, Quantification of mEPSC amplitude. i, Quantification of behavioral parameters in the EPMT. j, Quantification of behavioral parameters in the OFT. Data are presented as the mean ± SEM. *p < 0.05, **p < 0.01, ***p < 0.001, ****p < 0.0001, n.s. (not significant).
Figure 4.
Figure 4.
The potentiated excitatory synaptic drive onto SOM+ CeL neurons causes enhanced activity in these neurons and in SOM+ dBNST neurons in the ErbB4 mutant mice. a, Representative images of the CeL from WT and KO mice (top and middle), and from KO mice in which the rescue molecule GluA4-ct was specifically expressed in SOM+ CeL neurons (bottom). SOM+ neurons were labeled with the Ai14 reporter. Basal c-Fos expression was recognized with an antibody. b, A schematic of the experimental design. c, Quantification of c-Fos expression in SOM+ and SOM CeL cells, showing that c-Fos levels are increased specifically in SOM+ CeL cells in the KO mice, and that this increase is normalized by expression of GluA4-ct in SOM+ CeL neurons. d, Same as a, except that images were taken from brain sections containing the ovBNST. e, A schematic brain section to show the localization of the ovBNST. f, Quantification of c-Fos expression in SOM+ and SOM ovBNST cells, showing that c-Fos levels are increased specifically in SOM+ ovBNST cells in the KO mice, and that this increase is normalized by the expression of GluA4-ct in SOM+ CeL neurons. Data are presented as the mean ± SEM in c and f. ****p < 0.0001.
Figure 5.
Figure 5.
SOM+ CeL neurons innervate neurons in the ovBNST. a, Left, A schematic of the experimental approach. Right, CTB-labeled neurons can be detected in the CeL (red), many of which are SOM+ (green; arrows). CTB, Cholera Toxin subunit B. b, A schematic of the experimental approach. c, A schematic of the recording configuration. d, Example traces of the IPSCs recorded from a SOM+ (red) and a SOM (black) ovBNST neuron in response to optogenetic stimulation of the inputs from SOM+ CeL neurons. e, Quantification of IPSC amplitude. Data are presented as the mean ± SEM in e.
Figure 6.
Figure 6.
The potentiated excitatory synaptic drive onto SOM+ CeL neurons causes disinhibition of SOM+ ovBNST neurons in the ErbB4 mutant mice. a, A schematic of the recording configuration. b, Representative sIPSC traces recorded from SOM+ neurons in the ovBNST of WT mice (top) and ErbB4 mutant mice (bottom). c, Left, Quantification of sIPSC frequency. Right, Quantification of sIPSC amplitude. d, A schematic of the experimental design. e, Representative sIPSC traces recorded from SOM+ neurons in the ovBNST of a KO mouse (top) and a KO mouse in which GluA4-ct was selectively expressed in SOM+ CeL neurons (bottom). f, Left, Quantification of sIPSC frequency. Right, Quantification of sIPSC amplitude. Data are presented as the mean ± SEM in c and f. ****p < 0.0001.
Figure 7.
Figure 7.
The activity of SOM+ dBNST neurons is required for the enhanced anxiety in the ErbB4 mutant mice and is sufficient to drive anxiety in ErbB4 wild-type mice. a–f, For all these manipulations, we aimed at targeting the ov. However, due to the fact that the ovBNST is small and very close to the adjacent nuclei, our manipulations may have also affected other BNST nuclei, in particular the am and al areas. a, Left, A schematic of the experimental design. Right, An example image showing SOM+ ovBNST neurons expressing TeLC-GFP. b, Left, Quantification of time spent on the open are in the EPMT. Right, Quantification of time spent in the center in the OFT. c, The density of SOM+ ovBNST neurons infected with the TeLC-GFP virus correlated with the decrease in anxiety measured by the time spend on open arms during the EPMT. d, Left, Schematics of the experimental design. Right, An example image of the ovBNST in a Som-Flp;Gabrg2flox mouse, showing the expression of Cre-GFP in SOM+ ovBNST neurons. e, Quantification of measures of anxiety in the EPMT (left) and OFT (right) in the γ2-KO and γ2-WT mice. Ablation of γ2 increases anxiety. f, The density of SOM+ ovBNST neurons infected with the AAV-fDIO-Cre-GFP virus correlated with the increase in anxiety measured by the time spend on open arms during the EPMT. Data are presented as the mean ± SEM in b and e. *p < 0.05, **p < 0.01.
Figure 8.
Figure 8.
Enhanced dynorphin signaling in the ErbB4 mutant mice causes ovBNST disinhibition and enhanced anxiety. a, Heatmap depicting neuropeptide gene expression levels [log10 (normalized read counts + 1)] in CeL IP and input samples, which represent SOM+ cells and all cells, respectively; genes are ranked by abundance in SOM+ cells. b, Volcano plot showing log2 (fold change; IP against input) plotted against −log10 (Bonferroni–Hochberg-adjusted p value). Significantly differentially expressed genes are colored blue. Select neuropeptides are highlighted in red. c, Bright-field microscopy images of the in situ hybridization of Pdyn in the CeL of WT mice (top) and KO mice (bottom). d, Quantification of Pdyn expression by measuring the average pixel intensity. e, A schematic of the recording configuration. f, Representative sIPSC traces recorded from a SOM+ ovBNST neuron in a KO mouse before (top) and after (bottom) application of 100 nm norBNI. g, Left, Quantification of sIPSC frequency. Right, Quantification of sIPSC amplitude. h, Left, A schematic of the experimental configuration. Microinfusion cannulae were implanted bilaterally above the ovBNST. Right, A representative image of the BNST, showing the track of an implanted cannula above the ovBNST. i, Microinfusion of norBNI reduces anxiety in KO/HET mice but does not affect anxiety in WT mice. Left, Quantification of time spent on the open arms in the EPMT. Right, Quantification of time spent in the center in the OFT. Data are presented as the mean ± SEM in d, g, and i. *p < 0.05, **p < 0.01, ***p < 0.001, ****p < 0.0001.
Figure 9.
Figure 9.
Stress induces behavioral and cellular changes in the CeL and ovBNST that mimic those in the ErbB4 mutant mice. a, Stress induced by uncontrollable and unpredictable footshocks increased anxiety in the EPMT. b, Schematics of the recording configurations. c, Quantification of the frequency (left) and amplitude (right) of mEPSCs recorded from SOM+ CeL neurons. d, Representative mEPSC traces recorded from a neuron in a control mouse (top) and a neuron in a stressed mouse (bottom). e, Quantification of the frequency (left) and amplitude (right) of sIPSCs recorded from SOM+ ovBNST neurons. f, Example traces of sIPSC recorded from neurons of the three experimental groups. Data are presented as the mean ± SEM in a, c, and e. *p < 0.05, **p < 0.01, ****p < 0.0001.

Comment in

References

    1. Ahrens S, Jaramillo S, Yu K, Ghosh S, Hwang GR, Paik R, Lai C, He M, Huang ZJ, Li B (2015) ErbB4 regulation of a thalamic reticular nucleus circuit for sensory selection. Nat Neurosci 18:104–111. 10.1038/nn.3897 - DOI - PMC - PubMed
    1. Al-Hasani R, McCall JG, Shin G, Gomez AM, Schmitz GP, Bernardi JM, Pyo CO, Park SI, Marcinkiewcz CM, Crowley NA, Krashes MJ, Lowell BB, Kash TL, Rogers JA, Bruchas MR (2015) Distinct subpopulations of nucleus accumbens dynorphin neurons drive aversion and reward. Neuron 87:1063–1077. 10.1016/j.neuron.2015.08.019 - DOI - PMC - PubMed
    1. Alheid GF, Heimer L (1988) New perspectives in basal forebrain organization of special relevance for neuropsychiatric disorders: the striatopallidal, amygdaloid, and corticopetal components of substantia innominata. Neuroscience 27:1–39. 10.1016/0306-4522(88)90217-5 - DOI - PubMed
    1. Andreatta M, Glotzbach-Schoon E, Mühlberger A, Schulz SM, Wiemer J, Pauli P (2015) Initial and sustained brain responses to contextual conditioned anxiety in humans. Cortex 63:352–363. 10.1016/j.cortex.2014.09.014 - DOI - PubMed
    1. Batista-Brito R, Vinck M, Ferguson KA, Chang JT, Laubender D, Lur G, Mossner JM, Hernandez VG, Ramakrishnan C, Deisseroth K, Higley MJ, Cardin JA (2017) Developmental dysfunction of vip interneurons impairs cortical circuits. Neuron 95:884–895.e9. 10.1016/j.neuron.2017.07.034 - DOI - PMC - PubMed

Publication types