. 2018 Jul;49(7):1719-1726.
doi: 10.1161/STROKEAHA.117.020461. Epub 2018 May 29.

Diverse Inflammatory Response After Cerebral Microbleeds Includes Coordinated Microglial Migration and Proliferation

Affiliations

Diverse Inflammatory Response After Cerebral Microbleeds Includes Coordinated Microglial Migration and Proliferation

Sung Ji Ahn et al. Stroke. 2018 Jul.

Abstract

Background and purpose: Cerebral microbleeds are linked to cognitive decline, but it remains unclear how they impair neuronal function. Infarction is not typically observed near microbleeds, suggesting more subtle mechanisms, such as inflammation, may play a role. Because of their small size and largely asymptomatic nature, real-time detection and study of spontaneous cerebral microbleeds in humans and animal models are difficult.

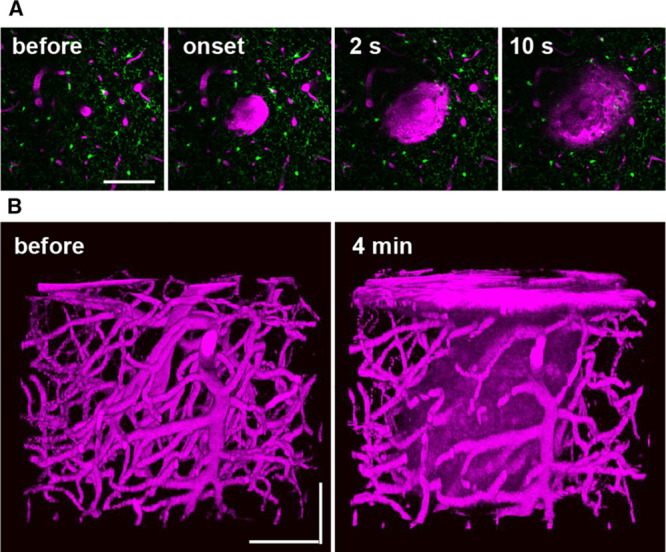
Methods: We used in vivo 2-photon microscopy through a chronic cranial window in adult mice to follow the inflammatory response after a cortical microhemorrhage of ≈100 µm diameter, induced by rupturing a targeted cortical arteriole with a laser.

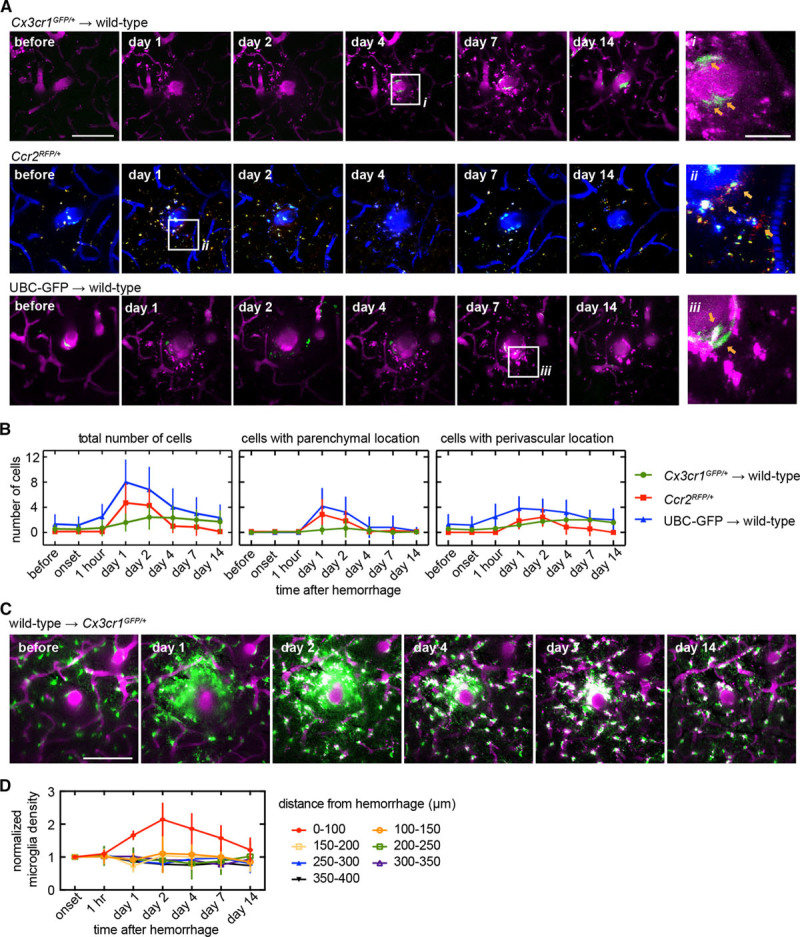
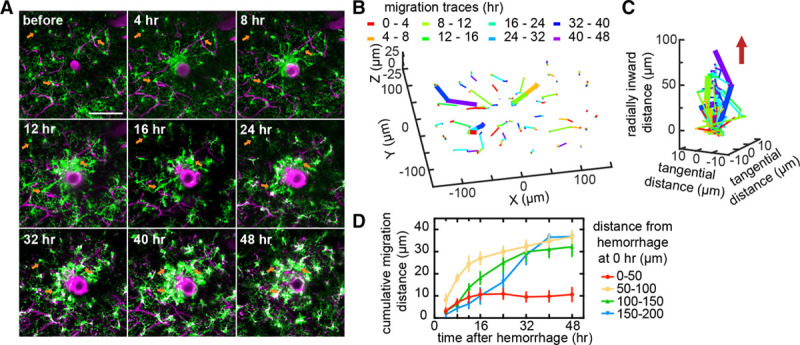
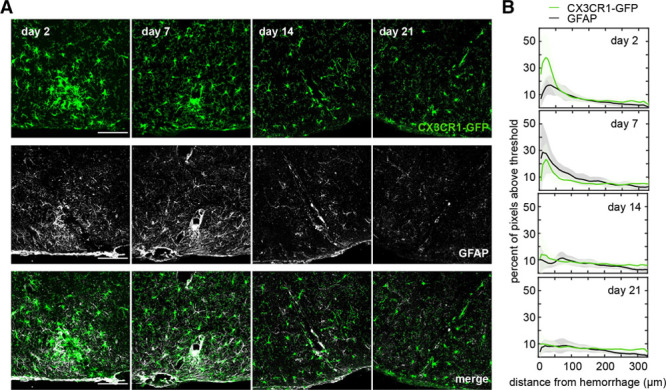
Results: The inflammatory response included the invasion of blood-borne leukocytes, the migration and proliferation of brain-resident microglia, and the activation of astrocytes. Nearly all inflammatory cells responding to the microhemorrhage were brain-resident microglia, but a small number of CX3CR1+ and CCR2+ macrophages, ultimately originating from the invasion of blood-borne monocytes, were also found near the lesion. We found a coordinated pattern of microglia migration and proliferation, where microglia within 200 µm of the microhemorrhage migrated toward the lesion over hours to days. In contrast, microglia proliferation was not observed until ≈40 hours after the lesion and occurred primarily in a shell-shaped region where the migration of microglia decreased their local density. These data suggest that local microglia density changes may trigger proliferation. Astrocytes activated in a similar region as microglia but delayed by a few days. By 2 weeks, this inflammatory response had largely resolved.

Conclusions: Although microhemorrhages are small in size, the brain responds to a single bleed with an inflammatory response that involves brain-resident and blood-derived cells, persists for weeks, and may impact the adjacent brain microenvironment.

Keywords: animal models; inflammation; intracranial hemorrhages; lasers; leukocytes; microglia; optical imaging.


Figures

Figure 1.
Figure 1.
Femtosecond laser-induced cortical microhemorrhages. A, In vivo 2-photon excited fluorescence images of fluorescently-labeled blood plasma (magenta, intravenously injected Texas Red dextran) during creation of a microhemorrhage by ablation of a cortical penetrating arteriole. B, Three-dimensional reconstruction of the vasculature and extravagated plasma before and after the lesion. All scale bars are 100 µm.
Figure 2.
Figure 2.
Invasion of a small number of blood-borne inflammatory cells and an increase in density of brain-resident microglia were observed over a few days near the microhemorrhage. A, Axial projections of 2-photon image stacks showing the response of different genetically-labeled inflammatory cell types for 2 wk after a microhemorrhage. In wild-type animals receiving a Cx3cr1GFP/+ bone marrow transplant (Cx3cr1GFP/+→wild-type), labeled cells are patrolling monocytes (top, green, GFP [green fluorescent protein]). In CCR2RFP/+ animals, labeled cells are inflammatory monocytes (middle, red, RFP [red fluorescent protein]; blue, intravenouslyinjected Cascade Blue dextran). In UBC (ubiquitin-C)-GFP→wild-type animals, all types of circulating cells other than red blood cells are labeled (bottom, green, GFP). Location of insets (on right) are indicated with white boxes. B, Number of cells within the image volume (230×230×40 µm, centered on microhemorrhage) over time for the same genetically-labeled cell populations shown in (A; left). The same data were broken down by cell location perivascular (defined as the cell touching the outside of the vessel; middle) and parenchymal (right) locations (Cx3cr1GFP/+→wild-type: n=12 in 4; CCR2RFP/+: n=6 in 3; UBC→wild-type: n=7 in 2). C, In Cx3cr1GFP/+ animals receiving a wild-type bone marrow transplant (wild-type→Cx3cr1GFP/+), labeled cells are nearly all microglia (green, GFP). Axial projections (40 µm thick) of 2-photon image stacks showing the response of microglia for 2 wk after a microhemorrhage (magenta, intravenously injected Texas Red dextran; green, GFP). D, Plot of normalized density of microglia over time after a microhemorrhage for regions at different distance from the lesion (wild-type→Cx3cr1GFP/+: n=5 hemorrhages from 3 mice). All scale bars are 100 µm, except for the insets in (A), which are 25 µm. Error bars indicate SD.
Figure 3.
Figure 3.
Local increase in microglia density was because of migration of nearby microglia toward the injury. A, Axial projections of 40 µm thick 2-photon image stacks over time after a microhemorrhage in a Cx3cr1GFP/+ mouse. B, Migration paths of the microglia from (A). The color of the segment indicates the time span when that migration occurred. The 3 bold paths correspond to the 3 cells identified with orange arrows in (A). C, Data from (B) plotted with the radial migration toward the lesion from the initial location of each microglia on the z axis. The red arrow indicates the direction of the microhemorrhage. The color of the segment in (B) and (C) indicates the time span when that migration occurred. D, Cumulative radial migration distance toward the microhemorrhage for microglia with different initial distances from the target vessel (n=4 hemorrhages from 3 mice). All scale bars are 100 µm. Error bars indicate SD.
Figure 4.
Figure 4.
Proliferation of microglia was observed in a shell-shaped region surrounding the lesion. A, Axial projections of 40 µm thick 2-photon excited fluorescence image stacks over time after a microhemorrhage in a Cx3cr1GFP/+ mouse. Colored circles indicate cells that will proliferate by the next time point. Arrows with matching colors indicate the pair of daughter cells. Scale bar is 100 µm. The full time series of this particular hemorrhage is shown in Figure IIA in the online-only Data Supplement. B, Images of a coronal histological section that intersected a microhemorrhage from an animal euthanized 2 days after the lesion and with repeated 5-ethynyl-2′-deoxyuridine (EdU) injections. Cells that proliferated over those 2 days are labeled with EdU (white) while microglia are labeled with GFP (green fluorescent protein; green). The white box in the left image indicates the region for the magnified images to the right. C, Composite map of the location of all microglia and EdU+ microglia from coronal sections across 17 hemorrhages from 3 mice, with the location of the microhemorrhage centers aligned at (0, 0). The cortical surface is at the top of the image. D, The probability of microglia being EdU positive as a function of radial distance from the microhemorrhage from the data shown in (C) and a polynomial fit (red trend line). All scale bars are 100 µm.
Figure 5.
Figure 5.
Simulation of microglia density changes because of migration and proliferation after a microhemorrhage. A, Map of the density of microglia including only migration and not proliferation in the simulation (top), of microglia committed to division (middle), and of total microglia density (bottom) at baseline and at 24 and 48 hours after the microhemorrhage. B, Plot of normalized density of microglia as a function of distance from a microhemorrhage at 24 (top) and 48 (middle) hours after the injury for the simulation showing the density including migration and proliferation (blue) or just migration (green). The lower plot shows experimental in vivo measurements at 24 (red) and 48 (black) hours after the lesion (same data as shown in Figure 3B; n=5 hemorrhages from 3 mice). Lines (shading) indicate mean (SD). C, Map of the total density of microglia (left) and of the density of microglia committed to division (right) at 48 hours after a microhemorrhage using models where microglia proliferation occurs when the domain volume of a microglia increases by >50% percentage. D, The fraction of microglia that have either committed to divide or are daughter cells of a proliferation event as a function of distance from and at 48 hours after the microhemorrhage for different density-dependent microglia proliferation models. The dashed line represents the fraction of microglia that were found to be 5-ethynyl-2’-deoxyuridine positive in experiments (same data as in Figure 4D). Scale bars are 200 µm.
Figure 6.
Figure 6.
Astrocyte activation was observed in the region of microglia density increase but peaked at later times. A, Images of coronal histological section that intersected a microhemorrhage from animals euthanized 2, 7, 12, and 21 days after the lesion. Microglia were visualized by the expression of CX3CR1-GFP (green fluorescent protein; top), astrocytes were visualized by immunolabeling of GFAP (glial fibrillary acidic protein; middle). The bottom shows an overlay. Cortical surface is to the bottom of the images. B, The percent of image pixels above a threshold as a function of distance away from the lesion and over time for microglia and astrocytes. Data represent the average of 6 to 9 hemorrhages across 2 to 3 mice for each time point. Scale bars are 100 µm.

References

    1. Ungvari Z, Tarantini S, Kirkpatrick AC, Csiszar A, Prodan CI. Cerebral microhemorrhages: mechanisms, consequences, and prevention. Am J Physiol Heart Circ Physiol. 2017;312:H1128–H1143. doi: 10.1152/ajpheart.00780.2016. - PMC - PubMed
    1. Wiegman AF, Meier IB, Schupf N, Manly JJ, Guzman VA, Narkhede A, et al. Cerebral microbleeds in a multiethnic elderly community: demographic and clinical correlates. J Neurol Sci. 2014;345:125–130. doi: 10.1016/j.jns.2014.07.024. - PMC - PubMed
    1. Wakisaka Y, Chu Y, Miller JD, Rosenberg GA, Heistad DD. Spontaneous intracerebral hemorrhage during acute and chronic hypertension in mice. J Cereb Blood Flow Metab. 2010;30:56–69. doi: 10.1038/jcbfm.2009.183. - PMC - PubMed
    1. Vinters HV, Gilbert JJ. Cerebral amyloid angiopathy: incidence and complications in the aging brain. II. The distribution of amyloid vascular changes. Stroke. 1983;14:924–928. - PubMed
    1. Charidimou A, Shakeshaft C, Werring DJ. Cerebral microbleeds on magnetic resonance imaging and anticoagulant-associated intracerebral hemorrhage risk. Front Neurol. 2012;3:133. doi: 10.3389/fneur.2012.00133. - PMC - PubMed

Publication types