. 2018 Jun 12;115(24):E5516-E5525.
doi: 10.1073/pnas.1800077115. Epub 2018 May 29.

Dynamic action potential clamp predicts functional separation in mild familial and severe de novo forms of SCN2A epilepsy

Affiliations

Dynamic action potential clamp predicts functional separation in mild familial and severe de novo forms of SCN2A epilepsy

Géza Berecki et al. Proc Natl Acad Sci U S A. .

Abstract

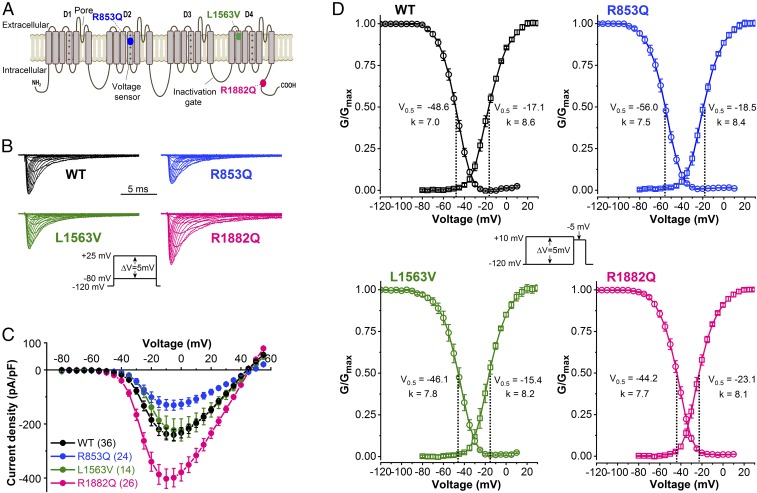
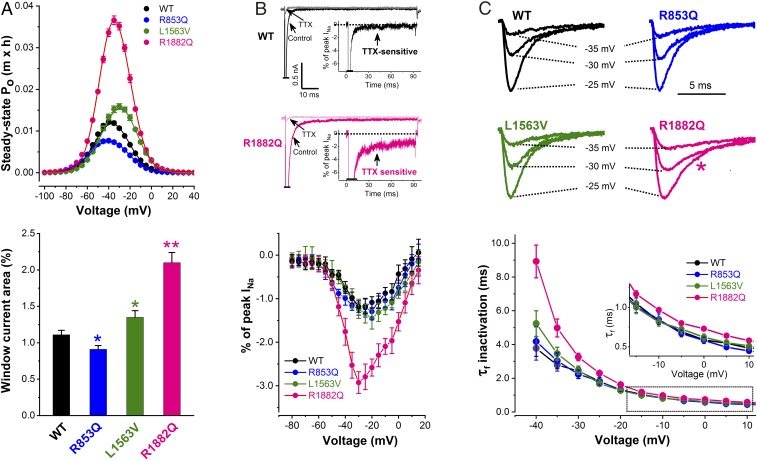
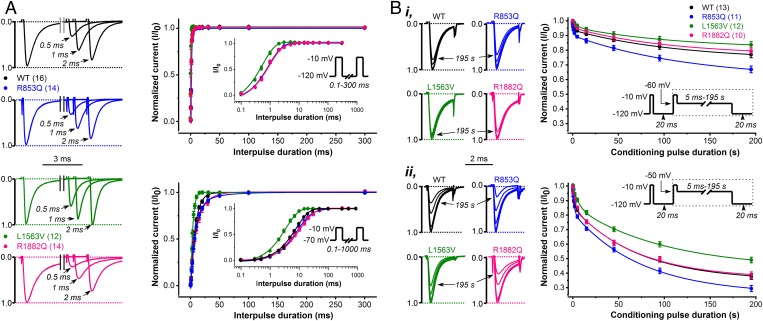
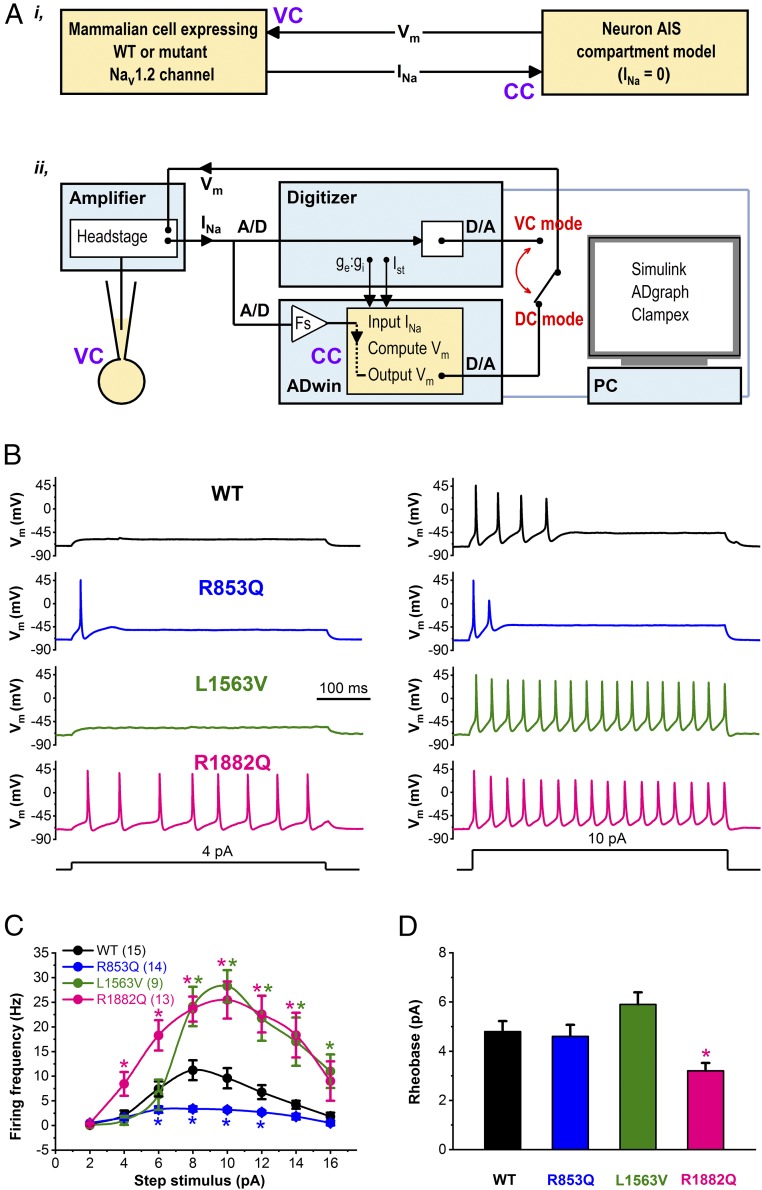
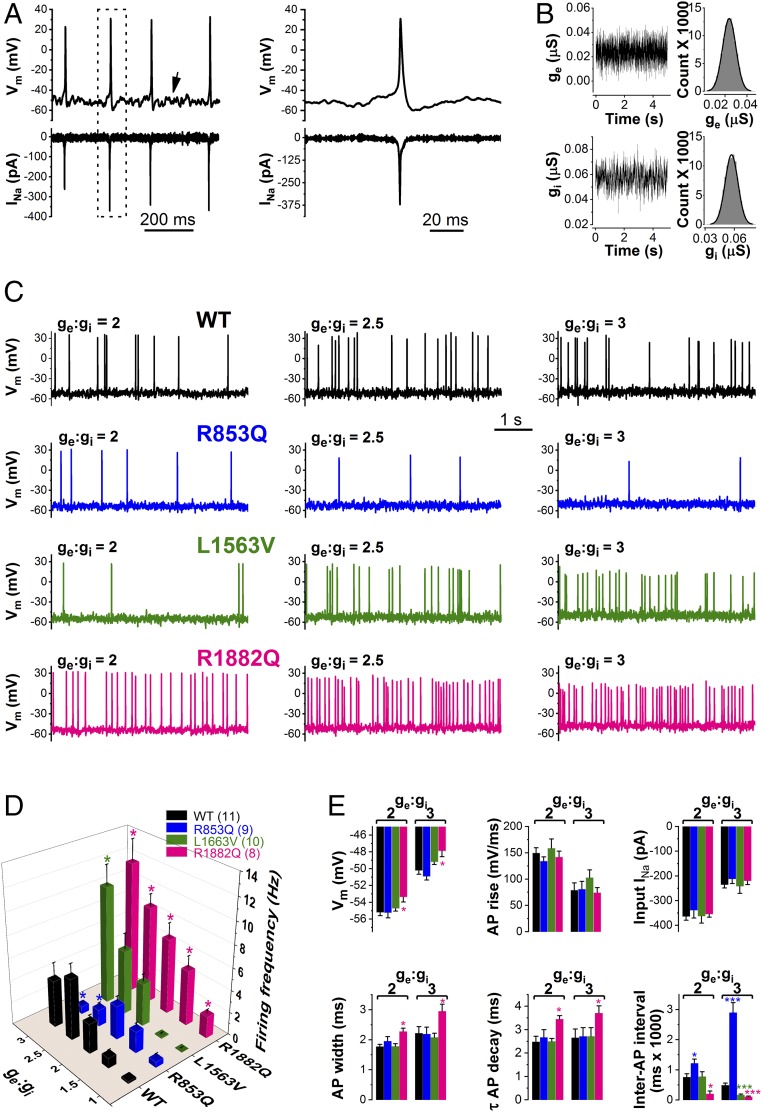
De novo variants in SCN2A developmental and epileptic encephalopathy (DEE) show distinctive genotype-phenotype correlations. The two most recurrent SCN2A variants in DEE, R1882Q and R853Q, are associated with different ages and seizure types at onset. R1882Q presents on day 1 of life with focal seizures, while infantile spasms is the dominant seizure type seen in R853Q cases, presenting at a median age of 8 months. Voltage clamp, which characterizes the functional properties of ion channels, predicted gain-of-function for R1882Q and loss-of-function for R853Q. Dynamic action potential clamp, that we implement here as a method for modeling neurophysiological consequences of a given epilepsy variant, predicted that the R1882Q variant would cause a dramatic increase in firing, whereas the R853Q variant would cause a marked reduction in action potential firing. Dynamic clamp was also able to functionally separate the L1563V variant, seen in benign familial neonatal-infantile seizures from R1882Q, seen in DEE, suggesting a diagnostic potential for this type of analysis. Overall, the study shows a strong correlation between clinical phenotype, SCN2A genotype, and functional modeling. Dynamic clamp is well positioned to impact our understanding of pathomechanisms and for development of disease mechanism-targeted therapies in genetic epilepsy.

Keywords: de novo SCN2A mutation; dynamic action potential clamp; epilepsy; modeling; voltage clamp.


Conflict of interest statement

Conflict of interest statement: G.B. is funded by RogCon, Inc., Miami, Florida, a biotechnology company focused on drug research, discovery, and development for select ion channelopathies, including SCN2A. I.E.S. has served on scientific advisory boards for UCB, Eisai, GlaxoSmithKline, Biomarin, and Nutricia; editorial boards of the Annals of Neurology, Neurology and Epileptic Disorders; may accrue future revenue on pending patent WO61/010176 (filed: 2008): Therapeutic Compound; has received speaker honoraria from GlaxoSmithKline, Athena Diagnostics, UCB, Eisai, and Transgenomics; has received funding for travel from Athena Diagnostics, UCB, Biocodex, GlaxoSmithKline, Biomarin, and Eisai; and receives/has received research support from the National Health and Medical Research Council of Australia, National Institutes of Health, Australian Research Council, Health Research Council of New Zealand, CURE, The American Epilepsy Society, the US Department of Defense Autism Spectrum Disorder Research Program, March of Dimes, and Perpetual Charitable Trustees. S.P. is cofounder, Chief Scientific Officer, and equity holder of RogCon, Inc., Miami, Florida, a biotech company focused on the delivery of novel therapeutics for SCN2A disorders. RogCon, Inc. provided funding for this project. S.P. is also cofounder and equity holder in Praxis Precision Medicines, Inc., Cambridge, Massachusetts, which develops precision medicines for neurogenetic disorders, including those caused by SCN2A mutations. S.P. is a Scientific Advisor and equity holder in Pairnomix, Inc., Minneaopolis, Minnisota, which is undertaking precision medicine development in epilepsy and related disorders.

Figures

Fig. 1.
Fig. 1.
Location of Nav1.2 mutations and biophysical properties of wild-type (WT), R853Q, L1563V, and R1882Q channels. (A) Predicted transmembrane topology of Nav1.2 channels denoting the R853Q and R1882Q mutations associated with later-onset and early-onset DEE respectively, and the L1563V mutation associated with BFNIS. Domains D1−D4 are indicated; note the positive charges on the voltage sensor (fourth segment) of each domain. (B) Representative wild-type and mutant INa traces, elicited by 20-ms depolarizing voltage steps of 5-mV increment from a HP of −120 mV (Inset voltage protocol). (C) Current–voltage relationships. (D) Voltage dependence of activation (squares) and inactivation (circles). The normalized conductance–voltage relationships are plotted as G/Gmax values versus voltage and are referred to as “activation” curves. Curves were obtained by nonlinear least-squares fits of Boltzmann equations (Materials and Methods). Values of fitted parameters are indicated below each curve and summarized in Table 2. Activation was assessed using the voltage protocol described in B. Inactivation was determined from a HP of −120 mV using 100-ms conditioning steps ranging from −120 to +10 mV followed by 20-ms test pulses to −5 mV (Inset), at 0.1 Hz. The number of experiments, n, are shown in Table 2.
Fig. 2.
Fig. 2.
Mechanisms contributing to sodium channel dysfunction in R853Q, L1563V, and R1882Q channels. (A) Voltage dependence of the steady-state open probability (Po) (Upper). The m × h product was calculated for every cell using the individual G/Gmax values described in Fig. 1D, and plotted against the Vm. (Lower) Mean percentages of window current relative to total current in wild-type (WT) and mutant Nav1.2 channels. Data are represented as mean ± SEM (n, same as in Fig. 1D) (see data with statistics in Table 2). *P < 0.05, **P < 0.01. (B) Demonstration of persistent inward INa. (Upper) Sensitivity of persistent inward INa to tetrodotoxin (TTX). Peak currents are off scale. Insets show TTX sensitive current as percentage of peak INa, obtained by subtraction. (Lower) Mean current–voltage relationships of persistent INa expressed as percentage of peak INa for wild-type (n = 30), R853Q (n = 21), L1563V (n = 14), and R1882Q (n = 25). Dotted lines indicate zero current level. (C) Typical wild-type and mutant INa traces elicited at −25, −30, and −35 mV (Upper). Note the slower inactivation time course of R1882Q INa vs. wild-type (pink star). (Lower) Average fast time constants (τf) of INa inactivation plotted against test potential. (Inset) Boxed τf values on an expanded scale. R1882Q channels show larger τf values versus wild-type (see data with statistics in Table 2).
Fig. 3.
Fig. 3.
Recovery from inactivation and development of slow inactivation in CHO cells expressing WT, R853Q, L1563V, or R1882Q Nav1.2 channels. (A) Accelerated recovery of L1563V channels versus wild-type revealed with paired-pulse protocols of HP values of −120 or −70 mV, respectively. (Left) Representative P1 (control)- and P2-elicited traces elicited from a HP of −120 mV and using recovery interpulse intervals of 0.5, 1, and 2 ms. Plots (Right) show normalized wild-type and mutant peak INa as a function of interpulse duration. Note the effect of HP (Upper: −120 mV; Lower: −70 mV) on the time course of INa recovery. (Insets) Voltage protocols. (B) Enhanced slow inactivation for R853Q and reduced slow inactivation for L1563V versus wild-type channels. The extent of slow inactivation is indicated by the fractional reduction in peak INa during the 2-ms test pulse (P2) relative to that recorded in the first 2-ms prepulse (P1). At any P2, the fraction that enters slow inactivation equals 1 – P2/P1. (Insets) Voltage protocols with boxed areas representing the repeated voltage motif, including the time intervals of increasing duration. Note the effect of Vm on slow inactivation, −60 mV (i) versus −50 mV (ii), respectively. See data with statistics in Table 2.
Fig. 4.
Fig. 4.
Dynamic action potential-clamp experiment implementing WT, R853Q, L1563V, or R1882Q INa. (A, i) Schematic representation of the dynamic clamp technique used to effectively replace the in silico INa of the virtual AIS compartment model with INa expressed in a mammalian (CHO) cell. (ii) In dynamic clamp (DC) mode, INa is recorded from a CHO cell, digitized (A/D), scaled (Fs), and continuously applied to the virtual (model) cell as an external current input. The model cell is in current clamp (CC) mode and its Vm is computed in real-time by the PC-controlled ADwin system. The computed Vm is converted into an analog signal (D/A), sent back to the amplifier, and applied as a voltage clamp (VC) command to the CHO cell. Action potential firing in the model cell is triggered either by step stimulus currents (Ist) or synaptic current (ge:gi). The set-up enables switching between dynamic clamp and conventional voltage clamp modes. (B) Dynamic action potential-clamp experiments reveal Nav1.2 channel gain-of-function or loss-of-function. Action potential firing with model cell incorporating wild-type, R853Q, L1563V, or R1882Q INa in response to increasing Ist, in the range between 0 and 16 pA, in 2-pA increments. Representative Vm changes elicited by 4- or 10-pA step currents are shown. (C) Input−output showing the Ist dependence of action potential firing. Data are mean ± SEM; n, number of experiments between parentheses; Note the altered action potential firing of the model cell in the presence of mutant INa compared with wild-type (*P < 0.05). (D) Rheobase (*P < 0.05, compared with wild-type); n, same as in C.
Fig. 5.
Fig. 5.
Firing of the model cell incorporating WT, R853Q, L1563V, or R1882Q INa in response to synaptic conductance input. (A) Typical firing responses of the AIS model cell incorporating wild-type INa. The Vm changes (upward deflections) and associated scaled input INa (downward deflections) are shown. Note the Vm fluctuations typical for these types of experiments (arrow). (Right) Boxed action potential and INa on an expanded timescale. (B) Time course and magnitude of ge (Upper) and gi (Lower), respectively, with an excitatory and inhibitory (ge:gi) ratio value of 2. Inset histograms define mean ge and gi values of 0.0238 pA and 0.0571 pA, respectively. (C) Firing responses with ge:gi values of 2, 2.5, and 3, respectively. Note the change in firing frequencies because of Nav1.2 channel loss-of-function (R853Q) or gain-of-function (L1563V, R1882Q). (D) Input–output relationships in the model cell as a function of ge:gi; n, number of experiments between parentheses; *P < 0.05, compared with wild-type. (E) Steady-state Vm, action potential (AP) upstroke velocity, input INa amplitude, AP width, time course (τ) of repolarization, and interspiking interval values, respectively, as a function of ge:gi. Data are mean ± SEM; *P < 0.05, ***P < 0.001 compared with wild-type (one-way ANOVA); n, same as in D.

References

    1. Heron SE, et al. Sodium-channel defects in benign familial neonatal-infantile seizures. Lancet. 2002;360:851–852. - PubMed
    1. Howell KB, et al. SCN2A encephalopathy: A major cause of epilepsy of infancy with migrating focal seizures. Neurology. 2015;85:958–966. - PMC - PubMed
    1. Mantegazza M, Curia G, Biagini G, Ragsdale DS, Avoli M. Voltage-gated sodium channels as therapeutic targets in epilepsy and other neurological disorders. Lancet Neurol. 2010;9:413–424. - PubMed
    1. Allen AS, et al. Epi4K Consortium Epilepsy Phenome/Genome Project De novo mutations in epileptic encephalopathies. Nature. 2013;501:217–221. - PMC - PubMed
    1. Carvill GL, et al. Targeted resequencing in epileptic encephalopathies identifies de novo mutations in CHD2 and SYNGAP1. Nat Genet. 2013;45:825–830. - PMC - PubMed

Publication types

Substances