. 2018 Jun 12;115(24):6117-6122.
doi: 10.1073/pnas.1801672115. Epub 2018 May 29.

MINFLUX monitors rapid molecular jumps with superior spatiotemporal resolution

Affiliations

MINFLUX monitors rapid molecular jumps with superior spatiotemporal resolution

Yvan Eilers et al. Proc Natl Acad Sci U S A. .

Abstract

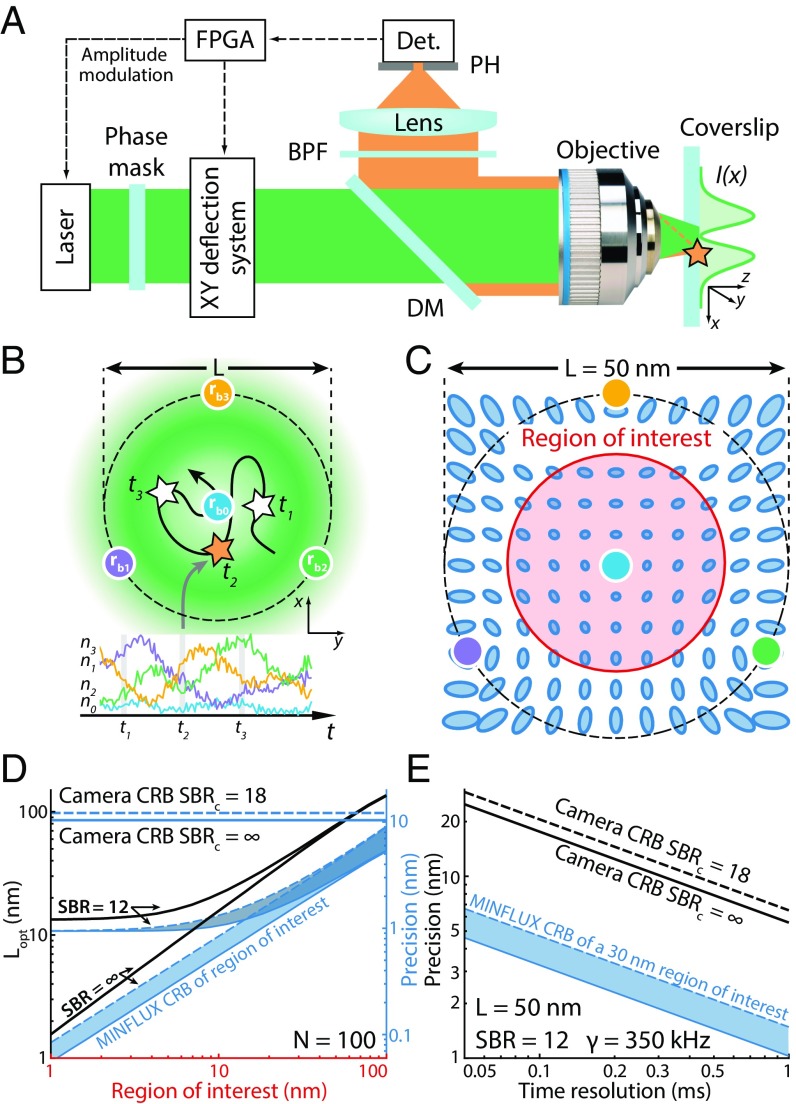
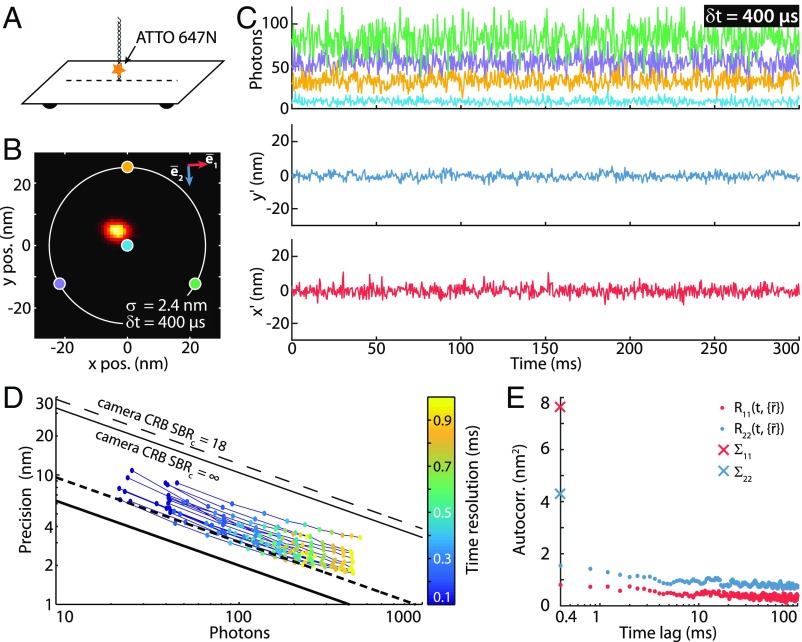
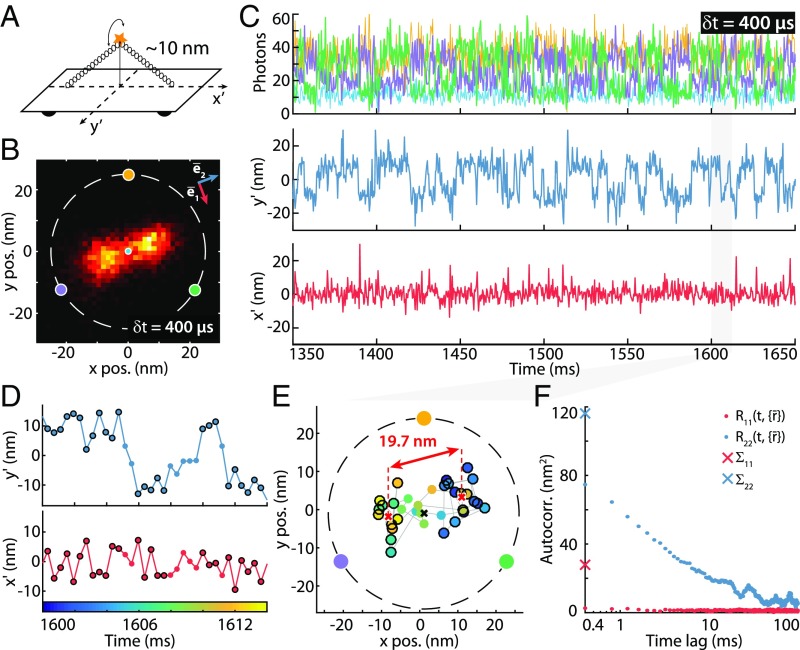
Compared with localization schemes solely based on evaluating patterns of molecular emission, the recently introduced single-molecule localization concept called MINFLUX and the fluorescence nanoscopies derived from it require up to orders of magnitude fewer emissions to attain single-digit nanometer resolution. Here, we demonstrate that the lower number of required fluorescence photons enables MINFLUX to detect molecular movements of a few nanometers at a temporal sampling of well below 1 millisecond. Using fluorophores attached to thermally fluctuating DNA strands as model systems, we demonstrate that measurement times as short as 400 microseconds suffice to localize fluorescent molecules with ∼2-nm precision. Such performance is out of reach for popular camera-based localization by centroid calculation of emission diffraction patterns. Since theoretical limits have not been reached, our results show that emerging MINFLUX nanoscopy bears great potential for dissecting the motions of individual (macro)molecules at hitherto-unattained combinations of spatial and temporal resolution.

Keywords: MINFLUX; localization; single molecule; tracking.


Conflict of interest statement

Conflict of interest statement: The Max Planck Society holds patents on selected embodiments and procedures of MINFLUX, benefitting S.W.H., F.B., K.C.G., and Y.E.

Figures

Fig. 1.
Fig. 1.
MINFLUX probes the position of an emitter with light distributions featuring intensity zeros that are targeted to defined coordinates in sample space. (A) Schematic of the MINFLUX setup used here. A laser beam is structured by a phase mask to obtain a doughnut-shaped excitation profile I(r¯) at the focal plane of the objective. The emitter fluorescence is collected in backscattering geometry and separated from the excitation beam by a dichroic mirror (DM). After passing a bandpass filter (BPF), the fluorescence photons are focused onto a confocal pinhole (PH) and counted by a detector (Det.). A field-programmable gate array (FPGA) board controls the deflection system, modulates the beam intensity, and processes the detected photons. (B) (Upper) The intensity zero of the doughnut is targeted in quick succession to coordinates r¯b0,,r¯b3 lying within a circle of diameter L, defining the set of targeted coordinates. (Lower) Example of a collected photon trace (n0,,n3) for a molecule transiting the rapidly retargeted doughnut beams. (C) Visualization of the position-dependent localization uncertainty. The blue ellipses represent the e1/2 contour level of the covariance matrix ΣCRB(r¯) as a quadratic form, for a total of N = 1,000 photons and L=50 nm. The red encircled area defines a region of interest (ROI). (D) Optimal L value Lopt (black) for two SBR values (SBR=,SBRL=50nmr¯=0¯=12) and corresponding MINFLUX CRB σCRB (blue bands, L=Lopt, N = 100 photons) as a function of the diameter of the ROI. A considerable improvement over ideal camera performance is achievable especially for small ROIs. In the presence of background Lopt saturates for small ROI values. (E) Localization precision as a function of time resolution. The MINFLUX CRB σCRB in a 30-nm ROI (blue band, L=50 nm, γ=350 kHz, SBRL=50nmr¯=0¯=12) is compared with ideal camera performance without background (black) and with realistic background contributions (dashed black, SBRc=18).
Fig. 2.
Fig. 2.
Fluorescence time traces of a single molecule and resulting localization precision at high temporal resolution using MINFLUX. (A) Diagram of the DNA origami construct with a single ATTO 647N fluorophore attached closely to a glass surface. Immobilization was achieved by complementarily pairing a ssDNA linked to an ATTO 647N molecule with a second ssDNA that is attached to a rectangular DNA origami (SI Appendix, Sample Preparation). (B) Histogram of 13,625 MINFLUX localizations of a sample with 1 × 1-nm binning. Time resolution, δt=400 µs; localization precision, σMF=2.4 nm; average counts, N=168 photons. The positions of the doughnut zeros are marked as colored dots with a parameter L=50 nm. The e¯2 axis (blue arrow) indicates the direction of maximal emitter movement; the red arrow is perpendicular to it (SI Appendix, Autocorrelation Analysis). (C, Upper) A 300-ms excerpt of the detected photon count trace (time resolution of δt=400 µs per localization). The color coding corresponds to the targeted coordinates shown in B. (C, Lower) Estimated mean-subtracted trajectory {r¯^} (rotated coordinate system: x=r¯^e¯1, y=r¯^e¯2). (D) Colored dots: experimental MINFLUX localization precision σMF as a function of the number of photons for emitters within a ROI of dROI = 30 nm. The color coding indicates the time resolution of the measurement. The MINFLUX CRB at the center of the targeted coordinates set (thick black line), the average CRB at the edge of the ROI (thick dashed line), and the ideal camera CRB (thin black lines) are included. (E) Autocorrelation analysis of the trajectory along the principal axes detailed in B with a time resolution of δt=400 µs. R11(t,{r¯}): along axis e¯1. R22(t,{r¯}): along axis e¯2. Σ11 and Σ22 (crosses) are the variances along these two directions.
Fig. 3.
Fig. 3.
MINFLUX tracking of rapid movements of a custom-designed DNA origami. (A) Diagram of the DNA origami construct with a single ATTO 647N fluorophore attached at the center of the bridge (10 nm from the origami base). By design, the emitter can move on a half-circle above the origami and is thus ideally restricted to a 1D movement. (B) Histogram of 6,118 localizations of the sample in A with δt = 400-µs time resolution and a 1.5 × 1.5-nm binning. The predominant motion is along a single direction (e¯2). (C, Upper) A 300-ms excerpt of the photon count trace (time resolution δt = 400 µs per localization). The color coding corresponds to the zero positions shown in B. (C, Lower) Mean-subtracted trajectory {r¯^} (rotated coordinate system: x'=r¯^e¯1, y'=r¯^e¯2). (D) Excerpt of 14-ms duration of the trace shown in C containing 35 localizations, highlighting the predominant and rather stationary positions (black circles). Transitions between these predominant positions are clearly resolved. (E) Scatter plot of the excerpt shown in D. The color coding of the dots indicates the time (same color bar as in D). The distance of black encircled data points (also marked in D) is displayed. (F) Autocorrelation analysis of the trajectory along the principal axes detailed in B. R22(t,{r¯}): along principal axis e¯2. R11(t,{r¯}): along secondary axis e¯1. Σ11 and Σ22 (crosses) are the variances along these two directions. The estimated SD of the emitter movement along these directions are σmov,111.7 nm and σmov,229.2 nm (with a relaxation half-time of 2.1 ms; SI Appendix, Autocorrelation Analysis).

Comment in

  • Monitoring molecular jumps.
    Strack R. Strack R. Nat Methods. 2018 Aug;15(8):572. doi: 10.1038/s41592-018-0091-2. Nat Methods. 2018. PMID: 30065382 No abstract available.

References

    1. Hell SW, Wichmann J. Breaking the diffraction resolution limit by stimulated emission: Stimulated-emission-depletion fluorescence microscopy. Opt Lett. 1994;19:780–782. - PubMed
    1. Klar TA, Jakobs S, Dyba M, Egner A, Hell SW. Fluorescence microscopy with diffraction resolution barrier broken by stimulated emission. Proc Natl Acad Sci USA. 2000;97:8206–8210. - PMC - PubMed
    1. Betzig E, et al. Imaging intracellular fluorescent proteins at nanometer resolution. Science. 2006;313:1642–1645. - PubMed
    1. Rust MJ, Bates M, Zhuang X. Sub-diffraction-limit imaging by stochastic optical reconstruction microscopy (STORM) Nat Methods. 2006;3:793–795. - PMC - PubMed
    1. Hess ST, Girirajan TPK, Mason MD. Ultra-high resolution imaging by fluorescence photoactivation localization microscopy. Biophys J. 2006;91:4258–4272. - PMC - PubMed