. 2018 May 29;9(1):2113.
doi: 10.1038/s41467-018-04524-x.

Induction of anergic or regulatory tumor-specific CD4+ T cells in the tumor-draining lymph node

Affiliations

Induction of anergic or regulatory tumor-specific CD4+ T cells in the tumor-draining lymph node

Ruby Alonso et al. Nat Commun. .

Abstract

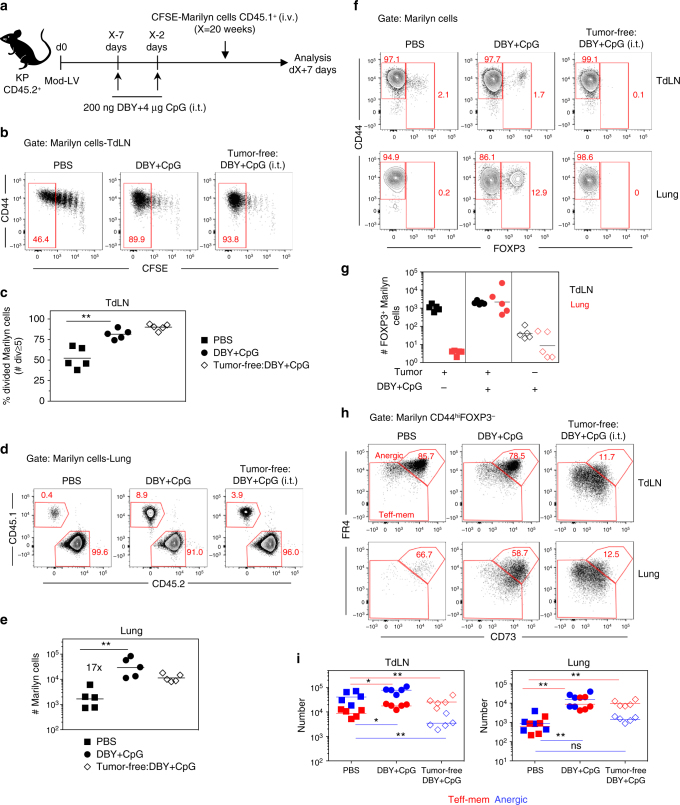
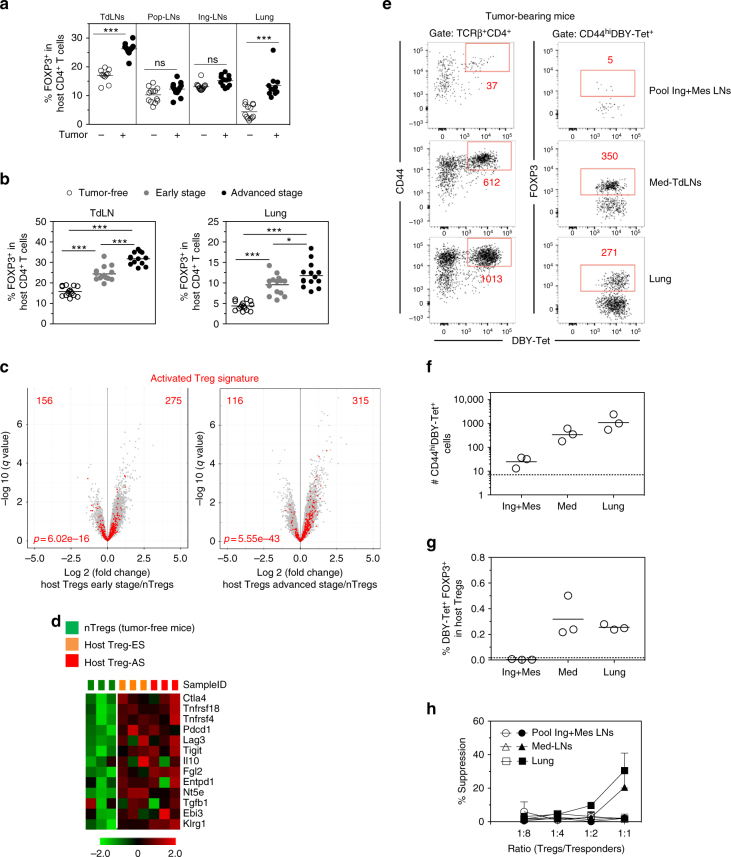
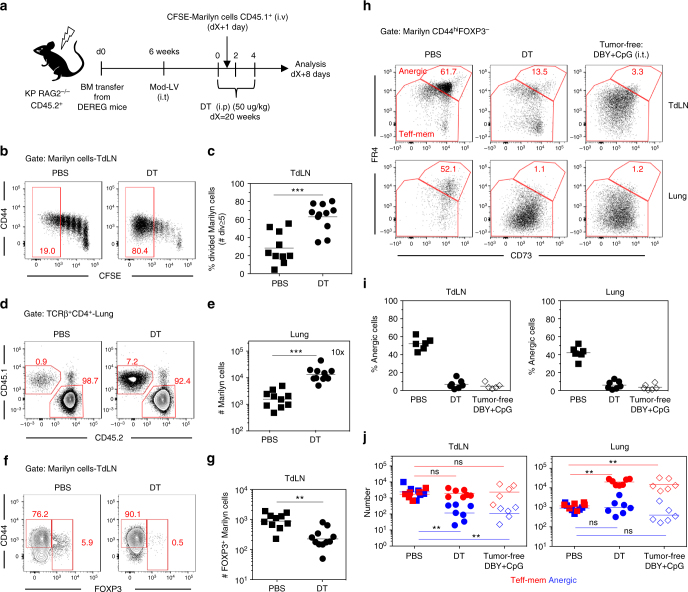
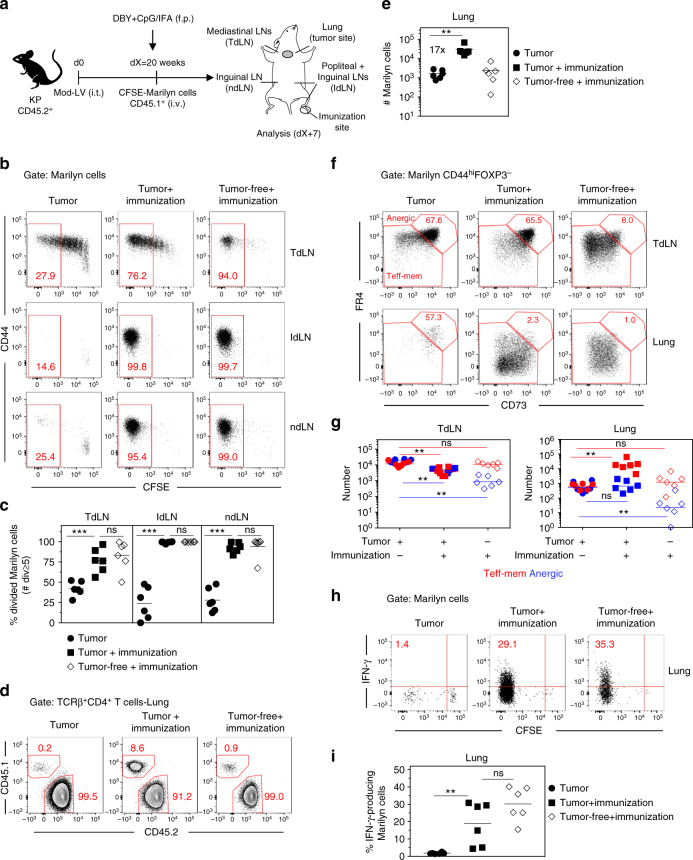
CD4+ T cell antitumor responses have mostly been studied in transplanted tumors expressing secreted model antigens (Ags), while most mutated proteins in human cancers are not secreted. The fate of Ag-specific CD4+ T cells recognizing a cytoplasmic Ag in mice bearing autochthonous tumors is still unclear. Here we show, using a genetically engineered lung adenocarcinoma mouse model, that naive tumor-specific CD4+ T cells are activated and proliferate in the tumor-draining lymph node (TdLN) but do not differentiate into effectors or accumulate in tumors. Instead, these CD4+ T cells are driven toward anergy or peripherally-induced Treg (pTreg) differentiation, from the early stage of tumor development. This bias toward immune suppression is restricted to the TdLN, and is maintained by Tregs enriched in the tumor Ag-specific cell population. Thus, tumors may enforce a dominant inhibition of the anti-tumor CD4 response in the TdLN by recapitulating peripheral self-tolerance mechanisms.


Conflict of interest statement

The authors declare no competing interests.

Figures

Fig. 1
Fig. 1
Priming of tumor Ag-specific naive CD4+ T cells is not sufficient for full activation and migration to tumor site. a CFSE-labeled naive Marilyn cells were transferred into mice bearing ES or AS tumors. Their activation and proliferation were assessed 7 and 14 days after transfer in the TdLN and in the lung. b, c Pattern of proliferation and quantification (frequency of ≥5 divisions). Red gates indicate ≥5 cell divisions. Tumor-free B6 mice receiving 200 ng of DBY+CpG i.t. were used as controls. d Number of recovered Marilyn cells. Dashed line: basal number in the absence of Ag. Pooled data from three independent experiments. ns: non-significant, *p<0.05 Mann–Whitney U test. e Example of IFN-γ-producing Marilyn cell staining according to cell division after ex-vivo restimulation with PMA/Ionomycin for 4 h. f Quantification (frequency). One representative experiment out of three is depicted
Fig. 2
Fig. 2
Activated tumor Ag-specific CD4+ T cells display a Treg phenotype. ac Gene expression profile of FACS-purified total Marilyn cells harvested 7 days after transfer from the TdLN of mice bearing ES or AS tumors. Controls are naive Marilyn cells (Naive) and activated Marilyn cells from tumor-free B6 mice primed with male splenocytes (Male Spl.) injected into the footpad (f.p.) or injected with the Mod-LV i.t. (Mod-LV). a Heat map and hierarchical clustering of the most differentially expressed genes (q = 0.05). The yellow square indicates the tumor-specific cluster. b Gene expression level comparison between Marilyn cells from mice bearing ES or AS tumors (no difference at q = 0.05). c Bubblemap of gene set enrichment analysis of ES vs. LV, or AS vs. LV conditions. NES, Normalized enrichment score, FDR, False discovery rate. d FOXP3 expression by Marilyn cells. e Frequency and number of FOXP3+ Marilyn cells. Representative of one out of three independent experiments. f Volcano plots representing the q value against fold-change gene expression for FACS-purified Marilyn pTregs (FOXP3-GFPpos) vs. polyclonal host nTregs from unmanipulated mice (CD4+CD25hi). Marilyn pTregs were purified from the Med-LNs of tumor-free mice receiving 200 ng of DBY i.t. or mice bearing early or advanced tumors, 7 days after the adoptive transfer of the naive cells. Upregulated or downregulated genes (Fold change>1.5, q < 0.05) are highlighted in red and blue, respectively. g Venn diagram of genes upregulated in Marilyn pTregs
Fig. 3
Fig. 3
Most of activated tumor Ag-specific CD4+ T cells becomes anergic. a CD73 and FR4 expression by CD44hiFOXP3- Marilyn cells in tumor-bearing mice or tumor-free B6 mice inoculated with DBY + CpG (i.t.); b frequency of FR4hiCD73hi (anergic) Marilyn cells. c, d Marilyn cells were harvested 7 days after transfer from TdLNs or lung of mice bearing advanced tumors. Cells were restimulated in vitro with CD3ε-/- female splenocytes pulsed with DBY peptide (10 nM). Controls were tumor-free mice i.t. injected with DBY + CpG. c Representative IFN-γ, IL-2 and IL-10 production by Marilyn cells according to cell division. d Quantification (frequency). e Representative Ki67 expression by anergic and effector cells in tumor-bearing or tumor-free mice. f Quantification (frequency). One representative experiment out of three is shown
Fig. 4
Fig. 4
The persistence of the anergic phenotype requires Ag restimulation in the tumoral context. a FACS sorted CD44hiFOXP3-GFPnegFR4hiCD73hi Marilyn cells from TdLN of mice bearing advanced tumors were transferred into a second cohort of tumor-bearing hosts. b Number of recovered Marilyn cells in the indicated organs (inguinal (Ing) or mesenteric (Mes) LNs, lung, bone-marrow (BM) and spleen) and c, d phenotype of Marilyn cells 15 days after transfer. c Representative dot plots. d Quantification (frequency). e FACS sorted CD44hiFOXP3-GFPnegFR4hiCD73hi Marilyn cells from TdLN of mice bearing advanced tumors were transferred into tumor-free mice left untreated or treated i.t. or f.p. with DBY peptide and CpG. f Number of Marilyn cells 7 days after transfer in Med or poplietal (Pop) dLNs, spleen and lung. g Frequency of Ki67+ cells among Marilyn cells. h Representative CD73 and FR4 plots
Fig. 5
Fig. 5
CpG administration at the tumor site does not restore an effector CD4+ T cell response. a Mice bearing advanced tumors received 4 μg of CpG twice, at 5-day interval, 2 days before Marilyn cell transfer. b Proliferation profile of Marilyn cells in the TdLN of tumor-bearing mice receiving or not CpG. c Frequency of ≥5 times divided Marilyn cells. d Representative plots showing the frequency of Marilyn cells in the lung and e quantification (number). f Representative plots showing the frequency of FOXP3+ Marilyn cells in the TdLN and g quantification (number). h Representative plots of FR4 and CD73 expression on CD44hiFOXP3 Marilyn cells, and i quantification (number of anergic or Teff-mem cells). ns: non-significant, *p<0.05, **p<0.01 Mann–Whitney U test. One representative experiment out of two is depicted
Fig. 6
Fig. 6
Concomitant administration of DBY and CpG at the tumor site reinforces tumor-mediated immunosuppression. a Tumor-bearing mice were i.t. injected twice with DBY peptide (200 ng) and CpG (4 μg) at 5-day interval followed 2 days after by CFSE-labeled naive Marilyn cell transfer. b Pattern of proliferation of Marilyn cells in the TdLN and c quantification (frequency of ≥5 divisions). d Representative plots showing the frequency of Marilyn cells in the lung and e quantification (number). f FOXP3 expression by Marilyn cells and g quantification (number). h Representative FR4 and CD73 expression on CD44hiFOXP3 Marilyn cells and i quantification (number of anergic or Teff-mem cells). ns: non-significant, *p<0.05, **p<0.01 Mann–Whitney U test
Fig. 7
Fig. 7
Host Tregs at the tumor site are enriched in tumor Ag-specific Tregs. a Frequency of host Tregs in the Med-TdLN, tumor non-draining LNs (popliteal = Pop-LNs or inguinal = Ing-LNs) and lung. b Frequency of host Tregs at different stages of tumor growth. ns: non-significant, *p<0.05, **p<0.01, ***p<0.001 unpaired t-test. c, d Transcriptional analysis of FACS-purified host Tregs (CD4+CD25hi) from Med-LNs of tumor-free or tumor-bearing mice. c Volcano plots comparing the q value vs. fold-change for host Tregs from mice bearing ES or AS tumors vs. host nTregs from unmanipulated tumor-free mice. Red dots represent the activated Treg signature. Numbers indicate the upregulated or downregulated genes among the specific signature. The enrichment p value is shown. d Heatmap of genes involved in Treg differentiation and function. e Representative plots of host CD4+ T cells following DBY:I-Ab tetramer (Tet)-based cell enrichment of cell suspensions from mice bearing advanced tumors. Total numbers of activated CD44hiDBY:I-Ab-specific host CD4+ T cells (left) and FOXP3+ among DBY:I-Ab-specific host CD4+ T cells (right) are shown. f Quantification of DBY:I-Ab-specific host CD4+ T cells. Each point represents a pool of 2 mice. g Frequency of DBY:I-Ab-specific FOXP3+ host CD4+ T cells. Dashed lines represent the values obtained in LNs of tumor-free mice. h Suppression assay using purified host Tregs (FOXP3-GFPpos) from tumor-free (open symbols) or tumor-bearing mice (closed symbols). Host Tregs sorted from Med-LNs, Ing-Mes-LNs or lungs were cultured for 3 days with CFSE-labeled naive Marilyn cells (Tresponders) and CD3ε−/− female splenocytes loaded with DBY peptide (2 nM). The graph represents the percent suppression of Marilyn cell proliferation (mean±SEM). One representative experiment out of two is depicted
Fig. 8
Fig. 8
Depletion of host Tregs inhibits Marilyn T cell conversion into Tregs and restores their effector functions. a Irradiated KP RAG2-/- mice (5.5 Gy) were reconstituted with bone marrow from DEREG mice. Once the tumors were established, host Tregs were depleted by administration of 3 doses of DT i.p. at 2-day intervals. CFSE-labeled naive Marilyn cells were transferred 1 day after the first dose of DT and the analysis was performed 7 days later. b Pattern of proliferation of Marilyn cells in the TdLN and c quantification (frequency of ≥5 divisions). d Representative plots showing the frequency of Marilyn cells among the CD4+ T cells in the lung and e quantification (number). f FOXP3 expression by Marilyn cells and g quantification (number). h Representative expression of CD73 and FR4 by CD44hiFOXP3 Marilyn cells and i, j quantification (frequency and number). Pooled data of two independent experiments. ns: non-significant, **p<0.01, ***p<0.001 Mann–Whitney U test
Fig. 9
Fig. 9
Priming of tumor Ag-specific naive CD4+ T cells at distant site from the tumor restores their effector functions. a Tumor-bearing mice having received CFSE-labeled naive Marilyn cells were immunized into the f.p. with DBY peptide (200 ng) and CpG (40 μg) emulsified in IFA or left untreated. Analysis was performed 7 days later. b Pattern of proliferation of Marilyn cells in the TdLN, lymph nodes draining the Ag injection site (IdLN = popliteal + Inguinal-LNs) and ndLN (non-draining LN = Inguinal) and c quantification (frequency of ≥5 divisions). d Representative plots showing accumulation of Marilyn cells in the lung of immunized tumor-bearing mice and e quantification (number). f Representative expression of CD73 and FR4 by CD44hiFOXP3 Marilyn cells and g quantification (number of anergic or Teff-mem cells) h, i Frequency of IFN-γ-producing Marilyn cells in the lung. One representative experiment out of two is depicted. ns: non-significant, **p<0.01, ***p<0.001 Mann–Whitney U test

References

    1. Yarchoan M, Johnson BA, 3rd, Lutz ER, Laheru DA, Jaffee EM. Targeting neoantigens to augment antitumour immunity. Nat. Rev. Cancer. 2017;17:209–222. doi: 10.1038/nrc.2016.154. - DOI - PMC - PubMed
    1. Uhr JW, Pantel K. Controversies in clinical cancer dormancy. Proc. Natl Acad. Sci. USA. 2011;108:12396–12400. doi: 10.1073/pnas.1106613108. - DOI - PMC - PubMed
    1. Bogen B. Peripheral T cell tolerance as a tumor escape mechanism: deletion of CD4+ T cells specific for a monoclonal immunoglobulin idiotype secreted by a plasmacytoma. Eur. J. Immunol. 1996;26:2671–2679. doi: 10.1002/eji.1830261119. - DOI - PubMed
    1. Zou W. Regulatory T cells, tumour immunity and immunotherapy. Nat. Rev. Immunol. 2006;6:295–307. doi: 10.1038/nri1806. - DOI - PubMed
    1. Willimsky G, et al. Immunogenicity of premalignant lesions is the primary cause of general cytotoxic T lymphocyte unresponsiveness. J. Exp. Med. 2008;205:1687–1700. doi: 10.1084/jem.20072016. - DOI - PMC - PubMed

Publication types

Substances