. 2018 May 29;8(1):8308.
doi: 10.1038/s41598-018-26693-x.

Niche-induced extramedullary hematopoiesis in the spleen is regulated by the transcription factor Tlx1

Affiliations

Niche-induced extramedullary hematopoiesis in the spleen is regulated by the transcription factor Tlx1

Akihisa Oda et al. Sci Rep. .

Abstract

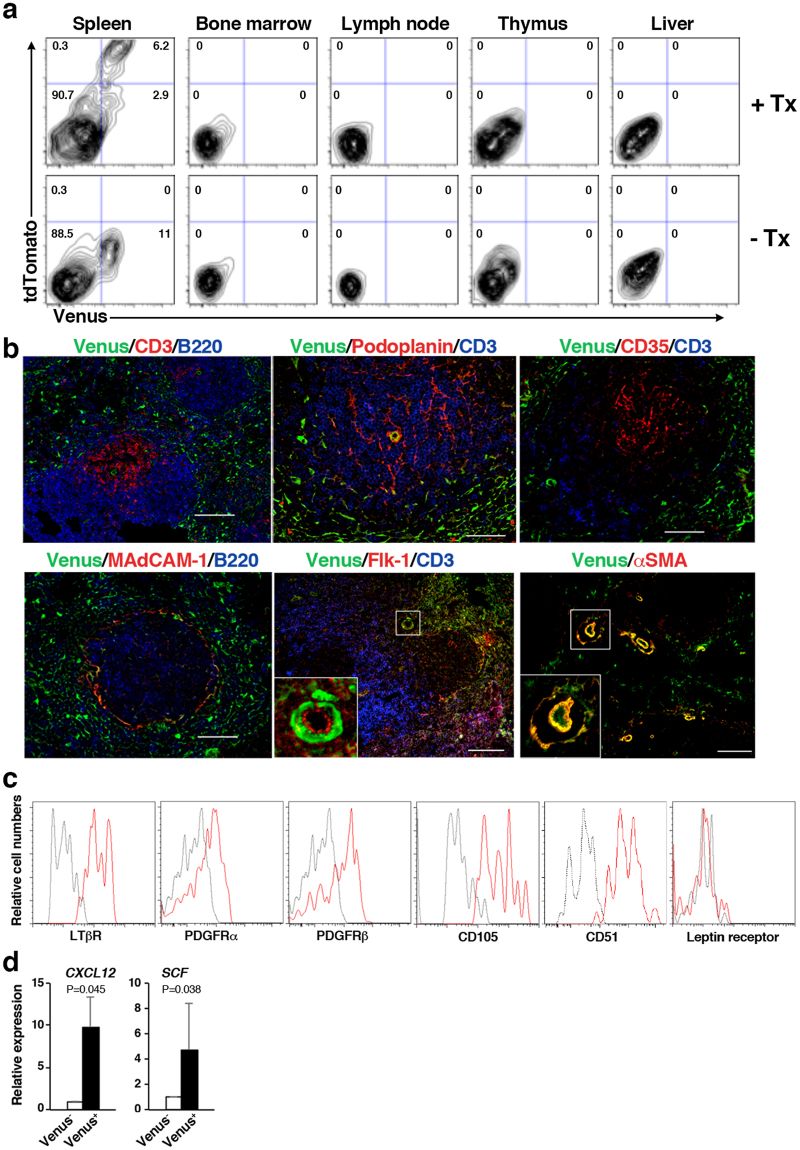
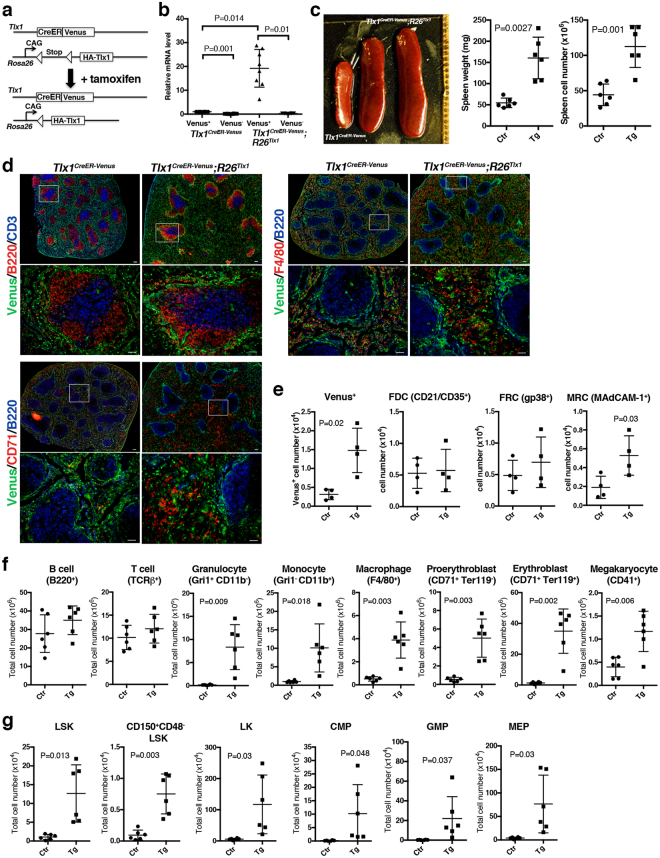
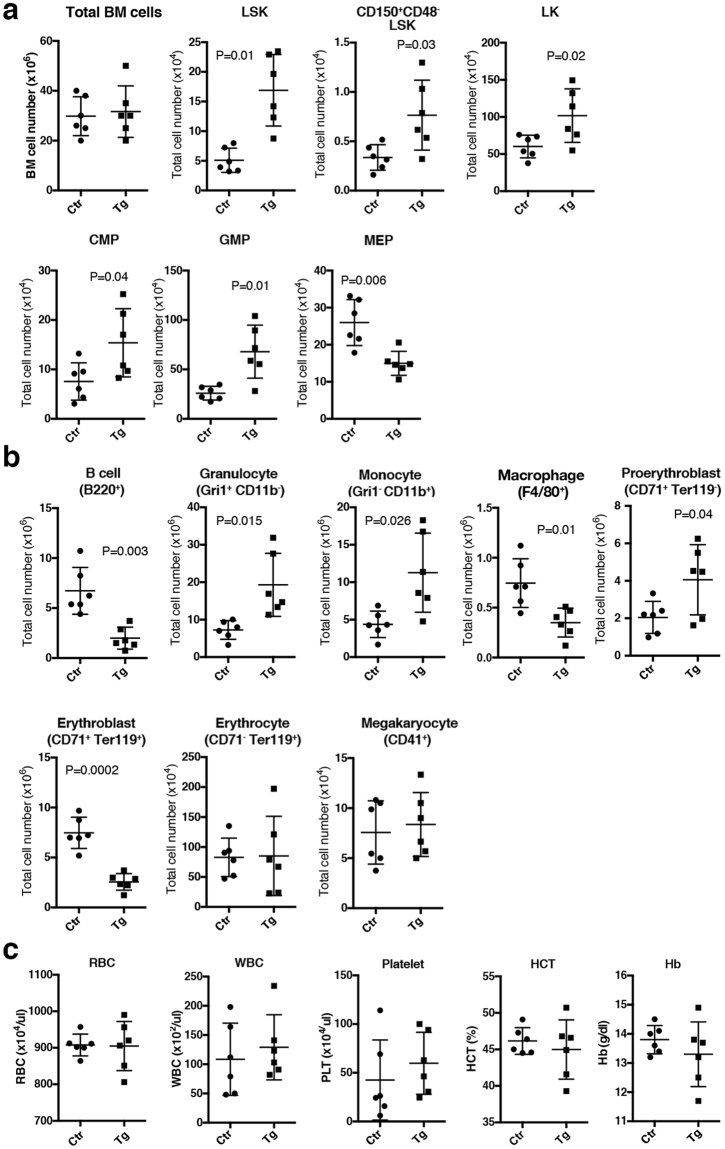
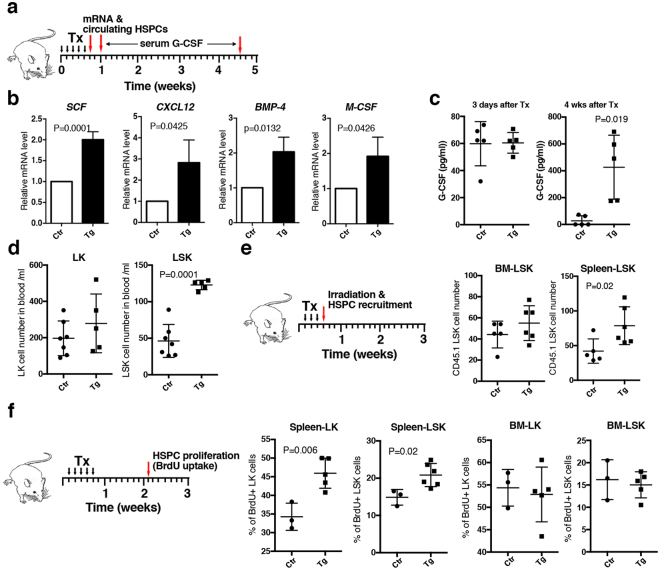
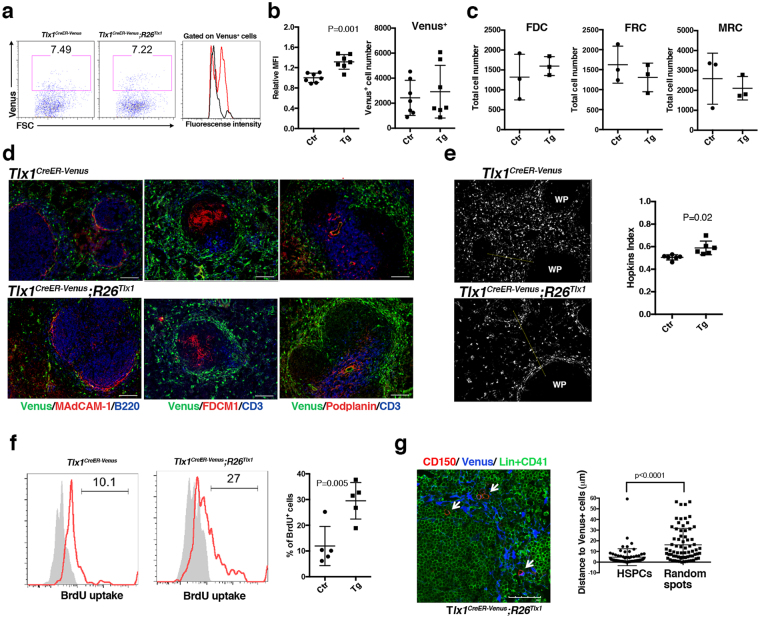
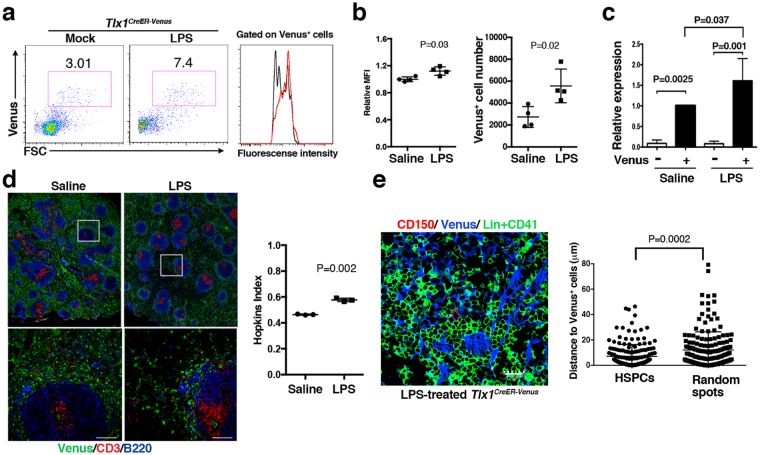
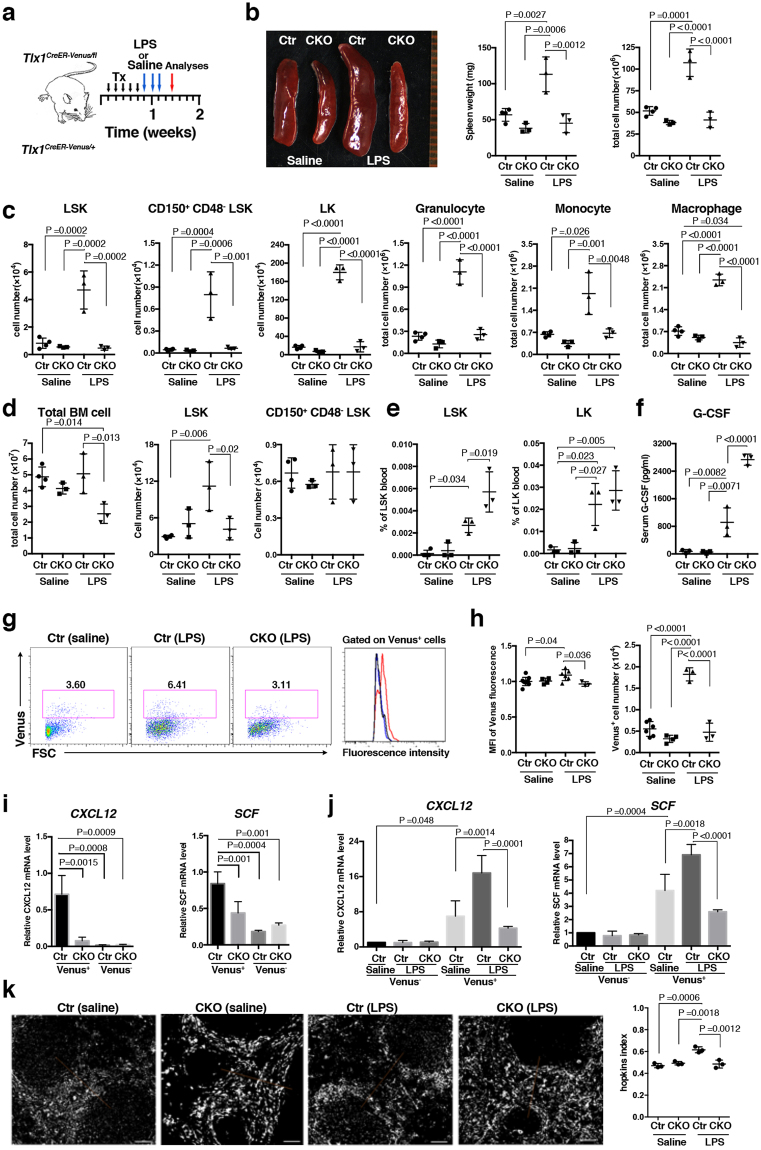
Extramedullary hematopoiesis (EMH) in postnatal life is a pathological process in which the differentiation of hematopoietic stem/progenitor cells (HSPCs) occurs outside the bone marrow (BM) to respond to hematopoietic emergencies. The spleen is a major site for EMH; however, the cellular and molecular nature of the stromal cell components supporting HSPC maintenance, the niche for EMH in the spleen remain poorly understood compared to the growing understanding of the BM niche at the steady-state as well as in emergency hematopoiesis. In the present study, we demonstrate that mesenchymal progenitor-like cells expressing Tlx1, an essential transcription factor for spleen organogenesis, and selectively localized in the perifollicular region of the red pulp of the spleen, are a major source of HSPC niche factors. Consistently, overexpression of Tlx1 in situ induces EMH, which is associated with mobilization of HSPC into the circulation and their recruitment into the spleen where they proliferate and differentiate. The alterations in the splenic microenvironment induced by Tlx1 overexpression in situ phenocopy lipopolysaccharide (LPS)-induced EMH, and the conditional loss of Tlx1 abolished LPS-induced splenic EMH. These findings indicate that activation of Tlx1 expression in the postnatal splenic mesenchymal cells is critical for the development of splenic EMH.


Conflict of interest statement

The authors declare no competing interests.

Figures

Figure 1
Figure 1
Tlx1 selectively marks mesenchymal progenitor-like cells enriched in HSPC niche factors in the postnatal spleen. (a) Representative flow cytometric profiles of CD45 Ter119 CD31 stromal cells in the spleen, BM, lymph node, thymus and liver from Tlx1CreER-Venus; R26tdTomato mice (4-week-old) with (upper panels) or without (lower panels) tamoxifen (Tx) treatment (24 hours after the final treatment). Gates used to identify Venus+ and tdTomato+ cell populations are outlined, and numbers above outlined areas indicate percent events in each gate (mean ± SD, n = 3). Detailed gating strategy is provided in Fig. S1. (b) Representative tissue section images of Venus+ cells in the spleen of 4-week-old Tlx1CreER-Venus mice. Tissue sections were stained with the indicated antibody combinations. Inserted rectangles represent a higher magnification image. Scale bars indicate 100 μm. (n = 3). (c) Representative flow cytometric histograms showing surface marker expression on tdTomato+ cells of the spleen from Tlx1CreER-Venus; R26tdTomato mice treated with tamoxifen, as in (a). (n = 3). (d) Expression of CXCL12 and SCF mRNA in Venus+ cells among CD45Ter119 stromal cells from the spleen of Tlx1CreER mice. (mean ± SD, n = 3). Data were normalized to β-actin and the level of mRNA transcripts in Venus cells was arbitrarily set to 1.
Figure 2
Figure 2
Overexpression of Tlx1 in situ in the spleen induces EMH. (a) Schematic presentation of experimental strategy to overexpress Tlx1 in Tlx1+ cells. Tlx1CreER-Venus littermate controls and Tlx1CreER-Venus; R26Tlx1 mice (4-week-old) were treated with tamoxifen, and analyzed 24 hours (b) and 8 weeks after the final treatment (cg). Data were pooled from 2–4 independent experiments. (b) Expression levels of the sum of exogenous Tlx1 transgene and endogenous Tlx1 mRNA in the Venus+ cells or Venus cells gated on CD45 Ter119 CD31 stromal cells from the spleen of Tlx1 CreER-Venus controls (Ctr) and Tlx1CreER-Venus; R26Tlx1 mice (Tg) with tamoxifen treatment. Data were normalized to β-actin and the level of mRNA transcripts in Venus+ cells of Tlx1CreER-Venus controls was arbitrarily set to 1. (mean ± SD, n = 8). (c) Gross appearance (left), the weight (middle) and cell numbers (right) of the spleen from tamoxifen-treated Tlx1CreER-Venus; R26Tlx1 mice (Tg), compared to the spleen from tamoxifen-treated Tlx1CreER-Venus littermates (Ctr). (mean ± SD, n = 7). (d) Immunohistochemical analysis of the spleen from tamoxifen-treated Tlx1CreER-Venus controls and Tlx1CreER-Venus; R26Tlx1 mice. Tissue sections were stained with the indicated antibody combinations. Lower magnification images are indicated by an inserted rectangle in the upper images. Scale bars indicate 100 μm (upper) and 50 μm (lower). (n = 3). (e) Total cell numbers of the indicated stromal cell populations from the spleen of tamoxifen-treated Tlx1CreER-Venus controls (Ctr) and Tlx1CreER-Venus; R26Tlx1 mice (Tg). (mean ± SD; n = 4). (f) Total numbers of the indicated mature hematopoietic cell populations from the spleen of tamoxifen-treated Tlx1CreER-Venus controls (Ctr) and tamoxifen-treated Tlx1CreER-Venus; R26Tlx1 mice (Tg). (mean ± SD; n = 6). (g) Total numbers of the indicated hematopoietic stem/progenitor cell populations from the spleen of tamoxifen-treated Tlx1CreER-Venus controls (Ctr) and tamoxifen-treated Tlx1CreER-Venus; R26Tlx1 mice (Tg). (mean ± SD; n = 6).
Figure 3
Figure 3
Effect of Tlx1 overexpression in situ in the spleen on BM hematopoiesis. Tlx1CreER-Venus littermate controls and Tlx1CreER-Venus; R26Tlx1 mice (4-week-old) were treated with tamoxifen and hematopoietic cell populations in the BM and the peripheral blood were analyzed 8 weeks after the final treatment. Data were pooled from 4 independent experiments. (a) Total numbers of the indicated hematopoietic stem/progenitor cell populations in the BM of tamoxifen-treated Tlx1CreER-Venus controls (Ctr) and tamoxifen-treated Tlx1CreER-Venus; R26Tlx1 mice (Tg). (mean ± SD; n = 6). (b) Total numbers of the indicated mature hematopoietic cell populations in the BM of tamoxifen-treated Tlx1CreER-Venus controls (Ctr) and tamoxifen-treated Tlx1CreER-Venus; R26Tlx1 mice (Tg). (mean ± SD; n = 6). (c) Hematological indices of peripheral blood of tamoxifen-treated Tlx1CreER-Venus controls (Ctr) and tamoxifen-treated Tlx1CreER-Venus; R26Tlx1 mice (Tg). RBC indicates red blood cell count; WBC, white blood cell count; Platelets, platelet cell count; HCT, hematocrit; Hb, hemoglobin. (mean ± SD; n = 6).
Figure 4
Figure 4
Early phase effects of Tlx1 overexpression in situ in the spleen on hematopoietic factor expression and behavior of HSPCs. (a) Schematic of the experimental strategy represents time points of the analyses for hematopoietic factor mRNA and serum G-CSF as well as peripheral blood HSPCs. Data were pooled from 2–3 independent experiments. (b) Expression of the indicated hematopoietic factor mRNA in Venus+ cells of the spleen from tamoxifen-treated Tlx1CreER-Venus controls (Ctr) and tamoxifen-treated Tlx1CreER-Venus; R26Tlx1 mice (Tg). (mean ± SD, n = 3). The relative mRNA levels were normalized to β-actin and the level of mRNA transcripts in Venus+ cells of tamoxifen-treated Tlx1CreER-Venus controls was arbitrarily set to 1. (c) Serum G-CSF concentration of tamoxifen-treated Tlx1CreER-Venus controls (Ctr) and tamoxifen-treated Tlx1CreER-Venus; R26Tlx1 mice (Tg). (mean ± SD, n = 5). (d) Total numbers of the indicated HSPC populations in the peripheral blood of tamoxifen-treated Tlx1CreER-Venus controls (Ctr) and tamoxifen-treated Tlx1CreER-Venus; R26Tlx1 mice (Tg). (mean ± SD, n = 5–7). (e) Total cell numbers of transplanted CD45.1 LSK cells in the spleen and BM of tamoxifen-treated Tlx1CreER-Venus controls (Ctr) and tamoxifen-treated Tlx1CreER-Venus; R26Tlx1 mice (Tg). (mean ± SD, n = 5–6). (f) The frequency of BrdU-incorporated LSK and LK cells in the spleen and BM of tamoxifen-treated Tlx1CreER-Venus littermate controls (Ctr) and tamoxifen-treated Tlx1CreER-Venus; R26Tlx1 mice (Tg). (mean ± SD, n = 3–5).
Figure 5
Figure 5
Tlx1-expressing cells function as a HSPC niche for EMH in the spleen. Tlx1CreER-Venus littermate controls and Tlx1CreER-Venus; R26Tlx1 mice (4-week-old) were treated with tamoxifen and stromal cell populations in the spleen were analyzed 24 hours after the final treatment. Data were pooled from 2–4 independent experiments. (a) Representative flow cytometric profiles of CD45 Ter119 CD31 stromal cells from the spleen of tamoxifen-treated Tlx1CreER-Venus controls (left) and Tlx1CreER-Venus; R26Tlx1 mice (middle). Gates used to identify Venus+ cell population are outlined, and numbers above the outlined areas indicate percent events in each gate. A histogram (right) represents the intensity of Venus fluorescence of Venus+ cells from tamoxifen-treated Tlx1CreER-Venus controls (black line) and Tlx1CreER-Venus; R26Tlx1 mice (red line). (b) Graphs represent the MFI of Venus fluorescence and the numbers of Venus+ cells from the spleen of tamoxifen-treated Tlx1CreER-Venus littermate controls (Ctr) and tamoxifen-treated Tlx1CreER-Venus; R26Tlx1 mice (Tg). The relative MFI of Venus+ cells in tamoxifen-treated Tlx1CreER-Venus controls was arbitrarily set to 1. (mean ± SD; n = 7). (c) Total numbers of the indicated stromal cell populations from the spleen of tamoxifen-treated Tlx1CreER-Venus controls (Ctr) and tamoxifen-treated Tlx1CreER-Venus; R26Tlx1 mice (Tg). (mean ± SD; n = 3). (d) Immunohistochemical analysis of the spleen of tamoxifen-treated Tlx1CreRE-Venus littermate controls and Tlx1CreER-Venus; R26Tlx1 mice. Tissue sections were stained with the indicated antibody combinations. Scale bars indicate 100 μm. (n = 3). (e) Clustering analysis of Venus+ cells in the spleen upon Tlx1 overexpression. Representative digital images of Venus+ cells (white dots) in the spleen sections from the indicated mice. WP, the white pulp area. The right graph represents the Hopkins index of Venus+ cells in the spleen of tamoxifen-treated Tlx1CrER-Venus controls (Ctr) and Tlx1CreER-Venus; R26Tlx1 mice (Tg). (n = 6). (f) BrdU incorporation analysis of Venus+ cells upon Tlx1 overexpression. Representative flow cytometric histograms of Venus+ cells of the indicated mice stained with anti-BrdU antibody (red line) and isotype control antibody (shaded line). The right graph represents the percentage of BrdU+ cells among total Venus+ cells in the spleen of tamoxifen-treated Tlx1CreER-Venus controls (Ctr) and Tlx1CreER-Venus; R26Tlx1 mice (Tg). (mean ± SD, n = 5). (g) Distance of Venus+ cells from CD150+CD41Lin HSPCs. Tissue sections of the spleen from tamoxifen-treated Tlx1CreER-Venus; R26Tlx1 mice were stained with the indicated antibody combinations. White arrows indicate HSPCs. The right graph represents the distance of Venus+ cells from CD150+CD41Lin HSPCs or randomly generated spots. (n = 93 from 3 mice).
Figure 6
Figure 6
Alterations in Tlx1-expressing cells upon LPS treatment. Tlx1CreER-Venus mice (4-week-old) were treated with LPS for 3 consecutive days, and stromal cell populations in the spleen were analyzed 24 hours after the final treatment. (a) Representative flow cytometric profiles of CD45 Ter119 CD31 stromal cells in the spleen of Tlx1CreER-Venus mice treated with LPS (middle) or endotoxin-free saline (left). Gates used to identify Venus+ cell populations are outlined and numbers above the outlined areas indicate percent events in each gate. The histogram represents the intensity of fluorescence of Venus+ cells from Tlx1CreER-Venus mice treated with LPS (red line) or saline (black line). (b) The MFI and total cell numbers of Venus+ cells of Tlx1CreER-Venus mice treated with LPS or saline. The relative MFI of Venus+ cells in saline-treated Tlx1CreER-Venus controls was arbitrarily set to 1. (n = 4). (c) Endogenous Tlx1 mRNA expression by Venus and Venus+ cells of Tlx1CreER-Venus mice treated with LPS or saline. The relative mRNA levels were normalized to β-actin and the level of mRNA transcripts in Venus cells of saline-treated Tlx1CreER controls was arbitrarily set to 1. (n = 3). (d) Representative tissue section images of spleen from saline- or LPS-treated Tlx1CreER-Venus mice. Tissue sections were stained with the indicated antibody combinations (upper photos). The inserted rectangle is shown at a higher magnification in the lower images. Scale bars indicate 100 μm. The right graph represents the Hopkins index of Venus+ cells in the spleen of saline- or LPS-treated Tlx1CreER-Venus mice. (n = 3). (e) Distance of Venus+ cells from CD150+ CD41 Lin HSPCs (n = 172 from 3 mice). Tissue sections from the spleen of LPS-treated Tlx1CreER-Venus mice were stained with the indicated antibody combinations. The right graph represents the distance of Venus+ cells from CD150+ CD41 Lin HSPCs or randomly generated spots.
Figure 7
Figure 7
Tlx1 is required for LPS-induced EMH in the spleen. (a) Schematic of the experimental strategy including time points of the analysis. Tlx1CreER-Venus/+ littermate control mice (Ctr) and Tlx1CreER-Venus/fl mice (CKO) treated with tamoxifen for 5 consecutive days were administered LPS or endotoxin-free saline for an additional 3 consecutive days and then analyzed 48 hours after the final treatment. Data were pooled from at least 2 independent experiments. (b) Gross appearance (left), weight (middle) and total cell number (right) of the spleen from Ctr and CKO mice treated with LPS or saline. (n = 3–4). (c) Total cell numbers of the indicated hematopoietic cell populations from the spleen of Ctr and CKO mice treated with saline or LPS. The gating strategy was same as in Fig. 3a. (n = 3–4). (d) Total cell numbers of the indicated hematopoietic stem/ progenitor cell populations in the BM of Ctr and CKO mice treated with saline or LPS. The gating strategy was same as in Fig. 2f,g. (n = 3–4). (e) The percentage of the indicated hematopoietic stem/ progenitor cell populations in the peripheral blood of Ctr and CKO mice treated with saline or LPS. (n = 3). (f) Serum G-CSF concentration in Ctr and CKO mice treated with saline or LPS. (n = 3). (g) Representative flow cytometric profiles of CD45 Ter119 CD31 stromal cells from the spleen of Ctr and CKO mice treated with saline or LPS. Gates used to identify Venus+ cell populations are outlined and numbers above the outlined areas indicate percent events in each gate. The histogram represents the intensity of fluorescence of Venus+ cells from Ctr mice treated with LPS (red line) or saline (black line), and CKO mice treated with LPS (blue). (h) The MFI and total cell numbers of Venus+ cells of Ctr and CKO mice treated with saline or LPS. The relative MFI of Venus+ cells in the saline-treated Ctr was arbitrarily set to 1. (n = 3–6). (i) Expression of CXCL12 and SCF mRNA in Venus+ and Venus cells among CD45 Ter119 CD31 splenic stroma cells from Ctr and CKO mice 24 hours after tamoxifen treatment. Data were normalized to β-actin and the level of mRNA transcripts in Venus+ cells of Ctr mice was arbitrarily set to 1. (n = 3). (j) Expression of CXCL12 and SCF mRNA in splenic Venus+ and Venus cells of saline-treated Ctr mice, LPS-treated Ctr and LPS-treated CKO mice. Data were normalized to β-actin and the level of mRNA transcripts in Venus cells of saline-treated Ctr mice was arbitrarily set to 1. (n = 3). (k) Clustering analysis of Venus+ cells in the spleen from Ctr and CKO mice treated with LPS or saline. Representative digital images of Venus+ cells (white dots) in the spleen sections from the indicated mice. The right graph represents the Hopkins index of Venus+ cells in the spleen of Ctr and CKO mice treated with saline or LPS. (n = 3).

Similar articles

Cited by

References

    1. Orkin SH, Zon LI. Hematopoiesis: an evolving paradigm for stem cell biology. Cell. 2008;132:631–644. doi: 10.1016/j.cell.2008.01.025. - DOI - PMC - PubMed
    1. Morrison SJ, Scadden DT. The bone marrow niche for haematopoietic stem cells. Nature. 2014;505:327–334. doi: 10.1038/nature12984. - DOI - PMC - PubMed
    1. Boulais PE, Frenette PS. Making sense of hematopoietic stem cell niches. Blood. 2015;125:2621–2629. doi: 10.1182/blood-2014-09-570192. - DOI - PMC - PubMed
    1. Chiu SC, et al. Extramedullary hematopoiesis (EMH) in laboratory animals: offering an insight into stem cell research. Cell Transplant. 2015;24:349–366. doi: 10.3727/096368915X686850. - DOI - PubMed
    1. Johns JL, Christopher MM. Extramedullary hematopoiesis: a new look at the underlying stem cell niche, theories of development, and occurrence in animals. Vet Pathol. 2012;49:508–523. doi: 10.1177/0300985811432344. - DOI - PubMed

Publication types

LinkOut - more resources