. 2018 May 29;8(1):8291.
doi: 10.1038/s41598-018-26670-4.

Early transcriptional response of human ovarian and fallopian tube surface epithelial cells to norepinephrine

Affiliations

Early transcriptional response of human ovarian and fallopian tube surface epithelial cells to norepinephrine

Anxhela Gjyshi et al. Sci Rep. .

Abstract

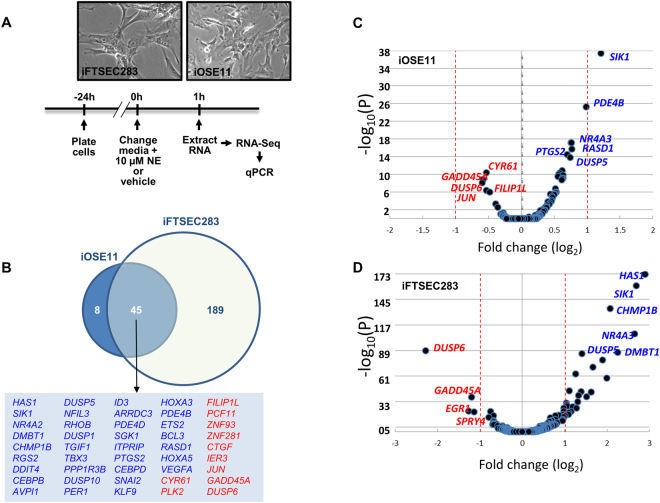
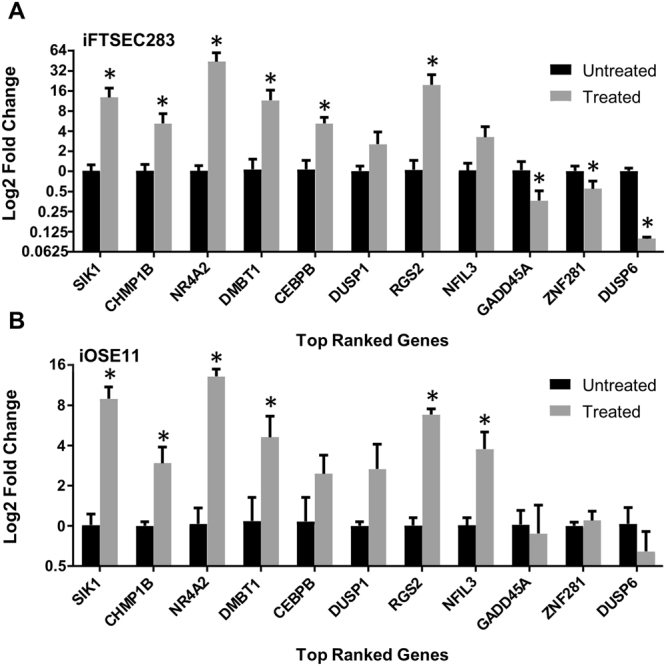
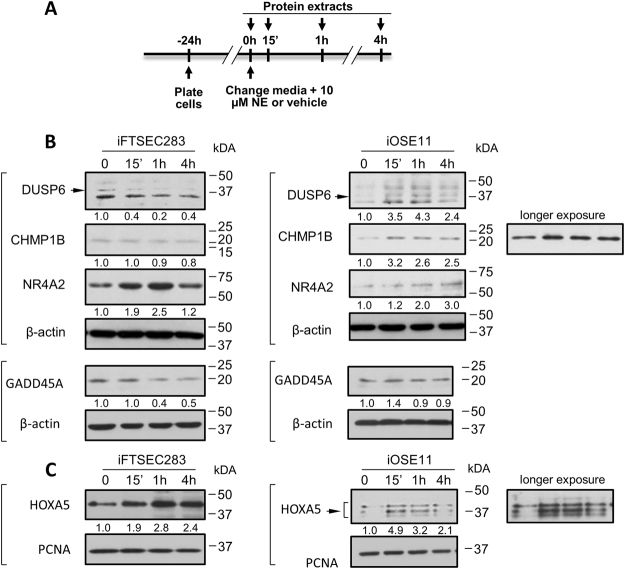
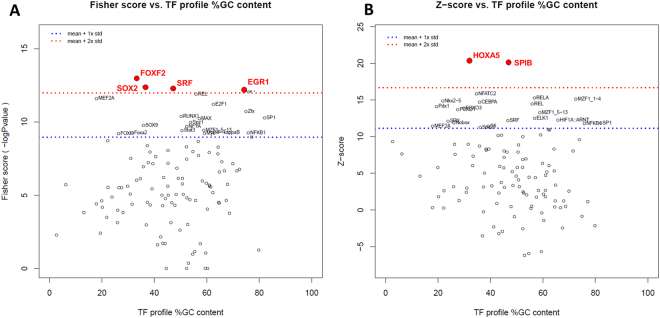
Evidence from human and animal studies suggests that chronic behavioral stress and resulting activation of the sympathetic nervous system may influence initiation and progression of tumors. However, the underlying mechanisms for these observations are poorly understood. The purpose of this study is to explore the effects of adrenergic signaling on cell line models derived from normal cells presumed to originate epithelial ovarian cancers. Here we explored the effects of the stress-related hormone, norepinephrine, on the transcriptional program of normal immortalized ovarian (iOSE) and fallopian tube (iFTSEC) surface epithelial cells. Analysis of RNA-Seq data of treated and untreated cells revealed a significant overlap between the responses in iOSE and iFTSEC cells. Most genes modulated by norepinephrine in ovarian and fallopian tube epithelial cells are already expressed in normal ovarian and fallopian tissue and cells. For several genes, expression changes were reflected at the protein level. Genes in immune-related and developmental pathways were enriched in the set of genes modulated by norepinephrine. We identified HOXA5, SPIB, REL, SRF, SP1, NFKB1, MEF2A, E2F1, and EGR1 transcription factor binding sites to be highly enriched in our dataset. These data represent the early transcriptional response to norepinephrine in cells postulated to originate epithelial ovarian cancer.


Conflict of interest statement

The authors declare no competing interests.

Figures

Figure 1
Figure 1
Early transcriptional response to norepinephrine. (A) Experimental timeline. (B) Venn diagram showing genes differentially expressed in response to norepinephrine (NE) treatment in iOSE11 and iFTSEC283 cells. Upregulated and downregulated genes are depicted in blue and red fonts, respectively. (C) and (D) Volcano plots for RNA-Seq data in iOSE11 (C) and iFTSEC283 (D).
Figure 2
Figure 2
qPCR confirmation of expression changes. Gene expression as measured by RT-qPCR in iOSE11 (A) or iFTSEC283 (B) treated with norepinephrine for eight and two upregulated and downregulated genes, respectively. Expression is plotted as log2 fold change in comparison to the mock-treated cells.
Figure 3
Figure 3
Analysis of protein level changes upon norepinephrine treatment. (A) Experimental timeline. (B) Western blot analysis of FTSEC283 and iOSE11 cells. Lysates were separated by PAGE, transferred to PVDF and blotted with antibodies against the indicated proteins. Β-actin was used as a loading control. (C) Western blot analysis of FTSEC283 and iOSE11 cells. Nuclear extracts were separated by PAGE, transferred to PVDF and blotted with antibodies against HOXA5. PCNA was used as a loading control. The arrows indicate the expected band corresponding to the protein in question. Numbers below blots are densitometric measurements and represent changes in relation to the 0 h control. Measurements are normalized to their respective internal controls (β-actin or PCNA).
Figure 4
Figure 4
Transcription factors whose binding sites are enriched in the promoter of genes responsive to norepinephrine in ovarian and fallopian tube cells. Identification of enriched transcription factors using oPOSSUM. (A) Significantly enriched using Fisher score. (B) Significantly enriched using Z-score. Dashed blue and red lines represent one and two standard deviations above the mean, respectively. Scores (Z-score and Fisher score) are plotted vs. the GC composition of the TF profile. TF with scores higher than 2SD are highlighted in red font.

References

    1. Reiche EM, Nunes SO, Morimoto HK. Stress, depression, the immune system, and cancer. The Lancet. Oncology. 2004;5:617–625. doi: 10.1016/S1470-2045(04)01597-9. - DOI - PubMed
    1. Lillberg K, et al. Stressful life events and risk of breast cancer in 10,808 women: a cohort study. American journal of epidemiology. 2003;157:415–423. doi: 10.1093/aje/kwg002. - DOI - PubMed
    1. Spiegel D, Giese-Davis J. Depression and cancer: mechanisms and disease progression. Biol Psychiatry. 2003;54:269–282. doi: 10.1016/S0006-3223(03)00566-3. - DOI - PubMed
    1. Glaser R, Kiecolt-Glaser JK. Stress-induced immune dysfunction: implications for health. Nat Rev Immunol. 2005;5:243–251. doi: 10.1038/nri1571. - DOI - PubMed
    1. Glaser R, et al. Evidence for a shift in the Th-1 to Th-2 cytokine response associated with chronic stress and aging. J Gerontol A Biol Sci Med Sci. 2001;56:M477–482. doi: 10.1093/gerona/56.8.M477. - DOI - PubMed

Publication types