. 2018 May 29;8(1):8286.
doi: 10.1038/s41598-018-26334-3.

Nanopore sequencing of drug-resistance-associated genes in malaria parasites, Plasmodium falciparum

Affiliations

Nanopore sequencing of drug-resistance-associated genes in malaria parasites, Plasmodium falciparum

Lucky R Runtuwene et al. Sci Rep. .

Abstract

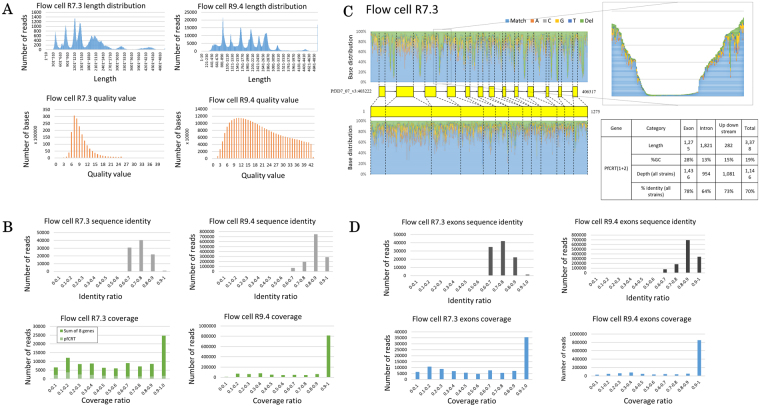
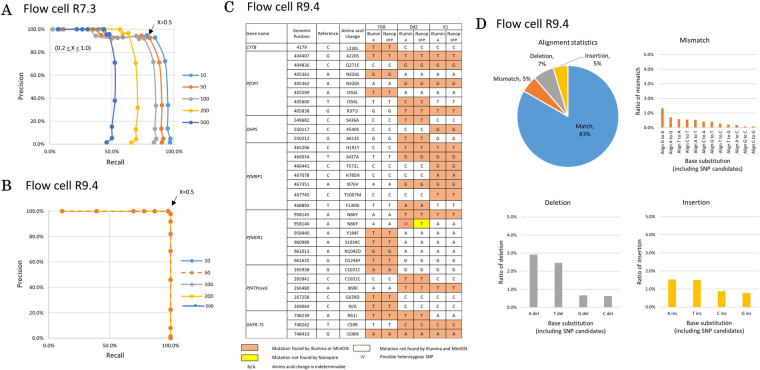
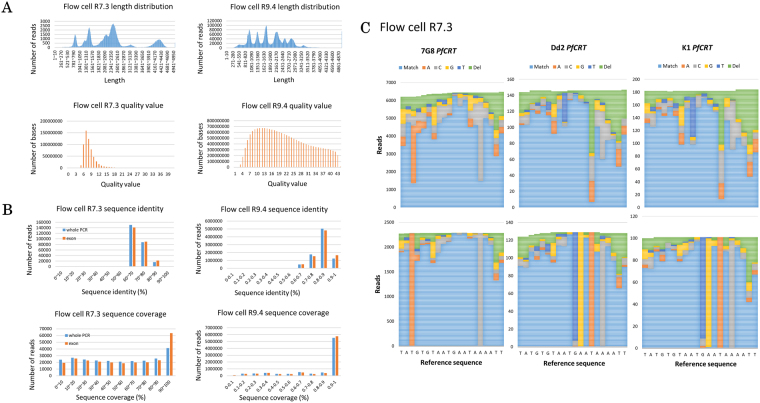
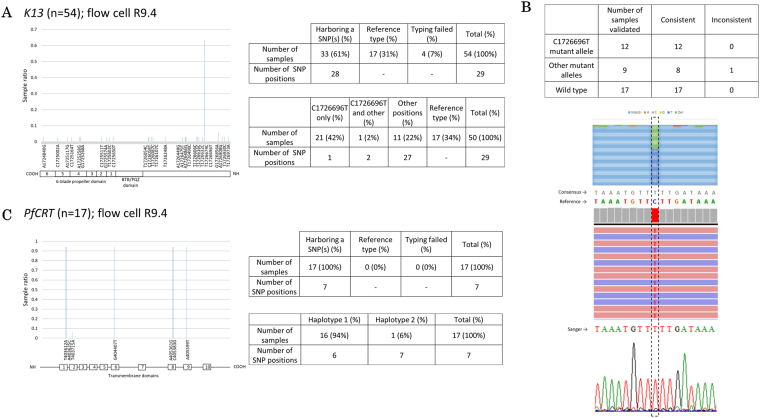
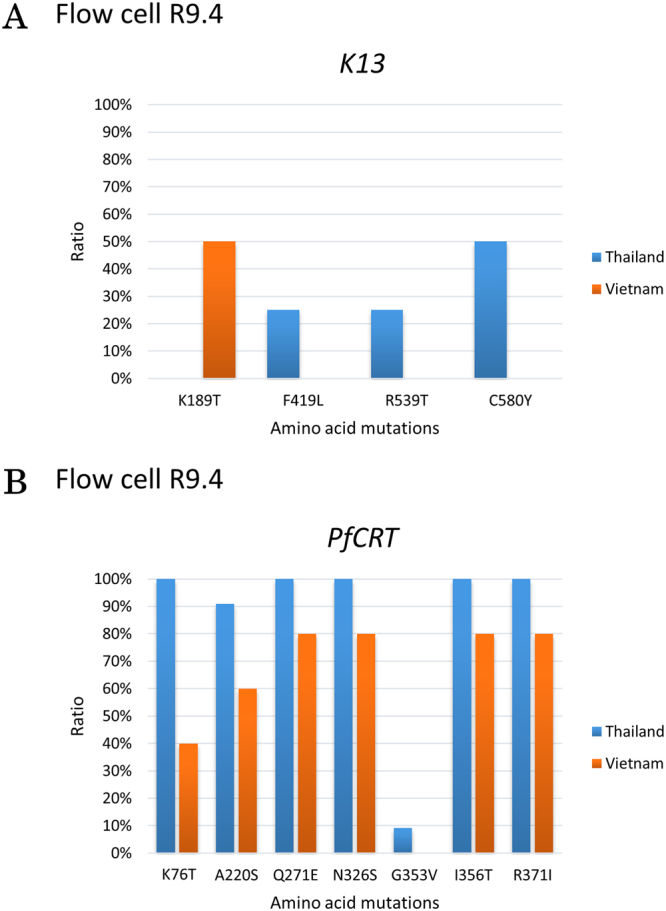
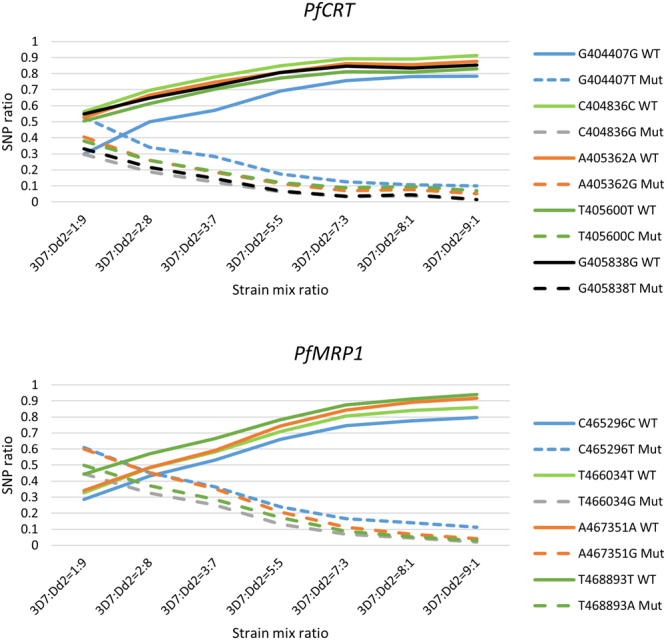
Here, we report the application of a portable sequencer, MinION, for genotyping the malaria parasite Plasmodium falciparum. In the present study, an amplicon mixture of nine representative genes causing resistance to anti-malaria drugs is diagnosed. First, we developed the procedure for four laboratory strains (3D7, Dd2, 7G8, and K1), and then applied the developed procedure to ten clinical samples. We sequenced and re-sequenced the samples using the obsolete flow cell R7.3 and the most recent flow cell R9.4. Although the average base-call accuracy of the MinION sequencer was 74.3%, performing >50 reads at a given position improves the accuracy of the SNP call, yielding a precision and recall rate of 0.92 and 0.8, respectively, with flow cell R7.3. These numbers increased significantly with flow cell R9.4, in which the precision and recall are 1 and 0.97, respectively. Based on the SNP information, the drug resistance status in ten clinical samples was inferred. We also analyzed K13 gene mutations from 54 additional clinical samples as a proof of concept. We found that a novel amino-acid changing variation is dominant in this area. In addition, we performed a small population-based analysis using 3 and 5 cases (K13) and 10 and 5 cases (PfCRT) from Thailand and Vietnam, respectively. We identified distinct genotypes from the respective regions. This approach will change the standard methodology for the sequencing diagnosis of malaria parasites, especially in developing countries.


Conflict of interest statement

The authors declare no competing interests.

Figures

Figure 1
Figure 1
Sequencing statistics of laboratory strains. Nanopore sequencing covers the whole length of nine genes of the laboratory strains regardless of the flow cell version. The quality value is significantly better for flow cell R9.4 (A). The sequence accuracy is better for flow cell R9.4. Mapped reads are fragmented with flow cell R7.3, especially PfCRT (B). The fragmentation is caused by introns (PfCRT is shown as an example) having higher AT counts than the exons (lower right panel). Upper left panel shows the SNPs distribution of PfCRT, while lower left panel shows the SNPs distribution of PfCRT protein-coding regions only. Light blue color symbolizes the matched sequenced nucleotides to the reference genome, while orange, grey, yellow, dark blue, and green colors symbolize the mutation to adenosine, cytosine, guanine, thymine, and deletion, respectively. Upper right panel shows the magnification of the deleted section of a PfCRT intron. Data for this figure is obtained with flow cell R7.3 (C). When introns are excluded from the analysis, fragmentations decrease with no difference in sequence accuracy on flow cell R7.3, but such problem is not found on flow cell R9.4, even if introns are included in the analysis (D). Note the significant increase in read number on flow cell R9.4 in Figures A, B, and D.
Figure 2
Figure 2
SNP calling of laboratory strains. The precision and recall of multiple thresholds used for heterozygous SNP calling on data obtained with flow cell R7.3. Precision is defined as the ratio of true positive (i.e., SNPs found by both MinION and Illumina) to the total of true positive and false positive (i.e., SNPs found only by MinION). Recall is defined as the ratio of true positive to the total of true positive and false negative (i.e., SNPs found only by Illumina). The lines show the sequence depth used for analysis (threshold R). The dots on the line show the threshold X. Threshold X ≥ 0.5 with R ≥ 50 sequence depth is used for subsequent analysis because of the reasonable precision and recall values, which are 0.92 and 0.8, respectively (A). On the other hand, flow cell R9.4 gives the same precision and recall for every threshold R with X ≥ 0.5, which is 1 and 0.97, respectively. In this figure, all the lines produced by different threshold R stack up (B). SNPs called with the parameters X ≥ 0.5 and R ≥ 50 on data obtained with flow cell R9.4 show 100% identity to Illumina validation (orange boxes). Exception is made for one position in PfMDR1 (red color font). This position is seemingly heterozygous as called by Illumina. However, MinION could only determine this position as a homozygous SNP (C). The error patterns show that G to A mismatches, A deletions, and A/T insertions are the most frequent polymorphisms in the laboratory strain malaria parasites sequenced with flow cell R9.4 (D).
Figure 3
Figure 3
Sequencing of clinical samples. The read length distributions of the combined clinical specimens show that the sequenced reads are distributed to cover all nine genes with a quality value that is significantly better on flow cell R9.4 (A). The reads obtained with flow cell R7.3 are not fragmented in clinical specimens, although exons are included in the analysis. Nevertheless, removal of introns significantly increased the coverage. On the other hand, the reads obtained with flow cell R9.4 have better accuracy and coverage, regardless of the introns removal (B). Remapping of the sequenced reads (upper panel) to the representative haplotype reference shows confident SNP calling (lower panel). In this process, we removed the reads that have unconfident SNPs called in highly difficult region of amino acid 72–76 of PfCRT. We then remapped the remaining reads to the representative strain reference to increase call confidence (C). Note the significant increase in read number on flow cell R9.4 in Figures A and B. Comparison between data produced by flow cell R7.3 and R9.4 uses different samples due to the exhaustion of the original samples for the flow cell R7.3 analysis.
Figure 4
Figure 4
K13 sequencing as a proof-of-concept. We sequenced the whole K13 from 54 samples obtained in Indonesia. There are 61.1% samples with SNPs in 28 positions. A significant number of samples (42%) have SNPs in genomic position 1726696 of chromosome 13, which is in the region of K13. The respective K13 protein domains in regard to genomic positions is shown (A). The polymorphism in genomic position 1726696 is validated consistently with other sequencing means. An example of this validation with Sanger and/or Illumina is shown (B). Sequencing of PfCRT from 17 samples shows SNPs in 7 positions. We further found two haplotypes with most samples are of haplotype 1 (see Supplementary Figure 8B). The respective PfCRT protein domains in regard to genomic positions is also shown (C). All data are obtained from the sequencing of clinical specimens collected with FTA card and sequenced with flow cell R9.4.
Figure 5
Figure 5
K13 and PfCRT sequencing of Thailand and Vietnam samples. We sequenced 3 and 5 cases (K13) and 10 and 5 cases (PfCRT), from Thailand and Vietnam, respectively. Mutations in K13 from Thai samples show a different pattern compared to Vietnamese samples (A). Nevertheless, mutation pattern of PfCRT is the same between Thai and Vietnamese samples (B). All data are obtained with flow cell R9.4.
Figure 6
Figure 6
Ratio of wild type and mutated nucleotides in various proportion of a mixture of two P. falciparum strains, 3D7 and Dd2. A mixture of two P. falciparum strains (3D7 and Dd2) with different ratio show that we could infer the possibility of multiple strain infection if the SNP ratio is less than 0.5. Each color in the figure represents the position of the SNPs of PfCRT and PfMRP1 inferred from Fig. 2B. Solid lines show the wild type nucleotides found in 3D7, while the dotted lines show the SNPs found in Dd2. The intersection of the solid and dotted lines is a possible mix infection, which is at the ratio of less than 0.5. Data is obtained with flow cell R9.4.

Similar articles

Cited by

References

    1. World Health Organization. Global technical strategy for malaria 2016–2030 (2015).
    1. Hotez, P. & Herricks, J. One million deaths by parasites. at http://blogs.plos.org/speakingofmedicine/2015/01/16/one-million-deaths-p... (2015).
    1. Kim Y, Schneider KA. Evolution of drug resistance in malaria parasite populations. Nat. Educ. Knowl. 2013;4:6.
    1. Cui L, Mharakurwa S, Ndiaye D, Rathod PK, Rosenthal PJ. Antimalarial drug resistance: Literature review and activities and findings of the ICEMR network. Am. J. Trop. Med. Hyg. 2015;93:57–68. doi: 10.4269/ajtmh.15-0007. - DOI - PMC - PubMed
    1. White NJ. Antimalarial drug resistance. J. Clin. Invest. 2004;113:1084–1092. doi: 10.1172/JCI21682. - DOI - PMC - PubMed

Publication types