. 2018 May 29;8(1):8287.
doi: 10.1038/s41598-018-26556-5.

Investigation of dose-rate effects and cell-cycle distribution under protracted exposure to ionizing radiation for various dose-rates

Affiliations

Investigation of dose-rate effects and cell-cycle distribution under protracted exposure to ionizing radiation for various dose-rates

Yusuke Matsuya et al. Sci Rep. .

Abstract

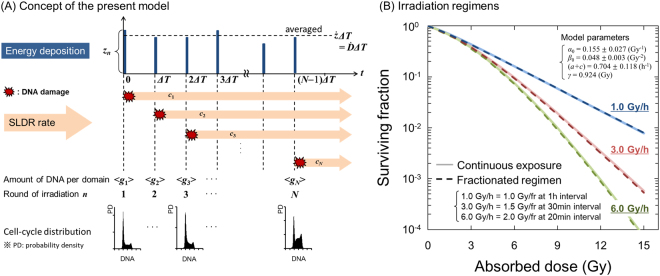
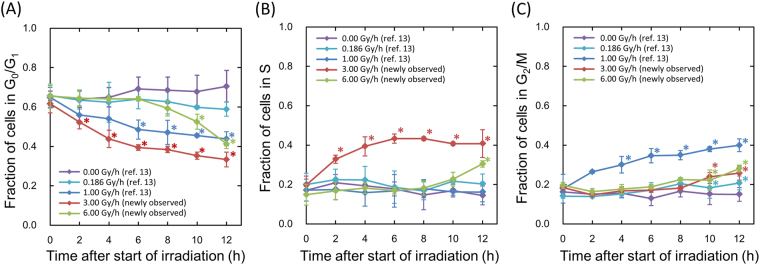
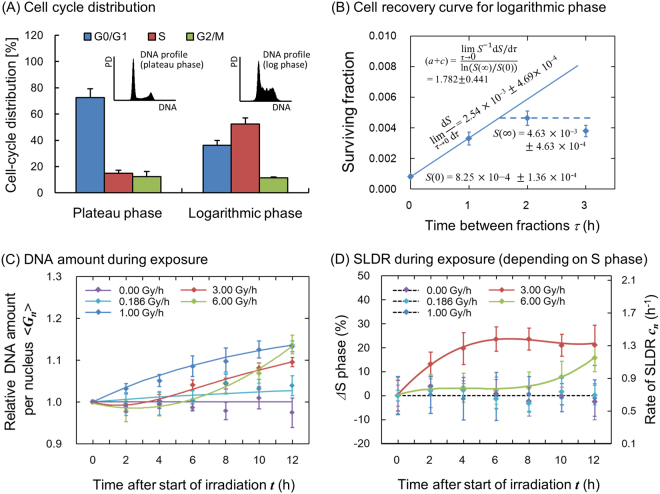
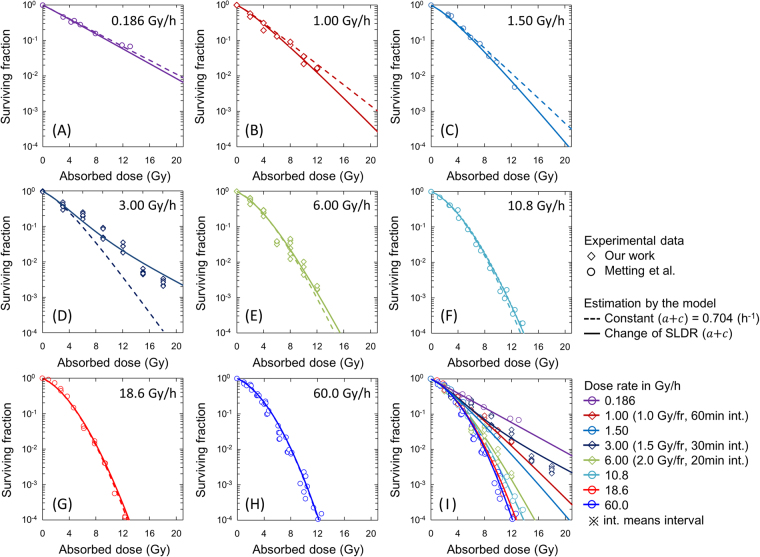
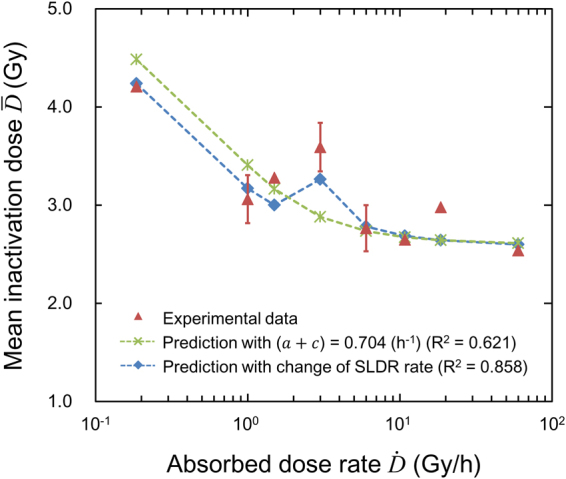
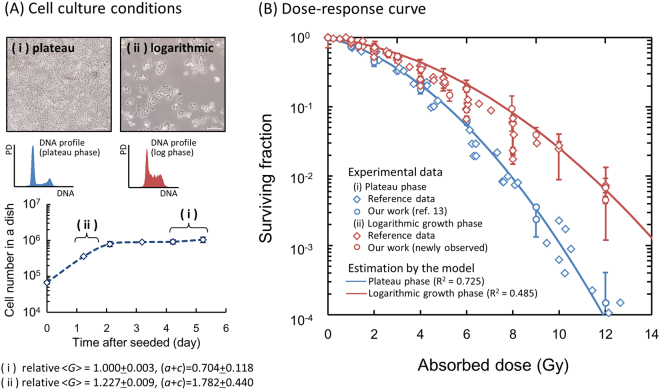
During exposure to ionizing radiation, sub-lethal damage repair (SLDR) competes with DNA damage induction in cultured cells. By virtue of SLDR, cell survival increases with decrease of dose-rate, so-called dose-rate effects (DREs). Here, we focused on a wide dose-rate range and investigated the change of cell-cycle distribution during X-ray protracted exposure and dose-response curves via hybrid analysis with a combination of in vitro experiments and mathematical modelling. In the course of flow-cytometric cell-cycle analysis and clonogenic assays, we found the following responses in CHO-K1 cells: (1) The fraction of cells in S phase gradually increases during 6 h exposure at 3.0 Gy/h, which leads to radio-resistance. (2) Slight cell accumulation in S and G2/M phases is observed after exposure at 6.0 Gy/h for more than 10 hours. This suggests that an increase of SLDR rate for cells in S phase during irradiation may be a reproducible factor to describe changes in the dose-response curve at dose-rates of 3.0 and 6.0 Gy/h. By re-evaluating cell survival for various dose-rates of 0.186-60.0 Gy/h considering experimental-based DNA content and SLDR, it is suggested that the change of S phase fraction during irradiation modulates the dose-response curve and is possibly responsible for some inverse DREs.


Conflict of interest statement

The authors declare no competing interests.

Figures

Figure 1
Figure 1
Schematic representation of the present model. (A) is the schematic image of the present modelling of cell-killing, and (B) illustrates the fractionation regimen equivalent to continuous exposure with a constant dose-rate. The regimen of dose fractionation was determined from the comparison between Eqs (11) and (13). In (B), the regimen for 1.0 Gy/h is the same example as described previously.
Figure 2
Figure 2
Cell-cycle distribution during exposure at various dose-rates. (A) is for the change of cell faction in G0/G1 phase, (B) is for that in S phase and (C) is for that in G2/M phase. The data for 3.0 and 6.0 Gy/h were newly measured in the present flow-cytometric analysis and the other sets of data were taken from our previous report. The symbol * represents P < 0.05 significant change compared with the data at just start of irradiation (0 h). The error bar represents the standard deviation deduced from three independent experiments. In addition, we confirmed there is no significant difference of cell-cycle distribution at the starting time of irradiation among control (0.00 Gy/h), 0.186 Gy/h, 1.0 Gy/h, 3.0 Gy/h and 6.0 Gy/h by using the Tukey-Kramer method.
Figure 3
Figure 3
Cell condition (DNA profile and SLDR rate) input into the present model. (A) shows DNA profile and cell-cycle distribution for plateau and logarithmic growth phase in CHO-K1 cell line, (B) shows procedure to deduce the rate of SLDR for logarithmic growth phase, (C) and (D) show the change of average DNA amount per nucleus and SLDR rate during protracted exposure, respectively, for various dose-rates. In Fig. 3B, a split-dose cell recovery data (5 Gy + 10 Gy) was taken from ref. and we deduced (a + c) value based on Eq. (21) from dS/dτ, S(0) and S(). Here the data for 0.0, 0.186 and 1.0 Gy/h were taken from our previous investigation. In Fig. 3C,D, whilst the symbols represent measured mean DNA contents and variation of S-phase fraction, the lines are the interpolated curve by spline. The constant rates for the exposure to 0.0, 0.186 and 1.0 Gy/h of SLDR were adopted because there is no significant change of S-phase fraction.
Figure 4
Figure 4
Comparison between the clonogenic survival data and the model prediction. Whilst the symbols denote the survival data by our work and reference data, dotted line and solid line represent the model estimations with a constant rate of (a + c)  =  0.704 (h−1) and with changing rate of c based on Fig. 3D, respectively. The data for 3.0 and 6.0 Gy/h were newly observed in this paper. The fit qualities of the model for 1.0 Gy/h, 3.0 Gy/h and 6.0 Gy/h are summarized in Table 2.
Figure 5
Figure 5
Mean inactivation dose D¯ for evaluating the DREs. Red symbols denote the experimental D¯, green line (with symbols) is the D¯ calculated by using the cell-killing model formula Eq. (13) with constant (a + c) value of 0.704 (h−1), and blue line (with symbols) is the D¯ calculated by using the model (Eq. (10)) with variable repair rate, c, during the exposure. It is noted that there is concave characteristics in dose-rate range of around 1.5–3.0 Gy/h. The D¯ and R2 values were calculated by using Eqs (24) and (25), respectively.
Figure 6
Figure 6
Dose-response curves for different cell culture conditions. (A) Upper panels represent microscopic images and DNA profiles for (i) plateau and (ii) logarithmic growth phases, respectively. Bottom figure is cell growth curve of CHO-K1 cell line to make the two cell conditions. (B) Dose-response curves were predicted by considering DNA contents per nucleus and the rate of SLDR for the two different phases. The set of parameters for logarithmic growth phase listed in Table 1 was deduced from that for plateau phase with the cell condition (DNA content and SLDR rate). The estimated curves were compared with experimental data after irradiation with 250 kVp X-rays,– to check the assumption in this study.

References

    1. van der Kogel, A. J. The dose-rate effect. In: Joiner, M., van, der, Kogel, A. J. (eds). Basic Clinical Radiobiology. London, Hodder Arnold, 158–168 (2009).
    1. Matsuya Y, Tsutsumi K, Sasaki K, Date H. Evaluation of the cell survival curve under radiation exposure based on the kinetics of lesions in relation to dose-delivery time. J. Radiat. Res. 2015;56:90–99. doi: 10.1093/jrr/rru090. - DOI - PMC - PubMed
    1. Amundson SA, Chen DJ. Inverse dose-rate effect for mutation induction by γ-rays in human lymphoblasts. Int. J. Radiat. Biol. 1996;69:555–563. doi: 10.1080/095530096145562. - DOI - PubMed
    1. Stevens DL, Bradley S, Goodhead DT, Hill M. The influence of dose rate on the induction of chromosome aberrations and gene mutation after exposure of plateau phase V79-4 cells with high-LET alpha particles. Radiat. Res. 2014;182:331–337. doi: 10.1667/RR13746.1. - DOI - PubMed
    1. Mitchell CR, Folkard M, Joiner MC. Effects of exposure to low- dose-rate 60Co gamma rays on human tumor cells in vitro. Radiat. Res. 2002;158:311–338. doi: 10.1667/0033-7587(2002)158[0311:EOETLD]2.0.CO;2. - DOI - PubMed

Publication types

LinkOut - more resources