. 2018 Jun;13(6):1465-1487.
doi: 10.1038/nprot.2018.042. Epub 2018 May 24.

Generation and validation of homozygous fluorescent knock-in cells using CRISPR-Cas9 genome editing

Affiliations

Generation and validation of homozygous fluorescent knock-in cells using CRISPR-Cas9 genome editing

Birgit Koch et al. Nat Protoc. 2018 Jun.

Abstract

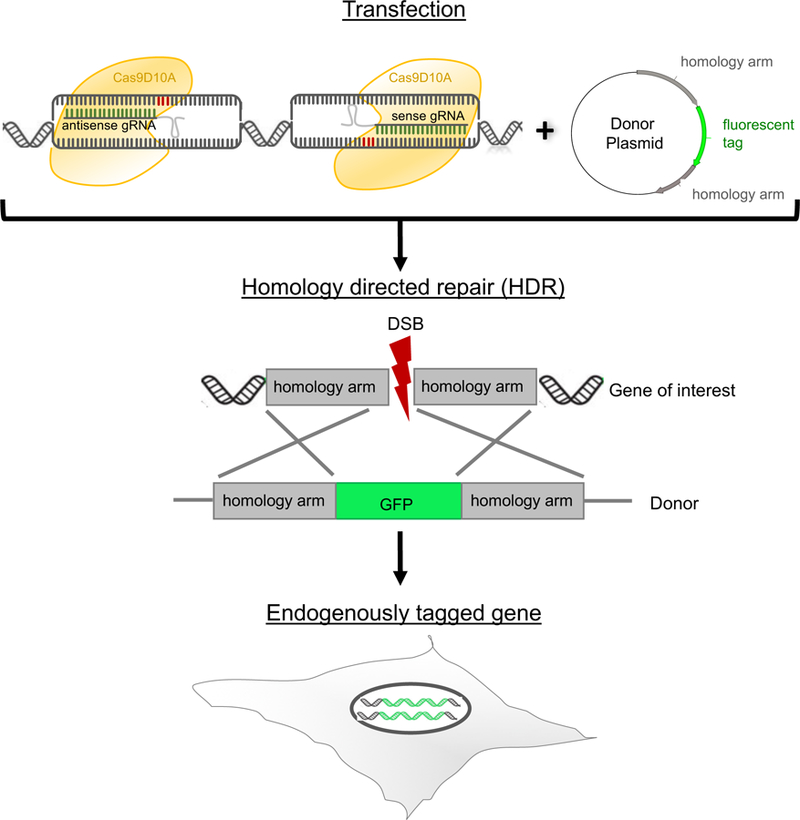
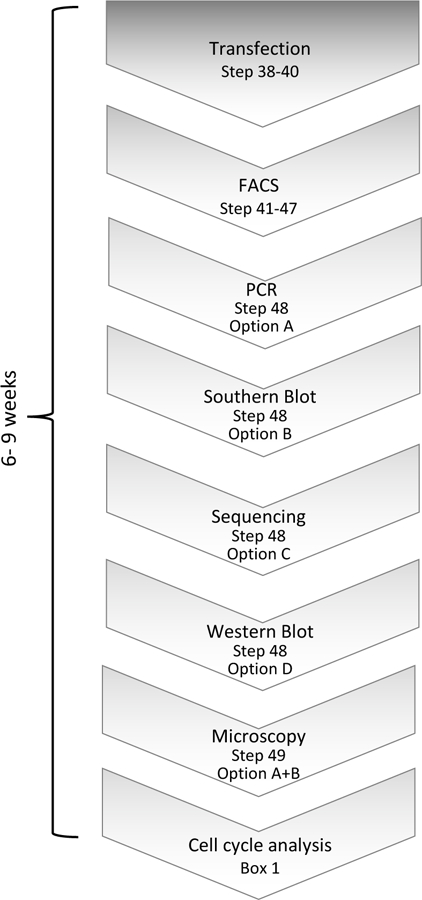
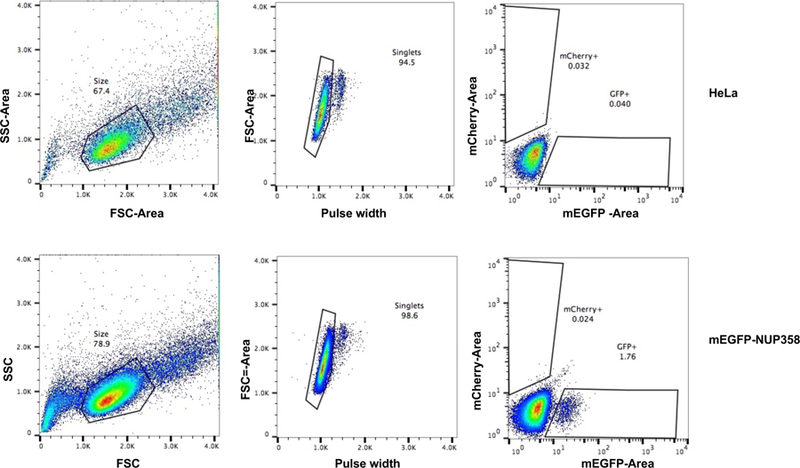
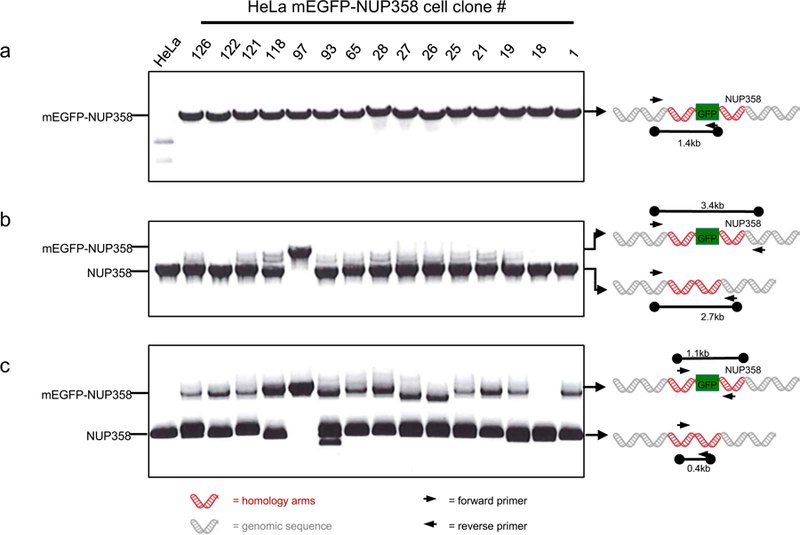
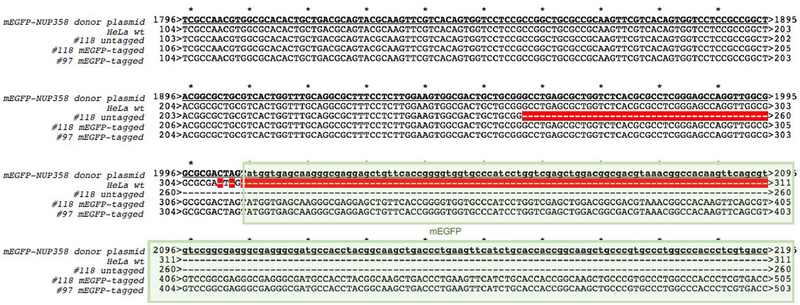
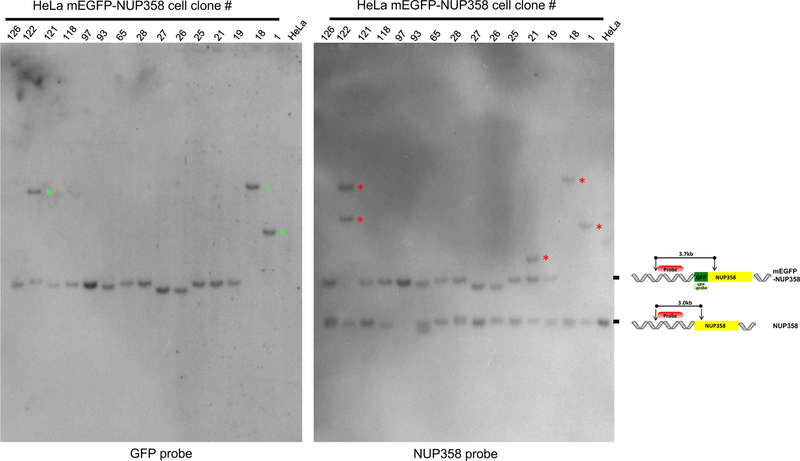
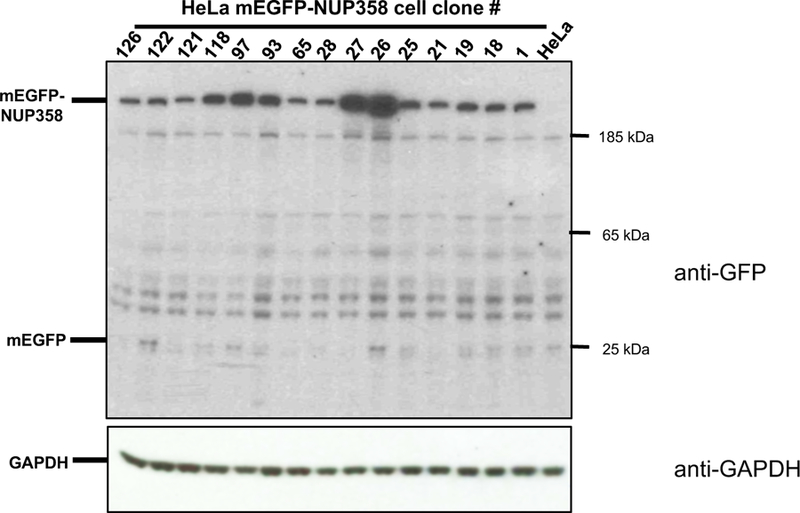
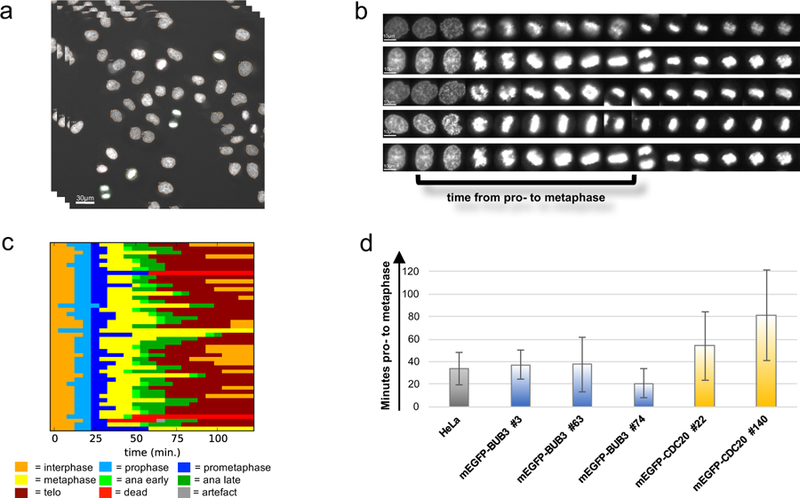
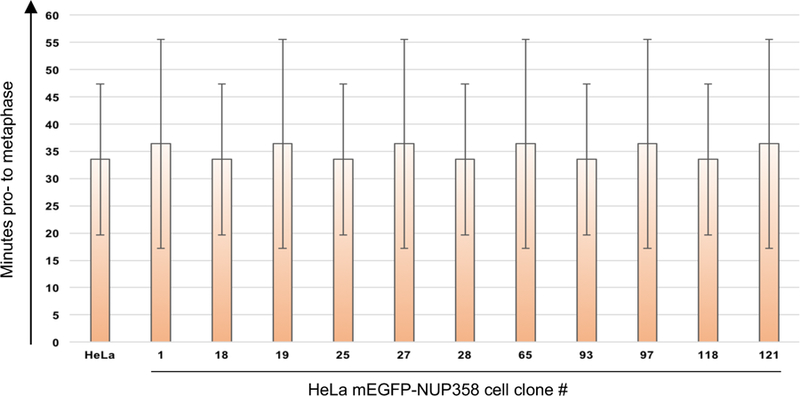
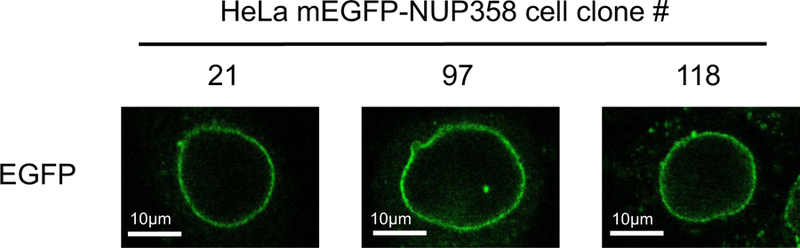
Gene tagging with fluorescent proteins is essential for investigations of the dynamic properties of cellular proteins. CRISPR-Cas9 technology is a powerful tool for inserting fluorescent markers into all alleles of the gene of interest (GOI) and allows functionality and physiological expression of the fusion protein. It is essential to evaluate such genome-edited cell lines carefully in order to preclude off-target effects caused by (i) incorrect insertion of the fluorescent protein, (ii) perturbation of the fusion protein by the fluorescent proteins or (iii) nonspecific genomic DNA damage by CRISPR-Cas9. In this protocol, we provide a step-by-step description of our systematic pipeline to generate and validate homozygous fluorescent knock-in cell lines.We have used the paired Cas9D10A nickase approach to efficiently insert tags into specific genomic loci via homology-directed repair (HDR) with minimal off-target effects. It is time-consuming and costly to perform whole-genome sequencing of each cell clone to check for spontaneous genetic variations occurring in mammalian cell lines. Therefore, we have developed an efficient validation pipeline of the generated cell lines consisting of junction PCR, Southern blotting analysis, Sanger sequencing, microscopy, western blotting analysis and live-cell imaging for cell-cycle dynamics. This protocol takes between 6 and 9 weeks. With this protocol, up to 70% of the targeted genes can be tagged homozygously with fluorescent proteins, thus resulting in physiological levels and phenotypically functional expression of the fusion proteins.


Conflict of interest statement

Competing interests

The authors declare that they have no competing financial interests.

Figures

Figure 1
Figure 1. Paired CRISPR/Cas9 nickase approach
The RuvC nuclease domain is mutated in the Cas9D10A nickase resulting in single-stranded DNA breaks whose subsequent repair occurs preferentially through HDR ,,,. Two gRNAs are required to cleave the antisense and sense strand simultaneously when using Cas9D10A nickase which results in more specificity and less off-target cleavages,–. Therefore Cas9D10A plasmids expressing nickase and either antisense or sense gRNAs are transfected in the presence of the DNA repair template, a donor plasmid containing the fluorescent marker flanked by homology arms (500–800 bp). This leads to a double strand break (DSB) followed by homology directed repair (HDR) and the fluorescent tag is inserted into a specific locus. The efficiency of HDR varies between cell lines and it is advisable to test the efficiency of homologous recombination in the cells of interest.
Figure 2
Figure 2. Validation pipeline of genome-edited cell lines
After the cells have been transfected and selected for fluorescently expressing clones, the validation pipeline consists of junction PCR, Southern blot analysis, Sanger sequencing, microscopy, Western blot and cell cycle analysis.
Figure 3
Figure 3. FACS of genome-edited cell lines tagging NUP358 at the N-terminus
HeLa Kyoto cells are used as negative control and mEGFP-NUP358 cells were selected for mEGFP expression. GFP-expressing single cells were sorted into 96well plates using a DAKO MoFlo High Speed sorter. The panels on the left display the side scatter area vs. forward scatter area to gate for live cells (black polygon, number = % of live cells). The panel in the middle distinguishes singlets (black polygon, number = % single cells) using the FSC-Area vs. FSC-Pulse Width plot. The diagrams on the right exhibit the signal intensity of mEGFP using a 512/15 bandpass filter and the red polygon indicates selected cells for single cell sorting (number = % of GFP positive cells). HeLa Kyoto wt cells serve as a negative control and define background signal and the gates for the positive GFP cells were set accordingly. 1.76% mEGFP-NUP358 positive cells were sorted into 96-well plates to obtain single clones expressing mEGFP-NUP358. SSC = Sideward Scatter, FSC = Forward Scatter.
Figure 4
Figure 4. Junction PCR of HeLa Kyoto mEGFP-NUP358 cells.
The junction PCR was performed as described in steps 48 Option A. (a) PCR to test the integration of mEGFP into the correct locus. The forward primer binds at the 5’ end outside of the left homology arm and the reverse primer to the fluorescent marker gene (see Table 1) resulting in a single 1.4 kb fragment if NUP358 is tagged at the N-terminus with mEGFP. The binding of the primers is illustrated in the scheme at the right hand side. (b) To test if all alleles are tagged with the fluorescent marker at the correct locus (homozygosly tagged mEGFP-NUP358), a forward primer located 5’ outside of the left homology arm and a reverse primer 3’outside of the right homology arm were used. As depicted in the scheme two bands can occur: either untagged Nup358 as 2.7 kb fragment or mEGFP-tagged NUP358 as 3.4 kb fragment. Homozygosity is indicated when only the tagged mEGFP-NUP358 (3.4 kb fragment) is detected as demonstrated for clone #97. (c) Additional PCR to test for homozygosity using primers within both homology arms of the donor (see design of primers for T7E1 assay) because problems occurred in detecting the tagged gene as demonstrated in (b). The forward primer is within the left homology arm whereas the reverse primer is located in the right homology arm. Two fragments can be detected: untagged Nup358 results in a 0.4 kb fragment and tagged mEGFP-NUP358 in a 1.1 kb fragment. Only the tagged mEGFP-NUP358 fragment of 1.1 kb can be detected for the homozygous clone #97.
Figure 5
Figure 5. Sanger sequencing at the target site (Start codon).
PCR was performed using primers around the target site, start codon of NUP358, followed by sanger sequencing. The sequences of tagged and untagged NUP358 was aligned to the donor plasmid used as DNA repair template during transfection. The box indicates mEGFP which is missing in HeLa Kyoto wt and untagged NUP358 as expected. The red line within the diagram depicts missing nucleotides (= deletion).
Figure 6
Figure 6. Southern blot analysis of HeLa Kyoto mEGFP-NUP358 cell clones.
Southern blot was performed with different HeLa Kyoto cell clones expressing mEGFP-NUP358 using GFP or NUP358 probes as described in step 48 Option B. Briefly the genomic DNA was digested with BamHI and SphI. GFP probe is binding within the GFP gene and can be detected as a 3.7kb fragment. The NUP358 probe which was design to bind at the 5’ end of NUP358 outside the left homology arm can detect either the untagged NUP358 (= 3.0kb fragment) or tagged mEGFP-NUP358 (= 3.7kb fragment). The scheme on the right hand side depict the binding of the probes and the expected results. Homozygous clones will lead to the detection of only the tagged mEGFP-NUP358 (3.7kb fragment) as demonstrated with clone #97. Green asterisks in the blot with GFP probe indicate extra integration of mEGFP. Red asterisks in the blot with NUP358 probe reveal genomic rearrangements of the chromosome within this region. (*) = additional or shifted DNA fragments.
Figure 7
Figure 7. Western blot analysis of HeLa Kyoto mEGFP-NUP358.
An antibody against GFP (upper panel, Roche cat no. 11814460001) was used to detect full length expression of the endogenously tagged mEGFP-NUP358 protein. Anti-GAPDH (lower panel, Santa Cruz cat no. sc-32233 ) was used as loading control.
Figure 8
Figure 8. Workflow of the analysis of mitotic timing.
(a) Automated live cell imaging of SiR-DNA stained cells to detect the timing of mitosis. Pictures were taken every 5 min. over 24h (scale bar = 30µm) (b) Live cell images were automatically analysed using CellCognition software to track single cells and classify them into interphase and mitotic phases (scale bar = 10µm). Subsequently, (c) the mitotic timing of each single cell was analysed. The different colors represent different mitotic phases for every single cell. (d) Representative statistical evaluation of the duration of mitosis for various cell lines expressing various tagged proteins. The error bars are the standard deviations of the mean mitotic timing from pro- to onset of anaphase.
Figure 9
Figure 9. Mitotic duration of HeLa Kyoto mEGFP-NUP358 cell clones.
Results of the mitotic analysis workflow for all HeLa Kyoto mEGFP-NUP358 cell clones. The duration of mitosis of HeLa Kyoto mEGFP-NUP358 clones was compared to HeLa Kyoto wt cells. The error bars are the standard deviations of the mean mitotic timing from pro-to onset of anaphase.
Figure 10
Figure 10. Live cell imaging of HeLa Kyoto mEGFP-NUP358 cell clones.
Various HeLa cell clones expressing HeLa Kyoto mEGFP-NUP358. #97 represent a homozygously tagged mEGFP-NUP358 clone whereas #21 and #118 are heterozygously tagged ones.

References

    1. Mahen R, et al. Comparative assessment of fluorescent transgene methods for quantitative imaging in human cells. Mol Biol Cell 25:3610–8 (2014). - PMC - PubMed
    1. Otsuka S, et al. Nuclear pore assembly proceeds by an inside-out extrusion of the nuclear envelope. eLife 5:e19071 (2016)Wachsmuth, M., et al.. High-throughput fluorescence correlation spectroscopy enables analysis of proteome dynamics in living cells. Nat Biotechnol. 33:384–9 (2015) - PMC - PubMed
    1. Politi A, et al. Quantitative mapping of endogenously fluorescently tagged proteins using FCS-calibrated four dimensional live cell imaging. Nat. Protoc manuscript submitted (2017). - PMC - PubMed
    1. Ran FA, et al. , Genome engineering using the CRISPR-Cas9 system. Nat. Protoc 8:2281–2308 (2013). - PMC - PubMed
    1. Trevino AE, et al. Genome Editing Using Cas9 Nickases. Methods Enzymol 546:161–74 (2014) - PubMed

Publication types

MeSH terms

Substances