. 2018 May 25;5(3):ENEURO.0013-18.2018.
doi: 10.1523/ENEURO.0013-18.2018. eCollection 2018 May-Jun.

Serotonin Selectively Increases Detectability of Motion Stimuli in the Electrosensory System

Affiliations

Serotonin Selectively Increases Detectability of Motion Stimuli in the Electrosensory System

Mariana M Marquez et al. eNeuro. .

Abstract

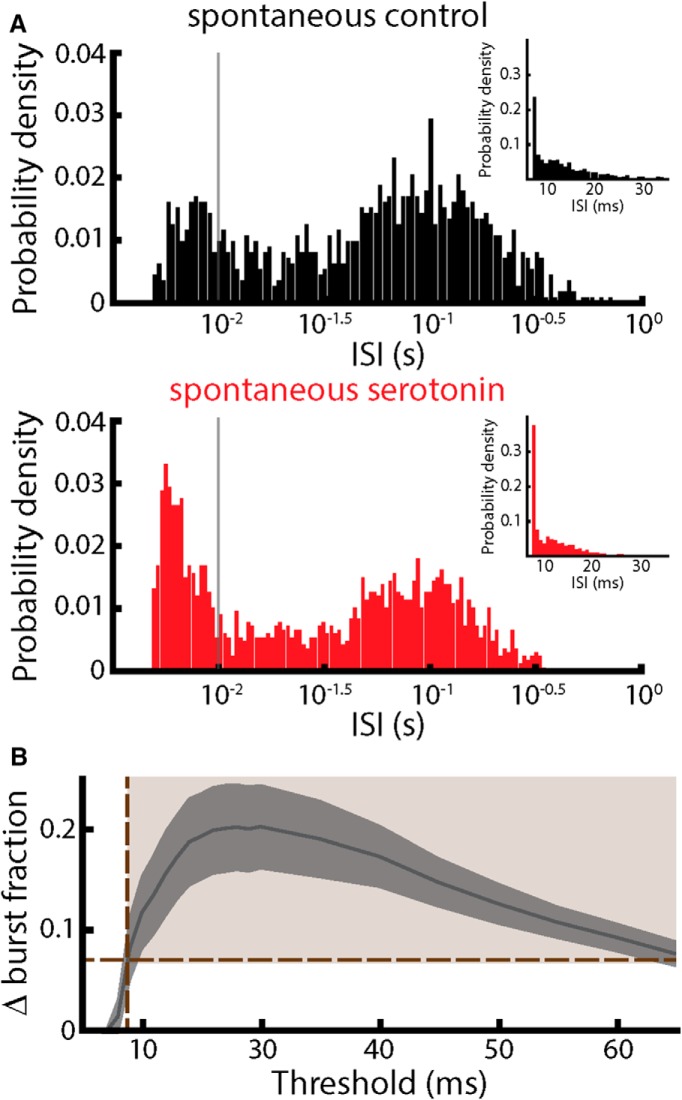
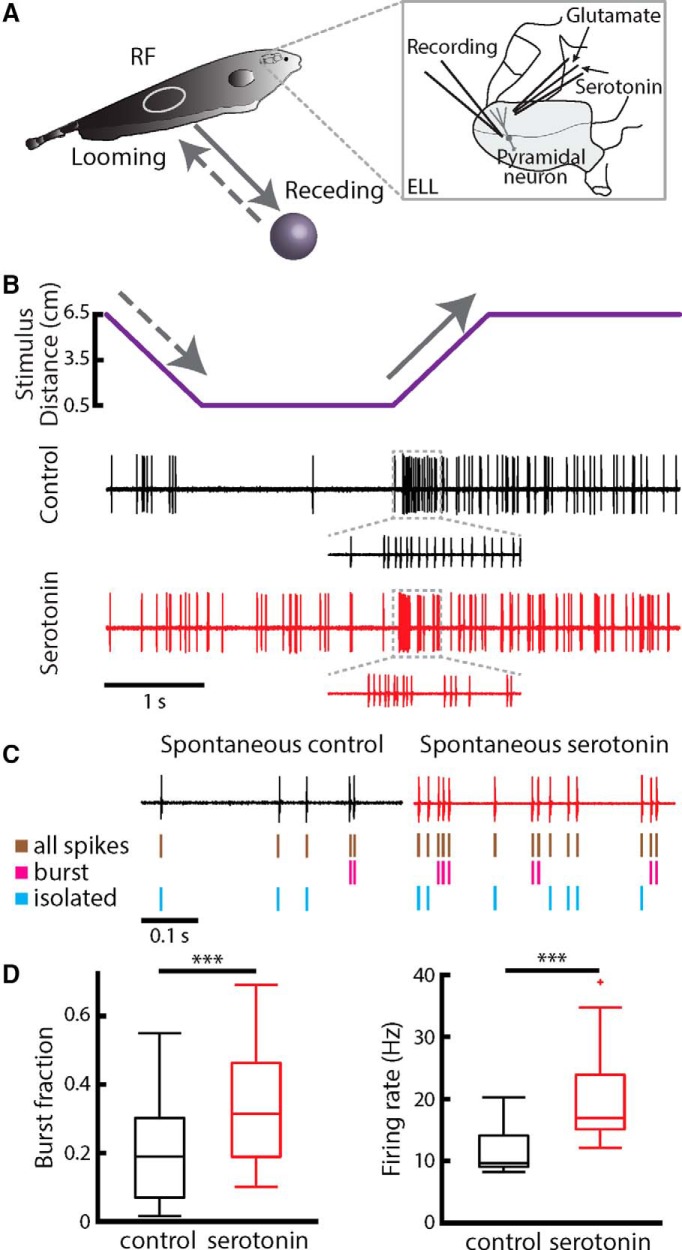
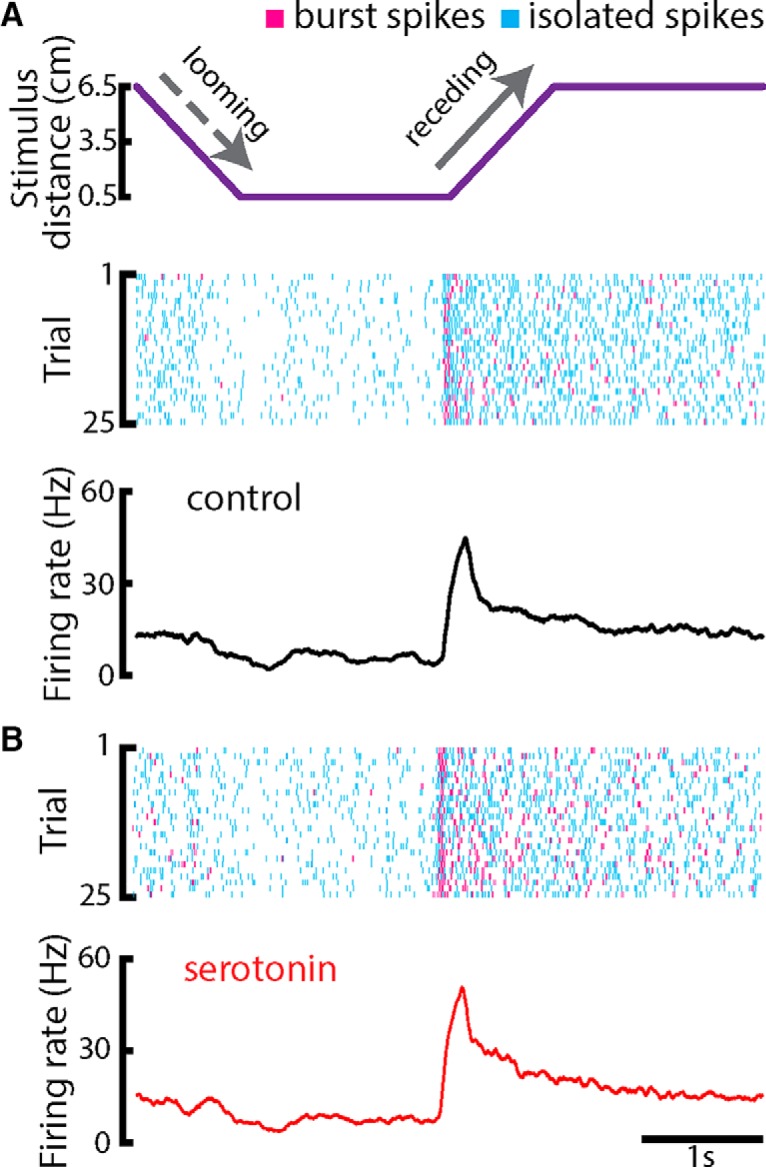
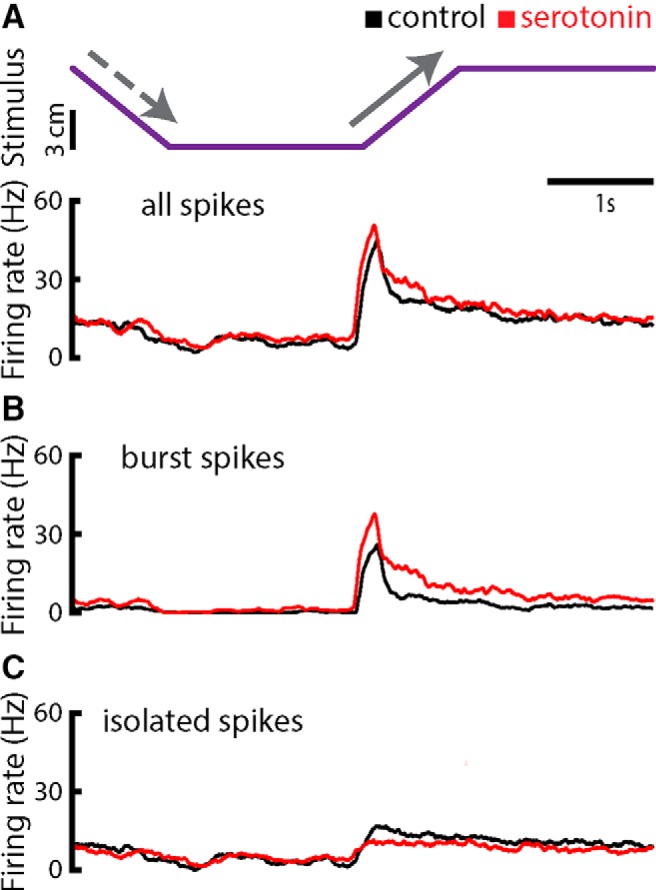
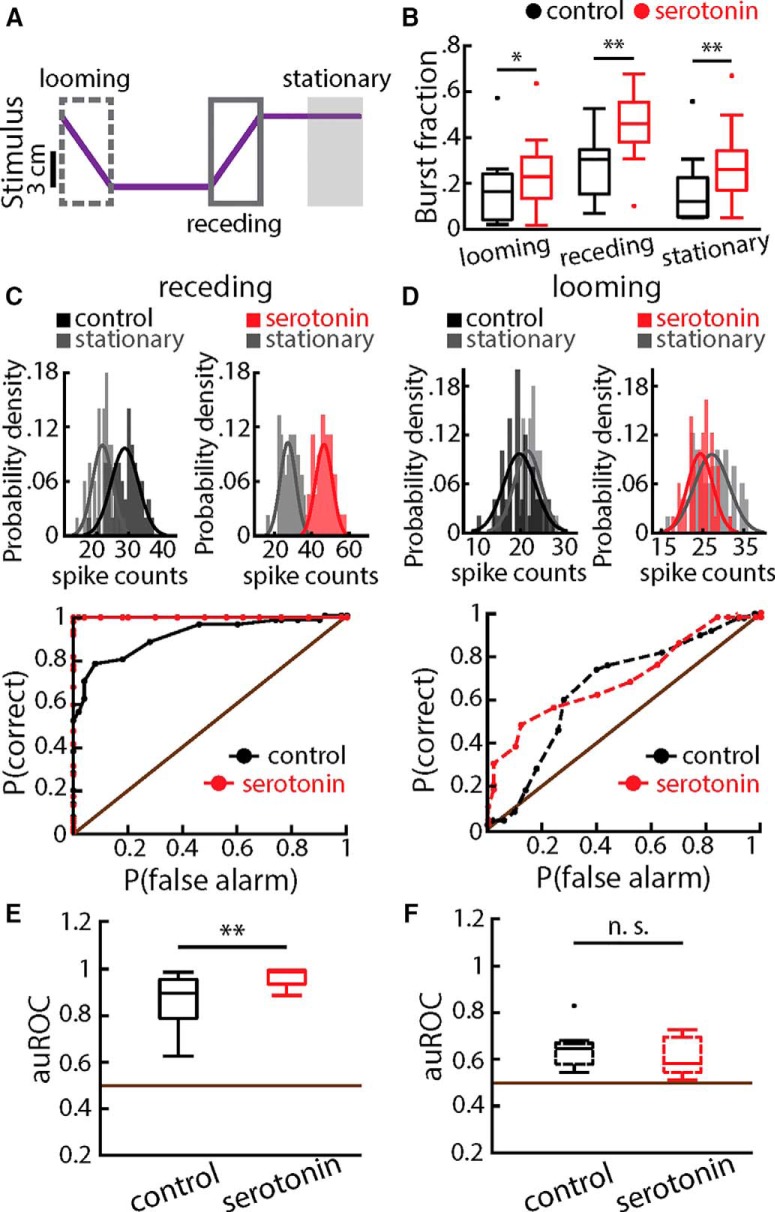
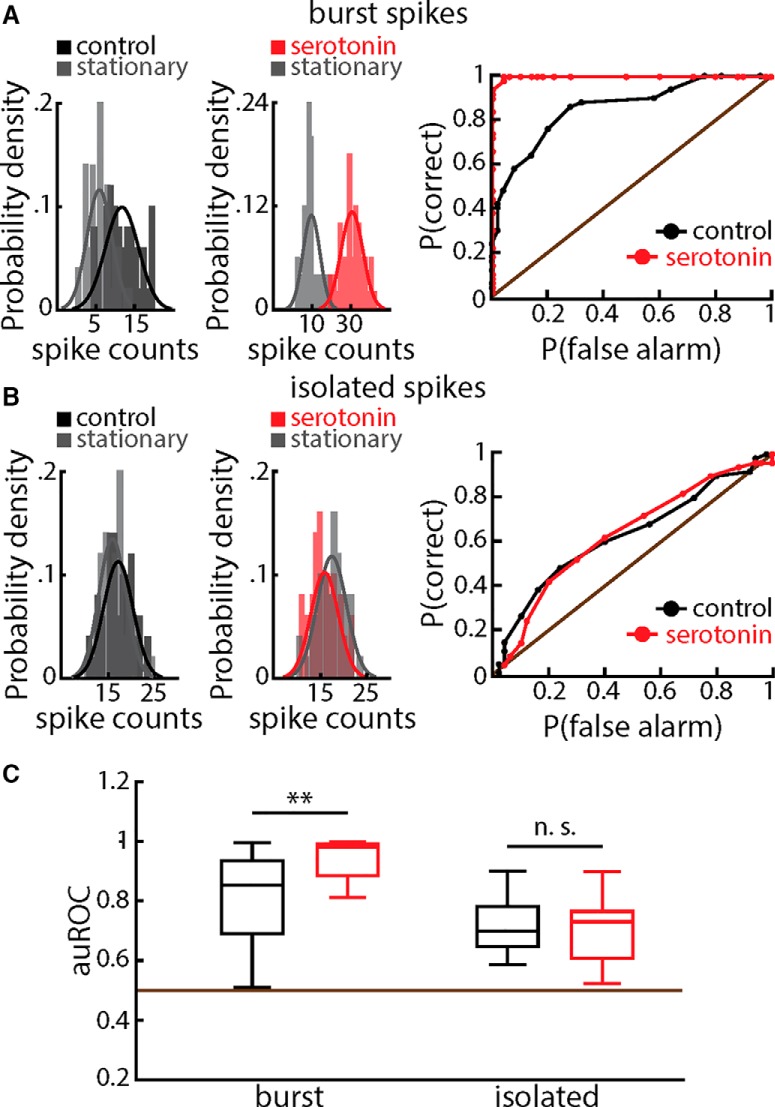
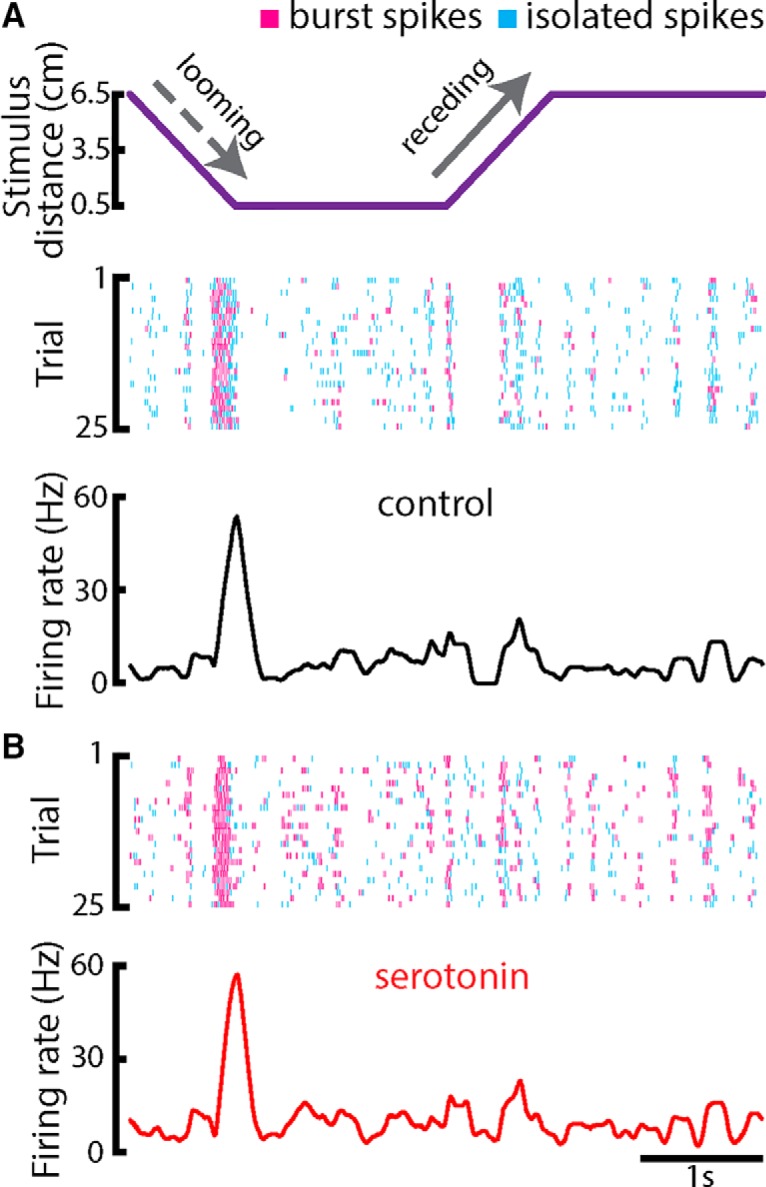
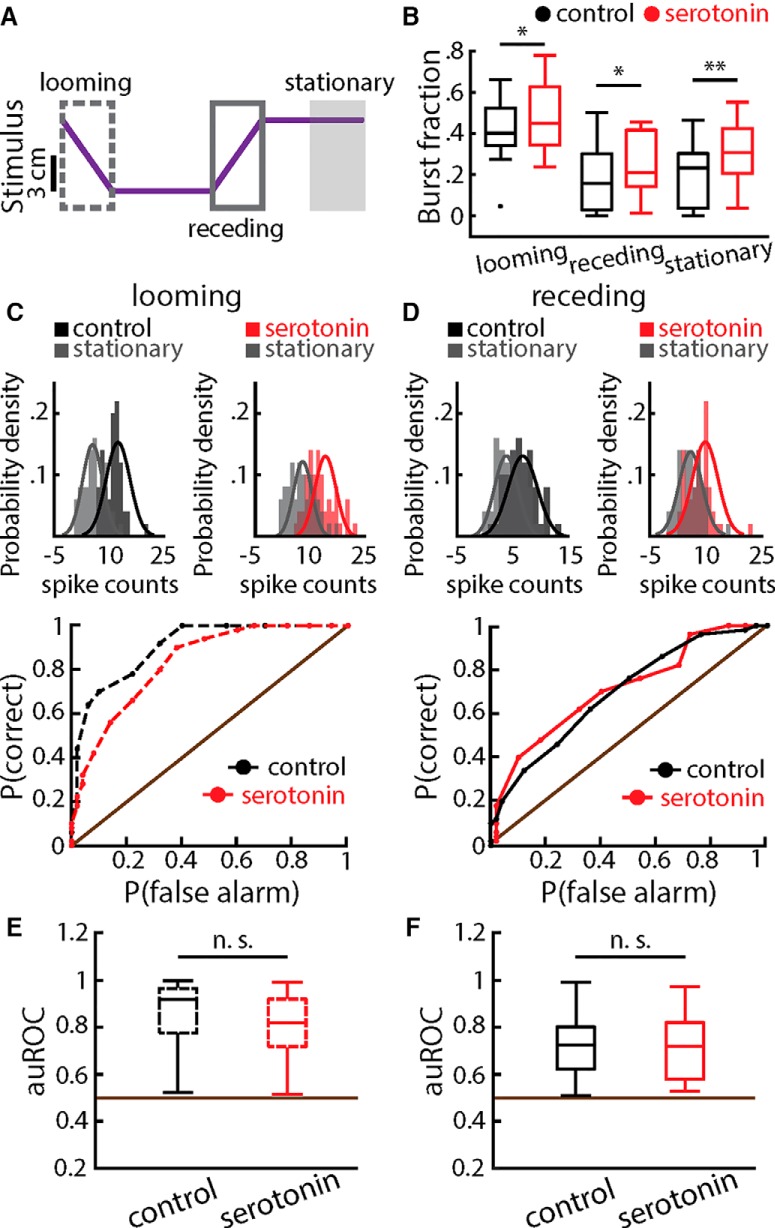
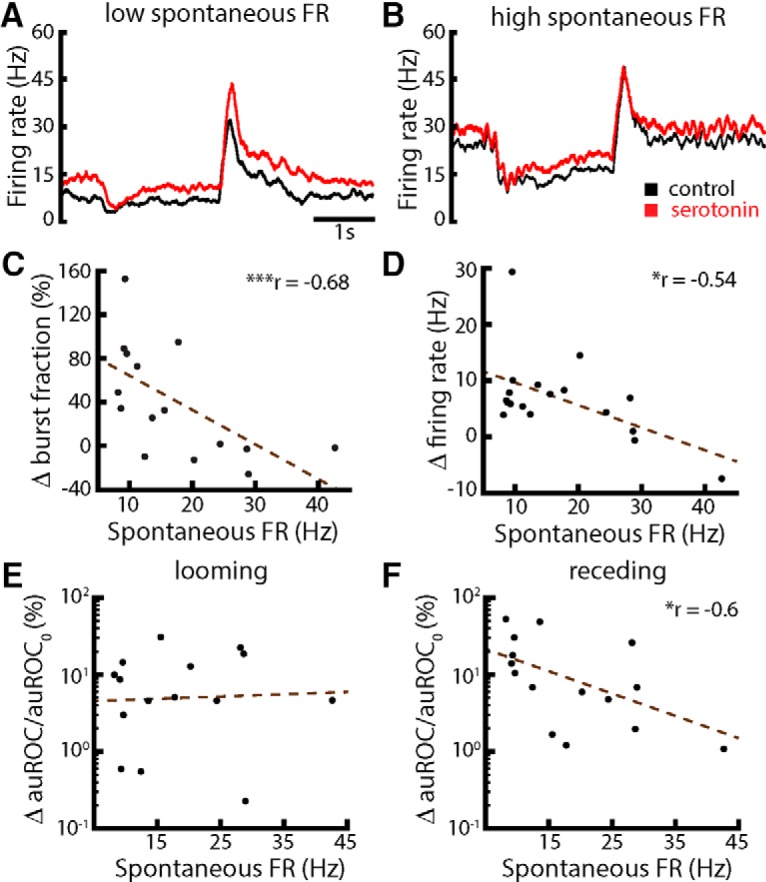
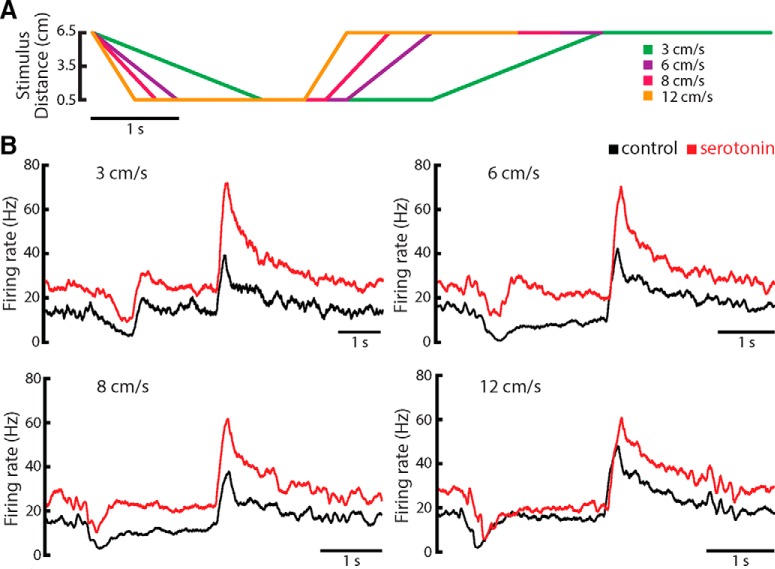
Serotonergic innervation of sensory areas is found ubiquitously across the central nervous system of vertebrates. Here, we used a system's level approach to investigate the role of serotonin on processing motion stimuli in the electrosensory system of the weakly electric fish Apteronotus albifrons. We found that exogenous serotonin application increased the firing activity of pyramidal neural responses to both looming and receding motion. Separating spikes belonging to bursts from those that were isolated revealed that this effect was primarily due to increased burst firing. Moreover, when investigating whether firing activity during stimulation could be discriminated from baseline (i.e., in the absence of stimulation), we found that serotonin increased stimulus discriminability only for some stimuli. This is because increased burst firing was most prominent for these. Further, the effects of serotonin were highly heterogeneous, with some neurons displaying large while others instead displaying minimal changes in responsiveness following serotonin application. Further analysis revealed that serotonin application had the greatest effect on neurons with low baseline firing rates and little to no effect on neurons with high baseline firing rates. Finally, the effects of serotonin on sensory neuron responses were largely independent of object velocity. Our results therefore reveal a novel function for the serotonergic system in selectively enhancing discriminability for motion stimuli.

Keywords: burst firing; feedback; neuromodulation; serotonin; weakly electric fish.


Figures

Figure 1.
Figure 1.
Effects of serotonin on spontaneous ELL pyramidal cell activity. A, Top, Interspike interval (ISI) histogram from a typical ELL pyramidal cell before serotonin application with the x-axis plotted on a logarithmic scale. Inset, ISI histogram from the same cell but with the x-axis plotted on a linear scale. Bottom, ISI histogram from the cell after serotonin application with the x-axis plotted on a logarithmic scale. Inset, ISI histogram from the same cell after serotonin application but with the x-axis plotted on a linear scale. Note that a clear bimodality can be seen from the main panels. The vertical gray lines indicate the chosen burst threshold of 10 ms. B, Change in burst fraction due to serotonin application averaged over our dataset as a function of the burst threshold. The solid line shows the population average and the gray band shows ±1 SEM.
Figure 2.
Figure 2.
Serotonin affects ELL pyramidal cell responses to moving objects through burst firing. A, Schematic representation of the experimental setup. The stimulus (plastic or metal sphere) is aligned to the RF of a given cell and follows a looming (dashed gray line) or a receding (solid gray line) trajectory while the cell’s response is recorded extracellularly. The inset shows the recording electrode that is placed near the cell and a double barrel pipette with glutamate and serotonin that is placed near the cell’s apical dendritic tree. B, Schematics showing one full stimulus cycle and the response of a representative neuron. In a non-matching contrast paradigm, during control condition (black trace) the neuron responds preferentially to receding motion with a group of action potentials occurring at a high frequency rate of discharge (i.e., a burst). This response is enhanced after serotonin application (red trace, compare insets). C, Spiking responses under control (black) and after (red) serotonin application. Shown are the full spike trains (brown), burst spikes (magenta), and isolated spikes (cyan). D, Population-averaged burst fraction (i.e., the fraction of spikes that belong to bursts; left) and mean firing rate (right) before (black) and after (red) serotonin application (n = 13). Stars indicate statistical significance using a signed-rank test (p = 0.0002) and a paired t test (t(12) = −3.4530, p = 0.005), respectively.
Figure 3.
Figure 3.
Serotonin promotes burst firing in response to motion stimuli during a non-matching contrast paradigm. A, Top, object position (lateral distance to the animal’s skin surface) as a function of time. The object’s speed during both looming and receding motion was 8 cm/s. Middle, Raster plot showing an example ELL pyramidal neuron’s spiking response to 25 stimulus presentations (i.e., trials) during control condition. The spikes that belong to bursts are shown in magenta, whereas isolated spikes are shown in cyan. Bottom, PSTH of the neuron computed from 50 trials using all spikes. B, Top, raster plot showing the example neuron’s response to 25 trials after serotonin application. Bottom, PSTH computed from 50 trials using all spikes.
Figure 4.
Figure 4.
Serotonin increases the firing rate during all phases of stimulation. A, Top, object position (lateral distance to the animal’s skin surface) as a function of time. The object’s speed during both looming and receding motion was 8 cm/s. Bottom, PSTH from an example ELL pyramidal neuron computed from all spikes before (black) and after (red) serotonin application. There was a decrease in firing rate during the looming phase (dashed arrow). The firing rate reached its maximum value right after the onset of receding motion during both control (black trace) and after serotonin application (red trace). Note that the firing rate was overall higher during all stimulus phases after serotonin application. B, PSTH from the example ELL pyramidal neuron computed from burst spikes before (black) and after (red) serotonin application. C, PSTH from the example neuron computed using isolated spikes before (black) and after (red) serotonin application.
Figure 5.
Figure 5.
Serotonin increases stimulus detectability for receding but not for looming motion. A, Object position (lateral distance to the animal’s skin surface) as a function of time. The neural responses during looming (dashed gray box) and receding (middle solid gray box) gray boxes were compared to the baseline activity while the object was stationary and located far away from the animal (right gray box). B, Population-averaged burst fractions before (black) and after (red) serotonin application during looming (left), receding (middle), and baseline (right). Stars indicate statistical significance using a paired t test (looming: t(12) = −2.70, p = 0.03, n = 13; receding: t(12) = −3.35, p = 0.009, n = 13; baseline: t(12) = −3.08, p = 0.01, n = 13). C, Top, spike count distributions obtained during baseline (gray) and during receding stimulation (black or red) before (left) and after (right) serotonin application for an example ELL pyramidal cell. Best-fit Gaussian curves are superimposed on each distribution. Bottom, ROC curves from this same example neuron before (black) and after (red) serotonin application. D, Same as C but for looming motion. E, Population-averaged values for the auROC before (black) and after (red) serotonin application for receding motion. The horizontal brown line indicates the chance level. A significant increase was observed after serotonin application (signed-rank test, p = 0.0007, n = 13). F, Same as E but for looming motion. No significant change was observed (t test, t(12) = 1.08, p = 0.301, n = 13).
Figure 6.
Figure 6.
Serotonin increases receding motion stimulus detectability through enhanced burst firing. A, Left, spike count distributions obtained during baseline (gray) and during receding stimulation (black) before serotonin application. Middle, spike count distributions obtained during baseline (gray) and during receding stimulation (red) after serotonin application. Right, ROC curves before (black) and after (red) serotonin application. We used the same example ELL pyramidal cell as in Figure 4. B, Same as A but for isolated spikes. C, Population-averaged auROC values for bursts (left) and isolated spikes (right) before (black) and after (red) serotonin application. A significant increase was observed for burst but not for isolated spikes (burst spikes: signed-rank test, p =.0134; isolated spikes: t test, t(12) = 0.34, p = 0.737, n = 13).
Figure 7.
Figure 7.
Serotonin enhances burst firing during a matching contrast paradigm. A, Top, object position (lateral distance to the animal’s skin surface) as a function of time. The object’s speed during both looming and receding motion was 8 cm/s. Middle, Raster plot showing an example ELL pyramidal neuron’s spiking response to 25 stimulus presentations (i.e., trials) during control condition. The spikes that belong to bursts are shown in magenta whereas isolated spikes are shown in cyan. Bottom, PSTH of the neuron computed from 50 trials using all spikes. B, Top, raster plot showing the example neuron’s response to 25 trials after serotonin application. Bottom, PSTH computed from 50 trials using all spikes.
Figure 8.
Figure 8.
Serotonin does not alter stimulus detectability during at matching contrast paradigm. A, Same as in Figure 4A, object position during a matching contrast paradigm. B, Population-averaged burst fractions before (black) and after (red) serotonin application during looming (left), receding (middle), and baseline (right). Stars indicate statistical significance using a signed-rank test (looming: p = 0.0391, n = 9; receding: p = 0.0273, n = 9; baseline: p = 0.0039, n = 9). C, Top, spike count distributions obtained during baseline (gray) and during looming stimulation (black or red) before (left) and after (right) serotonin application for an example ELL pyramidal cell. Best-fit Gaussian curves are superimposed on each distribution. Bottom, ROC curves from this example neuron before (black) and after (red) serotonin application. D, Same as C but for receding motion. E, Population-averaged auROC before (black) and after (red) serotonin application corresponding to looming motion. The horizontal brown line indicates the chance level. The observed decrease after serotonin application was not significant (signed-rank, p = 0.25, n = 9). F, Same as E but for receding motion. No significant change was observed (signed-rank, p = 0.7344, n = 9).
Figure 9.
Figure 9.
The magnitude of the effect of serotonin on ELL pyramidal cell’s responses to moving objects was negatively correlated with spontaneous firing rate. A, PSTH of a representative cell with low (9.1 Hz) spontaneous firing rate during control (black) and after serotonin application (red). B, Same as A but for a representative cell with high (28.9 Hz) spontaneous firing rate. For both panels, the time scale is the same and the object’s speed during looming and receding motion was 8 cm/s. C, Percentage change in burst fraction [i.e., 100*(BFserotonin – BFcontrol)/BFcontrol] between control and serotonin conditions (measured during baseline period) as a function of spontaneous firing rate measured before serotonin application. Both quantities were significantly correlated (r = −0.68, p = 0.003, n = 15). D, Relative change in firing rate [i.e., 100*(FRserotonin – FRcontrol)/FRcontrol] as a function of the spontaneous firing rate. Both quantities were significantly correlated (r = −0.54, p = 0.02, n = 15). E, Percentage change in auROC [i.e., 100*(auROCserotonin − auROCcontrol)/auROCcontrol] as a function of spontaneous firing rate for looming motion. No significant correlation was observed (r = −0.06, p = 0.84, n = 15). F, Same as E but for receding motion. Both quantities were significantly correlated (r = −0.6, p = 0.03, n = 15).
Figure 10.
Figure 10.
Serotonergic modulation of ELL pyramidal cell activity to motion is speed invariant. A, Object position as a function of time. The object was moved at four different velocities: 3 cm/s (green), 6 cm/s (purple), 8 cm/s (pink), and 12 cm/s (orange). B, PSTH of a representative neuron for each stimulus speed. All the curves follow the same shape with a strong increase in firing rate right after the onset of receding motion and inhibition right at the end of looming motion. Note that the firing rate is higher after serotonin application (red trace) than during control condition (black trace).

Similar articles

Cited by

References

    1. Avila-Akerberg O, Krahe R, Chacron MJ (2010) Neural heterogeneities and stimulus properties affect burst coding in vivo. Neuroscience 168:300–313. 10.1016/j.neuroscience.2010.03.012 - DOI - PMC - PubMed
    1. Bastian J (1981) Electrolocation. II. The effects of moving objects and other electrical stimuli on the activities of two categories of posterior lateral line lobe cells in Apteronotus albifrons . J Comp Physiol A Neuroethol Sens Neural Behav Physiol 144:481–494.
    1. Bastian J (1982) Vision and electroreception. Integration of sensory information in the optic tectum of the weakly electric fish Apteronotus Albifrons. J Comp Physiol A Neuroethol Sens Neural Behav Physiol 147:287–297. 10.1007/BF00609662 - DOI
    1. Bastian J (1986a) Gain control in the electrosensory system mediated by descending inputs to the electrosensory lateral line lobe. J Neurosci 6:553–562. - PMC - PubMed
    1. Bastian J (1986b) Gain control in the electrosensory system. A role for descending projections to the lateral electrosensory lateral line lobe. J Comp Physiol A Neuroethol Sens Neural Behav Physiol 158:505–515. 10.1007/BF00603796 - DOI - PubMed

Publication types

Grants and funding

LinkOut - more resources